ABSTRACT
The cytokine-induced SH2-containing protein CIS belongs to the suppressor of cytokine signaling (SOCS) protein family. Here, we show the critical role of CIS in suppressing natural killer (NK) cell control of tumor initiation and metastasis. Cish-deficient mice were highly resistant to methylcholanthrene-induced sarcoma formation and protected from lung metastasis of B16F10 melanoma and RM-1 prostate carcinoma cells. In contrast, the growth of primary subcutaneous tumors, including those expressing the foreign antigen OVA, was unchanged in Cish-deficient mice. The combination of Cish deficiency and relevant targeted and immuno-therapies such as combined BRAF and MEK inhibitors, immune checkpoint blockade antibodies, IL-2 and type I interferon revealed further improved control of metastasis. The data clearly indicate that targeting CIS promotes NK cell antitumor functions and CIS holds great promise as a novel target in NK cell immunotherapy.
| Abbreviations | ||
| CIS | = | cytokine-induced SH2-containing protein |
| CTLA-4 | = | cytotoxic T-lymphocyte-associated protein-4 |
| IFN | = | interferon |
| Ig | = | immunoglobulin |
| IL | = | interleukin |
| JAK | = | Janus kinase |
| LPS | = | lipopolysaccharide |
| MCA | = | methylcholanthrene |
| MHC | = | major histocompatibility complex |
| NK cell | = | natural killer cell |
| PD-1 | = | programmed cell death protein 1 |
| SOCS | = | suppressor of cytokine signaling |
| STAT | = | signal transducer and activator of transcription |
| TLR | = | toll-like receptor |
| TME | = | tumor microenvironment |
| UTR | = | untranslated region |
| WT | = | wild-type |
Introduction
A new fourth pillar of cancer treatment, immunotherapy, particularly targeting immune checkpoint inhibitors, is now complementing surgery, radiotherapy and chemotherapy.Citation1 Many forms of immune suppression in the local tumor microenvironment (TME) prevent what would otherwise be an effective innate and adaptive immune response to cancer.Citation2 Recently, novel combination therapeutic approaches aimed at re-activating tumor-specific T cells demonstrated a significant portion of late-stage melanoma patients undergoing complete remission.Citation3 Indeed, the majority of these clinically effective immune checkpoint-specific therapies (e.g., ipilimumab, nivolumab, pembrolizumab, and so on) are monoclonal antibodies directed at inhibitory receptors (e.g., CTLA-4 and PD-1) on tumor-infiltrating T cells. However, a significant proportion of cancer patients remains non-responsive or relapses after these contemporary treatments. We contend that other immune cell types such as natural killer (NK) cells must also be targeted to fully realize the potential of immunotherapy. NK cells express an array of germ-line encoded activating and inhibitory receptors that scan for altered protein expression patternsCitation4 and are extremely efficient producers of effector molecules including cytotoxic granules and cytokines (IFN-γ). Currently, major efforts are being undertaken to target receptors on NK cells, but until now the immune checkpoints have been largely restricted to surface inhibitory receptors such as inhibitory killer immunoglobulin-like receptors, NKG2A, and CD96.Citation5,6
The cytokine-induced SH2-containing protein (Cish, encoding CIS) belongs to the suppressor of cytokine signaling (SOCS) protein family and functions as a classical negative feedback loop to inhibit cytokines such as IL-2, IL-3, and erythropoietin.Citation7-9 SOCS genes are induced following cytokine receptor engagement and activation of the JAK/STAT signaling cascade. They primarily function as adaptors for an E3 ubiquitin ligase complex and inhibit cytokine signaling by binding to the receptor complex and/or the associated JAK protein tyrosine kinases, targeting them for proteasomal degradation. In addition, SOCS1 and SOCS3 can directly inhibit JAK enzymatic activity.
NK cell development, proliferation, survival, and activation are dependent on the cytokine IL-15. We recently demonstrated that IL-15 promotes NK cell survival directly by inducing STAT5 phosphorylation and binding to the 3′UTR of the anti-apoptotic gene Mcl1.Citation10 In this study, we also noted that IL-15 stimulation of NK cells resulted in STAT5 binding to Cish. We have recently shown that Cish deletion in mouse NK cells renders them hyperresponsive to IL-15 as revealed by enhanced JAK1/STAT5 activity, proliferation, survival, IFN-γ production, and cytotoxicity. Furthermore, we identified JAK1 as a novel target for CIS-mediated kinase inhibition and E3 ligase activity.Citation11 Consequently, we demonstrated a critical role for CIS in limiting NK cell control of experimental lung metastasis.Citation11 Cish deficiency is also associated with enhanced CD4+ T cell proliferation and greater susceptibility to T-cell-mediated allergic asthma.Citation12 Cish-deficient CD8+ T cells were reported to be hyperproliferative with enhanced activity against B16 melanoma.Citation13 However, the importance of CIS in immune responses to solid tumors and hematological cancers is still unknown.
Here, we now define the important role of CIS in suppressing NK cell control of tumors, in some settings, but not others. In parallel, T cell-mediated control of primary experimental tumors was generally not altered in Cish-deficient mice. Combining Cish deficiency with contemporary targeted and immunotherapies, which promoted NK cell function, further improved control of metastasis. Our data strongly suggest that CIS is an attractive target for NK cell-based immunotherapy.
Results
Loss of Cish protects against experimental metastasis and carcinogen-induced tumors
IL-15-mediated activation of JAK1/3 and STAT5 is critical to NK cell survival in vivo, and Cish is a STAT5 target gene in NK cells. We noted that the loss of CIS significantly enhanced NK cell survival in vivo and in vitro where IL-15 concentrations were limiting (Fig. S1A and B). To investigate the role of CIS in NK cell responses against metastasis, C57BL/6 Cish−/− and control wild-type (WT) mice were challenged intravenously with B16F10 melanoma or RM-1 prostate carcinoma cells. Cish−/− mice exhibited significantly lower numbers of lung metastasis () and survived twice as long as WT mice (). Enhanced killing of B16F10 by Cish−/− NK cells was also observed in vitro (Fig. S1C). Interestingly, depletion of CD8+ T cells did not impact on the number of RM-1 lung metastases, whereas the protection observed in Cish−/− mice was lost upon NK cell depletion or neutralization of IFN-γ (). These results confirm the role of CIS in downregulating NK cell responses and indicate that the genetic ablation of Cish protects against metastasis formation in an NK cell- and IFN-γ-dependent manner. Importantly, the protection from metastasis formation translated into significantly prolonged survival of Cish−/− mice. In concert, Cish−/− mice were highly resistant to methylcholanthrene (MCA)-induced fibrosarcoma formation ( and S2). Depletion of NK cells or neutralization of IFN-γ again significantly reduced the survival of WT and Cish−/− mice and completely abolished the protective effect of Cish deficiency (). The extent of protection from experimental metastasis and de novo carcinogenesis observed in Cish−/− mice is impressive and clearly indicated that targeting CIS holds promise as a novel target for NK-cell-based immunotherapy. These results are consistent with the IL-15 induction of CIS expression in NK cells and the observation that the loss of Cish renders NK cells hypersensitive to IL-15.Citation11
Figure 1. Loss of Cish controls tumor metastasis. (A, B) Groups of 20 B6.WT (Cish+/+) and 21 B6.Cish−/− mice were injected i.v. with either 2 × 10⁵ B16F10 melanoma or RM-1 prostate carcinoma cells. (A) Lungs were harvested on day 14 and macrometastases were counted. Shown is the mean ± SEM of 10 mice per group. (B) The survival of 10–11 mice per group is plotted. (C) Groups of five B6.WT (Cish+/+) and B6.Cish−/− mice were injected i.v. with 2 × 10⁵ RM-1 prostate carcinoma cells and treated on days −1, 0, and 7 relative to tumor inoculation with either control Ig (cIg), 100 μg anti-CD8β (CD8+ T cell depletion), 50 μg anti-asialoGM1 (anti-asGM1; NK cell depletion), or 250 μg anti-IFN-γ antibodies. Lungs were harvested on day 14 and macrometastases were counted. Shown is the mean ± SEM of five mice per group. Statistically significant differences between WT and Cish−/− groups as indicated were determined by (A) the Mann–Whitney U test, (B) the Log-rank Mantel–Cox test, and (C) one-way ANOVA with the Tukey post-test (for multiple comparisons) (*p < 0.05; ***p < 0.001; ****p < 0.0001).
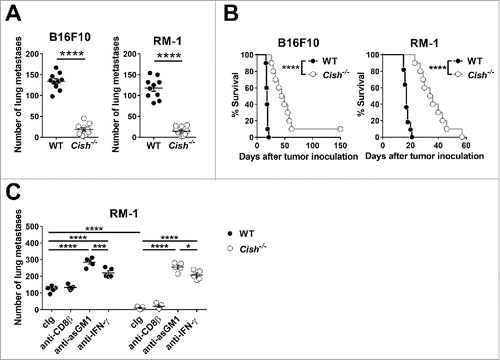
Figure 2. Cish-deficient mice are protected from MCA-induced tumor development. (A) Groups of 15 B6.WT (Cish+/+) and 18 B6.Cish−/− male mice were inoculated s.c. in the hind flank with 300 µg of MCA in 0.1 mL of corn oil. Mice were then monitored for fibrosarcoma development over 250 d, and data were recorded as the percentage tumor free mice (tumors > 3 mm in diameter were recorded as positive). (B) Groups of 16–18 B6.WT (Cish+/+) and 14 B6.Cish−/− male mice were inoculated s.c. in the hind flank with 300 µg of MCA in 0.1 mL of corn oil. Mice were treated with either 250 μg hamster cIg, 50 μg anti-asialoGM1 (anti-asGM1; NK cell depletion) or 250 μg anti-IFN-γ antibodies injected i.p. on days −1, 0, 7, 12, 24, 28, 35, and 42. Mice were monitored for fibrosarcoma development over 200 d. Tumors were measured every week with a caliper square as the product of two perpendicular diameters (mm2). Mice were euthanized when the tumor reached > 150 mm2 in square diameter. Statistically significant survival differences between the groups were determined by the Log-rank Mantel–Cox test (A) followed by the Bonferroni correction for multiple testing (B) (*p < 0.05; ***p < 0.001; ****p < 0.0001).

Cish deficiency does not have a major impact on the progression of hematopoietic malignancies
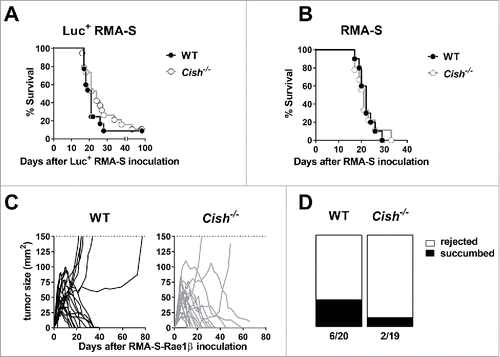
Besides limiting metastasis, NK cells are known to suppress some hematopoietic malignancies. In particular, NK cells control the clearance of MHC class I-deficient cells, such as the RMA-S cell line.Citation14 To our surprise, Cish−/− and WT mice appeared equally susceptible to the intraperitoneal (i.p.) injection and growth of luciferase+ RMA-S lymphoma cells ( and S3A). When injected with lower numbers of the parental RMA-S lymphoma cell line, Cish−/− and WT mice showed superimposable disease latencies (). In line, the growth of primary RMA-S tumors after subcutaneous injection was similar in Cish−/− and WT mice (Fig. S3B). In order to increase the immunogenicity of the cell line further, we used a NKG2D ligand-expressing RMA-S variant. When injected subcutaneously, RMA-S-Rae1β cells gave rise to a solid tumor, which was rejected in 70.0% of WT mice (14/20). Interestingly, a higher proportion of Cish−/− mice (89.5%, 17/19) successfully rejected the tumor ( and ). The protective effect of Cish deficiency in this model could not be explained by differential infiltration of NK cells into the tumor (Fig. S3C–F).
Figure 3. Lack of Cish does not have a major impact on the surveillance of lymphoma. (A) Groups of 10 B6.WT (Cish+/+) and B6.Cish−/− mice were injected i.p. with 5 × 10⁴ luciferase+ RMA-S cells. Mice were monitored for tumor development by in vivo imaging (see Fig. S3). The Kaplan–Meier plot summarizes two independent experiments (p = 0.22; Log-rank Mantel–Cox test). (B) Groups of 10 B6.WT (Cish+/+) and B6.Cish−/− mice were injected i.p. with 1 × 10⁴ parental RMA-S cells. Mice were monitored for tumor development and were euthanized at the point of abdominal swelling and discomfort. The Kaplan–Meier plot shows survival curves of WT and Cish−/− mice (p = 0.96; Log-rank Mantel–Cox test) (C, D) Groups of 9–10 B6.WT (Cish+/+) and B6.Cish−/− mice were injected s.c. with 1×10⁶ RMA-S-Rae1β cells. Tumors were measured every 2–3 d with a caliper square as the product of two perpendicular diameters (mm2). Shown are (C) the tumor growth curves of individual mice and (D) the rejection rate summarized from two independent experiments.
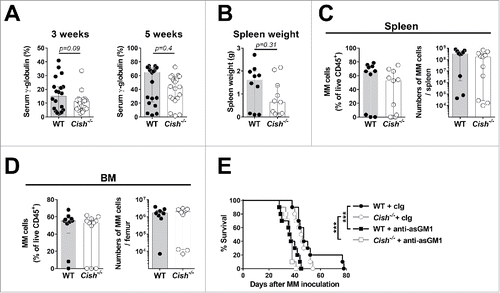
Next, we challenged WT and Cish−/− mice with the Vk*MYC multiple myeloma cell line Vk12653. In this model, the myeloma growth can be followed by measuring the serum γ-globulin levels. Three and five weeks after the transplant, WT and Cish−/− mice displayed similar serum γ-globulin levels (), and consistent with the reported role of NK cells in this model, NK cell-depletion raised serum γ-globulin levels (Fig. S4A).Citation15 Five weeks after multiple myeloma transplantation WT and Cish−/− mice displayed a similar degree of splenomegaly (). In concert, similar numbers of malignant CD155+ plasma cells were observed in the spleen and bone marrow of WT and Cish−/− mice ( and ). An in depth analysis of NK, CD4+, and CD8+ T cell numbers and activation did not reveal any obvious differences between WT and Cish−/− mice at 5 weeks post-myeloma challenge (Fig. S4B–E). Accordingly, in a survival experiment, WT and Cish−/− mice succumbed to multiple myeloma with comparable disease latency. NK cell depletion significantly reduced the survival of multiple myeloma-bearing WT and Cish−/− mice alike (). Thus, despite the notion that NK cells control many hematopoietic malignancies, we observed a variable degree of CIS-dependent protection depending on the tumor model. Whereas Cish deficiency did not seem to have a major impact on the surveillance of RMA-S and Vk12653 multiple myeloma, the rejection of RMA-S-Rae1β tumors was more efficient in Cish−/− mice compared to WT mice.
Figure 4. Cish deficiency does not significantly alter the progression of multiple myeloma. (A) Groups of 10 B6.WT (Cish+/+) and 10–11 B6.Cish−/− mice were injected i.v. with 2 × 10⁶ Vk12653 multiple myeloma cells. Blood was drawn 3 and 5 weeks after tumor transplantation and serum γ-globulin levels were determined. Shown is the median ± interquartile range of 20–21 mice per group summarizing two independent experiments. (B) Groups of 10 B6.WT (Cish+/+) and 11 B6.Cish−/− mice were euthanized after 5 weeks and the spleen weights were documented. The infiltration of multiple myeloma cells (gated on B220−CD138+CD155+ cells) into (C) spleen and (D) bone marrow was analyzed by flow cytometry. Shown is the median ± interquartile range of 10–11 mice per group. The differences were not significant as determined by the Mann–Whitney U test. (E) Groups of 10 B6.WT (Cish+/+) and 10 B6.Cish−/− mice were injected i.v. with 2 × 10⁶ Vk12653 multiple myeloma cells and treated on days −1, 0, 6, 13, 20, and 28 relative to tumor inoculation with either 100 μg rabbit Ig (cIg) or anti-asialoGM1 (anti-asGM1; NK cell depletion). Statistically significant differences in survival were determined by the Log-rank Mantel–Cox test followed by Bonferroni correction for multiple testing (***p < 0.001).
T-cell-mediated control of tumors does not appear CIS dependent
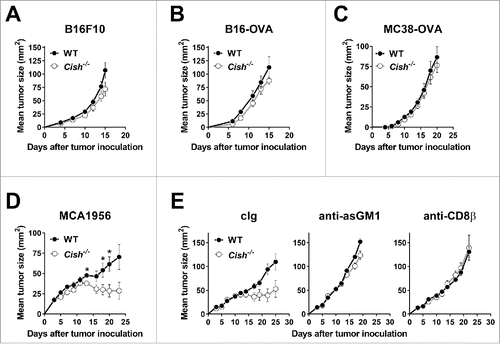
Although NK cells are known to be important in controlling tumor metastases and hematopoietic malignancies, NK cell infiltration of, and their effectiveness against, transplanted mouse subcutaneous or established tumors is limited. Such tumors are often controlled at some level by effector and regulatory T lymphocytes. Different groups have shown the importance of CIS in the function of CD4+ and CD8+ T cells.Citation12,13,16 In line with these studies,Citation12,13 we observed enhanced proliferation of anti-CD3/anti-CD28-stimulated Cish−/− CD4+ and CD8+ T cells compared to WT controls (data not shown). However, Cish deficiency did not alter the growth kinetics of B16F10, B16-OVA, or MC38-OVA tumors compared to WT mice (). The expression of strong foreign antigens such as ovalbumin is known to increase the immunogenicity of tumor cells and engage T cell responses. The clearance of these tumor cells is reportedly controlled by the OVA-specific CD8+ T cells.Citation17-20 In contrast, when injected subcutaneously with the immunogenic MCA-induced fibrosarcoma, MCA1956, Cish−/− mice showed better tumor control than WT mice (). Whereas only 1/10 WT mice spontaneously rejected the tumor, 5/10 Cish−/− mice successfully cleared the primary tumor by day 30 after transplant (Fig. S5). Depletion of NK cells or CD8β+ T cells accelerated tumor growth and abrogated the differences seen in WT and Cish-deficient mice (). Whether NK cells control the growth of MCA1956 tumors directly or whether they play an indirect role by modulating T cell activity remains to be elucidated. Taken together, our data suggest Cish deficiency primarily alters the natural growth of subcutaneous tumors where NK cells are critical.
Figure 5. T cell-mediated control of tumors does not appear CIS dependent. Groups of 10 B6.WT (Cish+/+) and B6.Cish−/− mice were injected s.c. in the hind flank with (A) 1 × 10⁵ B16F10, (B) 1 × 10⁵ B16-OVA, (C) 1 × 10⁶ MC38-OVA, or (D, E) 1 × 10⁶ MCA1956 cells. Tumors were measured every 2–3 d with a caliper square as the product of two perpendicular diameters (mm2). (A–D) Shown is the mean ± SEM of 10 mice per group. (E) Groups of 6–7 B6.WT (Cish+/+) and B6.Cish−/− mice were injected s.c. with 1 × 10⁶ MCA1956 fibrosarcoma cells and treated on days −1, 0, 7, and 14 relative to tumor inoculation with either control Ig (cIg: 50 μg rabbit IgG plus 100 μg rat IgG1), 50 μg anti-asialoGM1 (anti-asGM1; NK cell depletion) or 100 μg anti-CD8β (CD8+ T cell depletion). Shown is the mean ± SEM of 6–7 mice per group. Statistically significant differences between WT and Cish−/− groups as indicated were determined by the Mann–Whitney U test (*p < 0.05).
Cish-deficient NK cells do not have heightened response to TLR agonists
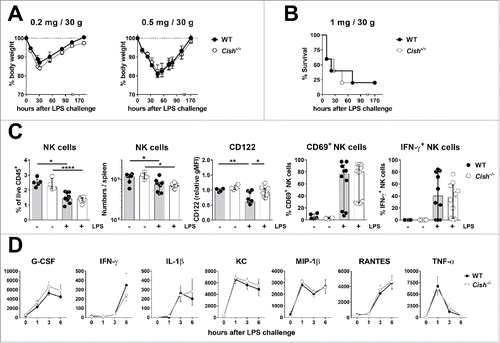
Cish-deficient NK cells are hypersensitive to IL-15 resulting in enhanced NK cell cytotoxicity and IFN-γ release that can translate to dramatically improved antitumor immunity.Citation11 This raises the issue of safety of CIS blockade and whether CIS might generally regulate NK cell response to inflammatory cytokines, in particular those regulated by JAK1. In the context of bacterial and viral infection, pattern recognition pathways including Toll-like receptors (TLR) are activated and induce myeloid cells to produce vast amounts of pro-inflammatory cytokines, such as IL-12, IL-18, and type I IFNs that can activate NK cells. The TLR agonists lipopolysaccharide (LPS) and CpG oligonucleotides signal via TLR-4 and TLR-9, respectively, and when administered in high doses induce a lethal endotoxicosis. WT and Cish−/− mice were challenged with increasing doses of LPS and showed equal severity of endotoxicosis by means of body weight loss () and survival (). Six hours after the i.p. administration of a low dose (0.2 mg/30 g mouse) of LPS, NK cell proportions and absolute numbers were significantly reduced in spleens of Cish−/− and WT mice alike. Interestingly, whereas WT NK cells showed reduced expression of the IL-2Rβ chain (CD122) in response to LPS, Cish−/− NK cells retained normal CD122 levels. Irrespective, a similar fraction of WT and Cish−/− NK cells expressed the activation marker CD69 and produced IFN-γ (). In addition, the cytokine release induced in the first 6 h after LPS challenge was similar in WT and Cish−/− mice ().
Figure 6. Cish−/− mice respond as WT mice to LPS challenge. Groups of five B6.WT (Cish+/+) and B6.Cish−/− mice were injected i.p. with 0.2, 0.5, or 1 mg LPS/30 g mouse as indicated. (A) The weight loss and recovery upon injection of low dose LPS and (B) the survival of B6.WT and B6.Cish−/− mice upon the injection of high dose LPS was similar. Shown is the mean ± SEM of five mice per group. (C) Six hours after the injection of 0.2 mg LPS/30 g mouse, spleens were analyzed for the presence (fraction and absolute numbers) and activation (expression of CD122, CD69, and IFN-γ) of NK cells by flow cytometry (gated on live CD45+TCRβ−NK1.1+DX5+NKp46+). Naive B6.WT (Cish+/+) and B6.Cish−/− mice were used as untreated control. Shown is the summary of two independent experiments represented by the median ± interquartile range of four to six naïve and 10 LPS-challenged mice per group. Statistically significant differences between WT and Cish−/− groups as indicated were determined by one-way ANOVA with the Tukey post-test (*p < 0.05; **p < 0.01; ****p < 0.0001). (D) Serum cytokine levels were determined 7 d before (time point 0), and 1, 3, and 6 h after i.p. injection of 0.2 mg LPS/30 g mouse. Shown is the summary of two independent experiments represented by the mean ± SEM of 10 mice per group.
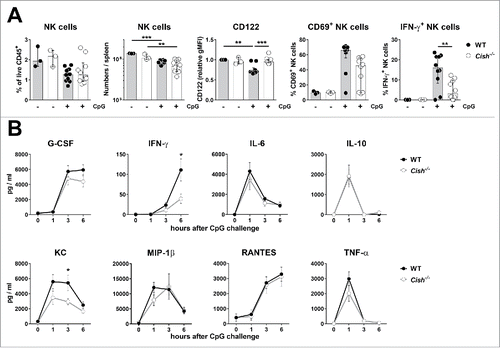
Intraperitoneal injection of 0.1 mg/30 g mouse CpG DNA induced a similar reduction of NK cells in spleens of WT and Cish−/− mice as analyzed after 6 h. In line with the results from the LPS challenge, Cish−/− NK cells retained high expression of CD122, whereas WT NK cells showed a significant fall in CD122 expression levels. Interestingly, CpG challenge induced fewer Cish−/− NK cells to produce IFN-γ (). Although the CpG-induced cytokine release was similar in both WT and Cish−/− mice, a reduced level of IFN-γ at 6 h and a slightly reduced level of KC (IL-8) were observed in Cish−/− mice at 3 h ().
Figure 7. Cish−/− mice respond similarly to WT mice to CpG challenge. Groups of 5 B6.WT (Cish+/+) and B6.Cish−/− mice were injected i.p. with 0.1 mg CpG/30 g mouse. (A) Six hours after the injection of CpG, spleens were analyzed for the presence (fraction and absolute numbers) and activation (expression of CD122, CD69, and IFN-γ) of NK cells by flow cytometry (gated on live CD45+TCRβ−NK1.1+DX5+NKp46+). Three naïve B6.WT (Cish+/+) and B6.Cish−/− mice were used as untreated control. Shown is the summary of two independent experiments represented by the median ± interquartile range of 10 mice per group. Statistically significant differences between WT and Cish−/− groups as indicated were determined by one-way ANOVA with the Tukey post-test (*p < 0.05; **p < 0.01; ***p < 0.001). (B) Serum cytokine levels were determined 10 d before (time point 0), and 1, 3, and 6 h after the i.p. injection of CpG. Shown is the summary of two independent experiments represented by the mean ± SEM of 10 mice per group. Statistically significant differences between WT and Cish−/− groups as indicated were determined by the Mann–Whitney U test (*p < 0.05).
Collectively, our data suggest that inhibiting CIS may be a safe way to enhance NK-cell-mediated tumor surveillance without provoking exaggerated NK cell responses and cytokine induction.
NK cell-dependent anti-metastatic therapies are more effective with Cish deficiency
We next sought to compare Cish deficiency with contemporary immunotherapies, including immune checkpoint blockade (anti-PD-1, anti-CTLA-4, and anti-CD96) and cytokines (IFN-αβ and IL-2) promoting NK cell function, in the B16F10 experimental metastasis model. Notably, the Cish-deficient mice were more resistant to B16F10 lung metastases than the WT mice treated with a regimen of anti-PD-1, type I IFN (IFN-αβ) or IL-2 (). All of these immunotherapies have been used with some degree of success in the treatment of advanced human melanoma. Although the level of B16F10 metastasis was low in cIg-treated Cish−/− mice, both type I IFN and IL-2 treatment appeared to further reduce metastasis (). A further experiment assessed a higher dose challenge with B16F10, and here it became apparent that both the anti-PD-1/anti-CTLA-4 combination and IL-2 were more effective than cIg in the Cish−/− mice (). In particular, low dose IL-2 was ineffective in WT mice, but effective in Cish−/− mice. This improved effect of IL-2 in Cish−/− mice compared with WT mice was also observed in the RMA-S i.p. lymphoma model (). This is of interest, since NK cell-mediated control in WT and Cish−/− mice was equivalent in untreated ( and ) or control treated mice (). An additional experiment performed in a second experimental metastasis model, RM-1, indicated the superior anti-metastatic activity of Cish deficiency combined with anti-PD-1/anti-CTLA-4 or anti-CD96 treatment (). The superior activity of anti-CD96 in Cish−/− mice was also observed in the B16F10 experimental metastasis model (). Collectively, these experiments indicated that the CIS regulation of NK cell anti-metastatic activity was independent of the anti-metastatic activities of immune checkpoint antibodies. Interestingly, although treatment with anti-PD-1/anti-CTLA-4 also significantly inhibited the growth of subcutaneous B16F10 tumors, there was no significant difference in treatment outcome between WT and Cish−/− groups (Fig. S6). In this model, CD8+ T cells are critical for anti-PD-1/anti-CTLA-4 efficacy.
Figure 8. Combining Cish deficiency and checkpoint inhibitors or cytokine stimulation shows an improved anti-metastatic effect. (A) Groups of 5–6 B6.WT (Cish+/+) or B6.Cish−/− mice were injected i.v. with 2 × 10⁵ B16F10 melanoma cells and treated with either control Ig (cIg) (250 μg i.p. on days 0, 3, and 6), anti-PD-1 (250 μg i.p. on days 0, 3, and 6), mouse IFN-αβ (25 μg i.p. on days 0, 1, 2, and 3) or recombinant IL-2 (10,000 IU i.p. on days 0, 1, 2, and 3). (B) Groups of 5–11 B6.WT (Cish+/+) or B6.Cish−/− mice were injected i.v. with 7.5 × 10⁵ B16F10 melanoma cells and treated with either cIg (250 μg i.p. on days 0, 3, and 6), anti-PD1/anti-CTLA-4 combination (250 μg i.p. each on days 0, 3, and 6), or recombinant IL-2 (10,000 IU i.p. on days 0, 1, 2, 3, and 4). (C) Groups of 7–10 B6.WT (Cish+/+) and B6.Cish−/− mice were injected i.p. with 1 × 10⁵ parental RMA-S cells and treated with either PBS or recombinant IL-2 (100,000 IU i.p. on days 0, 1, 2, 3, and 4). Mice were monitored for tumor development and were euthanized at the point of abdominal swelling and discomfort. Improved survival between groups was assessed by the Log-rank Mantel–Cox test. (D) Groups of 5–15 B6.WT (Cish+/+) or B6.Cish−/− mice were injected i.v. with 5×10⁵ RM-1 prostate carcinoma cells and treated with either cIg, anti-CD96, anti-PD-1, anti-CTLA-4, or anti-PD1/anti-CTLA-4 combination (250 μg i.p. each on days 0 and 3). (E) Groups of 8–10 B6.WT (Cish+/+) or B6.Cish−/− mice were injected i.v. with 7.5×10⁵ B16F10 melanoma cells and treated with either 250 μg cIg or anti-CD96 mAb (i.p. on days 0 and 3). (F) Groups of 5–6 B6.WT (Cish+/+) or B6.Cish−/− mice were injected i.v. with 7.5 × 10⁵ LWT1 melanoma cells and treated with either vehicle or PLX4720 (10 mg/kg i.p., daily from days 0 to 6). Lungs were harvested on (A, D, F) day 14 or (B, E) day 13 and macrometastases counted. Individual mice are shown by each symbol and the results are plotted as mean ± SEM. Statistically significant differences as indicated were determined by one-way ANOVA with the Tukey post-test (for multiple comparisons) (*p < 0.5; **p < 0.01; ***p < 0.001; ****p < 0.0001).
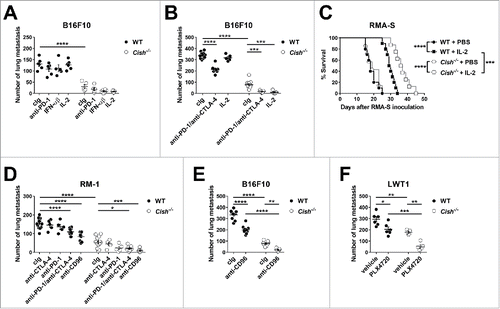
Ultimately, we challenged the mice with the BRAFV600E-mutant metastatic melanoma cell line LWT1 and again observed significantly less lung metastasis in Cish−/− mice. This metastasis was further reduced by treating with the BRAF-inhibitor PLX4720 (), as reported previously in WT mice.Citation21 As shown in Fig. S7A, the combined effect of Cish deficiency and BRAF inhibition is mediated by NK cells, as the depletion of NK cells completely abolished the protective effect of the treatment. The more clinically relevant combination of BRAF and MEK inhibition was extremely effective in Cish−/− mice (Fig. S7B). In summary, these data indicate that targeting CIS combines well with other immunotherapies, and CIS holds great promise as a novel target in NK cell immunotherapy.
Discussion
Our previous study showed that Cish deletion in mouse NK cells rendered them hyperresponsive to IL-15 as revealed by enhanced JAK1/STAT5 activity, proliferation, survival, IFN-γ production, and cytotoxicity ex vivo.Citation11 Loss of Cish also protected mice from experimental lung metastasis of several tumor types.Citation11 In an effort to better understand the role of CIS in tumor control, we have now significantly extended the analysis of Cish−/− mice to include challenge with solid and hematopoietic tumors of various origins and immunogenicities in various locations (including lung, subcutaneous, bone marrow, spleen, and peritoneum). These experiments suggest that not all tumors are significantly controlled by Cish deletion, and as a general rule, the impact of Cish deletion appears restricted to a subset of those tumors where NK cells are critical. We have very limited evidence to support the CIS control of T cell-mediated antitumor immunity, but the complexities of regulatory and effector T cell populations may complicate the picture, and we cannot yet rule out a role for CIS deficiency in regulating T cell antitumor activity.
Given the importance of CIS for IL-15 signaling and the lack of impact of Cish deletion on NK cell response to two major TLR agonists, NK cells critically regulated by IL-12, IL-18, and type I IFN are less likely to be influenced by Cish deletion. This may well apply to the TME where NK cells may engage directly with tumor cells or in crosstalk with antigen-presenting cells, and IL-12, IL-18, and type I IFN are influential. Perhaps in scenarios where NK cell survival maintained by IL-15 is critical, CIS will be more important. Tumor models that were unaffected by Cish deficiency (such as RMA-S in the peritoneum and growing subcutaneously or multiple myeloma in the bone marrow) might be characterized by low levels of IL-15 in the microenvironment, or factors such as IL-12, IL-18, type I IFN might predominate in regulating NK cell behavior. Certainly IL-2 was more effective in Cish−/− mice than WT mice when challenged with RMA-S i.p., despite the lack of importance of CIS in natural NK cell-mediated control of RMA-S in the peritoneum. It is notable that tumor loss of IL-15 correlates with a higher risk of tumor recurrence and reduced patient survival.Citation22 It now remains to better understand the relationship and relative importance of IL-15 and CIS in regulating immune cell control of different tumors. Answering these questions will require new tools, such as CIS and IL-15 reporter mice, to determine whether CIS is only critical when IL-15 signaling is induced. Our data so far suggest that in NK cells CIS is specifically important for IL-15 signaling, whereas it appears to be dispensable for TLR signaling where IL-12 and IL-18, rather than IL-15, are critical for NK cell activation. However, we have only assessed a few mouse hematopoietic tumors in our study, so we cannot yet conclude that IL-15 and CIS are not relevant in these settings. The relative importance of these molecules will undoubtedly be influenced by the tumor site and microenvironment (including antigen presenting cell composition). It was of great interest to us that fibrosarcoma growth initiated by the carcinogen MCA, was so strongly inhibited altogether, delayed, or slowed in Cish−/− mice. This effect was clearly NK cell and IFN-γ-dependent and the findings are very important given that, until this time, the impact of Cish deletion on the process of de novo tumor formation had not been evaluated. This determination should now encourage a much deeper assessment of IL-15 and CIS regulation in situations wherein inflammation may contribute to tumorigenesis.
The additional important findings in this paper concern the enhanced anti-metastatic activities of both those tested targeted therapies and immunotherapies (immune checkpoint antibodies and cytokines) in Cish−/− mice. Anti-CTLA-4 and/or anti-PD1 and anti-CD96 approaches were still effective in Cish−/− mice, indicating the independence of CIS and immune checkpoint regulation of NK cell anti-metastatic activity. Similarly, IFN-αβ and IL-2 were also effective independently of CIS and indeed low dose IL-2, which was completely ineffective in WT mice, was substantially effective in Cish−/− mice. Importantly, targeted therapies such as the BRAF inhibitor, PLX4720, have been shown to mediate their anti-metastatic effect in mice via NK cells.Citation23 Here, we have demonstrated that this activity on NK cells is independent of the function of CIS and indeed exceptional tumor metastatic control can be realized by inhibiting BRAF, MEK, and CIS in combination. These data provide further impetus to better understand the role of IL-15 and CIS in TMEs and to generate specific inhibitors for CIS to complement an armamentarium of NK cell-based cancer therapies.Citation24
Material and methods
Mice
C57BL/6J WT mice were purchased from the Walter and Eliza Hall Institute for Medical Research and/or bred in-house at the QIMR Berghofer Medical Research Institute. C57BL/6Mcl1fl/flNcr1iCre10 and C57BL/6 Cish-deficient mice (Cish−/−; generously provided by James Ihle, St. Jude Children's Research Hospital, Memphis, USA) were bred at the QIMR Berghofer Medical Research Institute and used between 6 and 16 weeks. All mice were sex- and age-matched and groups of 5–11 mice were used per experimental assay. All experiments were approved by the QIMR Berghofer Medical Research Institute Animal Ethics Committee.
Experimental tumor models
B16F10, B16-OVA, RM-1, and MC38-OVAdim cell lines were maintained in cDMEM media containing 10% FBS, 100 U/mL penicillin, 100 μg/mL streptomycin, and 2 mM glutamax. The luciferase+ RMA-S, parental RMA-S and RMA-S-Rae1β lymphoma, MCA1956 fibrosarcoma (derived from a B6.WT female mouse, kind gift of Robert Schreiber), and LWT1 melanoma cell lines were cultured in cRPMI media containing 10% FBS, 100 U/mL penicillin, 100 μg/mL streptomycin, 2 mM glutamax, HEPES, and sodium pyruvate. The in vivo growth of luciferase+ RMA-S cells was monitored as previously described.Citation25 Subcutaneous and intravenous injections were performed in a volume of 100 μL or 200 μL plain media, respectively. Primary transplant and experimental metastases models and the MCA-induced fibrosarcoma model were performed as previously described.Citation17,19,21,26,27 Transplantable Vk*MYC multiple myeloma (MM) cells (Vk12653) were passaged in vivo in Rag2−/− Il2rg−/− mice as previously described.Citation15 The presence of monoclonal immunoglobulin in the blood serum was determined by serum protein electrophoresis (HYDRASYS, Sebia Hydragel), and the percentage of the γ-globulin fraction was quantified using the Phoresis (8.6.1) software.
In vivo treatments
Some groups of mice were treated with cIg (2A3 or 1–1 or polyclonal rabbit), anti-CD96 (3.3, rat IgG1),Citation26 anti-PD-1 (CD279) (RMP1-14, rat IgG2a), anti-CTLA-4 (CD152) (UC10-4F10, hamster IgG, kindly provided by Jeffrey Bluestone), recombinant human IL-2, mouse IFN-αβ,Citation25 BRAF inhibitor (BRAFi, PLX4720 kindly provided by Gideon Bollag, Plexxikon Inc.), or MEK inhibitor (MEKi, trametinib provided by the Royal Brisbane and Women's Hospital Oncology Pharmacy) as indicated. Some mice additionally received either: anti-CD8β (53.5.8) to deplete CD8+ T cells; anti-asialoGM1 to deplete NK cells; or anti-IFN-γ (H22) as previously described.Citation6,26 To induce endotoxicosis, groups of five female mice were injected intraperitoneally with varying doses of LPS (0.2, 0.5, or 1 mg/30 g body weight, obtained from Sigma-Aldrich) or 0.1 mg CpG DNA/30 g body weight (a kind gift from Michael Kershaw at Peter MacCallum Cancer Centre, Melbourne, Australia). Blood was drawn retro-orbitally 7–10 d before and 1, 3, and 6 h post the injection of LPS or CpG, respectively. Serum cytokine levels (G-CSF, IFN-γ, IL-1β, IL-6, IL-10, KC, MIP-1β, RANTES, and TNF-α) were determined with a CBA flex set multiplex cytokine bead array (BD Biosciences). Six hours after LPS or CpG injection, spleens were harvested and erythrocyte-depleted single cell suspensions were immediately analyzed via flow cytometry for the presence and activation (IFN-γ production, CD69, and CD122 expression) of NK cells. In order to pool two independent experiments, the mean fluorescent intensities of CD122 were normalized to the expression on naive B6.WT NK cells in the respective experiment.
Flow cytometry
Single-cell suspensions of spleens or bone marrow were depleted from erythrocytes and stained with monoclonal antibodies in phosphate buffered saline (PBS) containing 1% (v/v) FBS and 2.5 mM EDTA. Dead cells stained by Zombie Yellow or 7-AAD (BioLegend) were excluded from analysis. Absolute cell numbers were determined using the BD liquid counting beads (BD Biosciences). Antibodies specific for B220 (RA3-6B2), CD4 (RM4-5), CD8a (53–6.7), CD45.2 (104–2, Miltenyi), CD49b (DX5, eBioscience), CD69 (H1.2F3), CD122 (TM-β1, BD), CD138 (281–2), CD155 (TX56), IFN-γ (XMG1.2), NK1.1 (PK136, BD or BioLegend), NKp46 (29A1.4), and TCRβ (H57-597) were purchased from BioLegend unless stated otherwise. Intracellular IFN-γ staining was performed by using the BD Cytofix/Cytoperm kit. The data were acquired on a LSR Fortessa 4 laser (BD Biosciences, San Jose, CA) and analyzed with FlowJo Version 10.0.8.
Statistical analysis
Statistical analysis was performed using GraphPad Prism Software V7.01. Statistical tests used were the Mann–Whitney U test, one-way ANOVA with the Tukey post-test (for multiple comparisons) and Log-rank Mantel–Cox test (for comparison of 2 survival curves, followed by Bonferroni correction for comparison of > 2 survival curves). Data were considered to be statistically significant if the p value was equal to or less than 0.05.
Disclosure and potential conflict of interest
MJS has research agreements with Medimmune and Bristol Myers Squibb. Other authors declare that they have no conflict of interest.
Supplementary_materials.zip
Download Zip (385.9 KB)Acknowledgments
The authors are grateful to James Ihle for providing the Cish−/− mice, and Robert Schreiber for providing the MCA1956 fibrosarcoma cell line. The authors thank Liam Town and Kate Elder for breeding, genotyping, maintenance, and care of the mice used in this study. We thank Arabella Young for helpful discussion.
Funding
This work was supported in part by the National Health and Medical Research Council (NHMRC) project grants 1049407, 1066770 and 1057852 and program grant 1016647. E.M. Putz was supported by an Erwin Schroedinger Fellowship of the Austrian Science Fund (J-3635). N.D. Huntington by a Melanoma Research Grant from the Harry J Lloyd Charitable Trust and R.B. Delconte by a Leukaemia Foundation scholarship. C. Guillerey and M.J. Smyth were supported by NHMRC Early Career (1107417) and Senior Principal Research Fellowships (1078671), respectively. This work was also supported in part by an NHMRC Independent Research Institute Infrastructure Support scheme grant and a Victorian State Government Operational Infrastructure Scheme grant.
References
- Smyth MJ, Ngiow SF, Ribas A, Teng MW. Combination cancer immunotherapies tailored to the tumour microenvironment. Nat Rev Clin Oncol 2016; 13:143-58; PMID:26598942; http://dx.doi.org/10.1038/nrclinonc.2015.209
- Munn DH, Bronte V. Immune suppressive mechanisms in the tumor microenvironment. Curr Opin Immunol 2016; 39:1-6; PMID:26609943; http://dx.doi.org/10.1016/j.coi.2015.10.009
- Larkin J, Chiarion-Sileni V, Gonzalez R, Grob JJ, Cowey CL, Lao CD, Schadendorf D, Dummer R, Smylie M, Rutkowski P et al. Combined Nivolumab and Ipilimumab or Monotherapy in Untreated Melanoma. N Engl J Med 2015; 373:23-34; PMID:26027431; http://dx.doi.org/10.1056/NEJMoa1504030
- Martinet L, Smyth MJ. Balancing natural killer cell activation through paired receptors. Nat Rev Immunol 2015; 15:243-54; PMID:25743219; http://dx.doi.org/10.1038/nri3799
- Vivier E, Ugolini S, Blaise D, Chabannon C, Brossay L. Targeting natural killer cells and natural killer T cells in cancer. Nat Rev Immunol 2012; 12:239-52; PMID:22437937; http://dx.doi.org/10.1038/nri3174
- Blake SJ, Stannard K, Liu J, Allen S, Yong MC, Mittal D, Aguilera AR, Miles JJ, Lutzky VP, de Andrade LF et al. Suppression of Metastases Using a New Lymphocyte Checkpoint Target for Cancer Immunotherapy. Cancer Discov 2016; 6:446-59; PMID:26787820; http://dx.doi.org/10.1158/2159-8290.CD-15-0944
- Yoshimura A, Ohkubo T, Kiguchi T, Jenkins NA, Gilbert DJ, Copeland NG, Hara T, Miyajima A. A novel cytokine-inducible gene CIS encodes an SH2-containing protein that binds to tyrosine-phosphorylated interleukin 3 and erythropoietin receptors. EMBO J 1995; 14:2816-26; PMID:7796808
- Matsumoto A, Masuhara M, Mitsui K, Yokouchi M, Ohtsubo M, Misawa H, Miyajima A, Yoshimura A. CIS, a cytokine inducible SH2 protein, is a target of the JAK-STAT5 pathway and modulates STAT5 activation. Blood 1997; 89:3148-54; PMID:9129017
- Aman MJ, Migone TS, Sasaki A, Ascherman DP, Zhu M, Soldaini E, Imada K, Miyajima A, Yoshimura A, Leonard WJ. CIS associates with the interleukin-2 receptor beta chain and inhibits interleukin-2-dependent signaling. J Biol Chem 1999; 274:30266-72; PMID:10514520; http://dx.doi.org/10.1074/jbc.274.42.30266
- Sathe P, Delconte RB, Souza-Fonseca-Guimaraes F, Seillet C, Chopin M, Vandenberg CJ, Rankin LC, Mielke LA, Vikstrom I, Kolesnik TB et al. Innate immunodeficiency following genetic ablation of Mcl1 in natural killer cells. Nat Commun 2014; 5:4539; PMID:25119382; http://dx.doi.org/10.1038/ncomms5539
- Delconte RB KT, Dagley LF, Rautela J, Shi W, Putz EM, Stannard K, Zhang JG, Teh C, Firth M, Ushiki T et al. CIS is a potent checkpoint in NK cell-mediated tumour immunity. Nat Immunol 2016; 17(7):816-24; PMID:27213690; http://dx.doi.org/10.1038/ni.3470
- Yang XO, Zhang H, Kim BS, Niu X, Peng J, Chen Y, Kerketta R, Lee YH, Chang SH, Corry DB et al. The signaling suppressor CIS controls proallergic T cell development and allergic airway inflammation. Nat Immunol 2013; 14:732-40; PMID:23727894; http://dx.doi.org/10.1038/ni.2633
- Palmer DC, Guittard GC, Franco Z, Crompton JG, Eil RL, Patel SJ, Ji Y, Van Panhuys N, Klebanoff CA, Sukumar M et al. Cish actively silences TCR signaling in CD8+T cells to maintain tumor tolerance. J Exp Med 2015; 212:2095-113; PMID:26527801; http://dx.doi.org/10.1084/jem.20150304
- Smyth MJ, Kelly JM, Baxter AG, Korner H, Sedgwick JD. An essential role for tumor necrosis factor in natural killer cell-mediated tumor rejection in the peritoneum. J Exp Med 1998; 188:1611-9; PMID:9802973; http://dx.doi.org/10.1084/jem.188.9.1611
- Guillerey C, Ferrari de Andrade L, Vuckovic S, Miles K, Ngiow SF, Yong MC, Teng MW, Colonna M, Ritchie DS, Chesi M et al. Immunosurveillance and therapy of multiple myeloma are CD226 dependent. J Clin Invest 2015; 125:2077-89; PMID:25893601; http://dx.doi.org/10.1172/JCI77181
- Li S, Chen S, Xu X, Sundstedt A, Paulsson KM, Anderson P, Karlsson S, Sjögren HO, Wang P. Cytokine-induced Src homology 2 protein (CIS) promotes T cell receptor-mediated proliferation and prolongs survival of activated T cells. J Exp Med 2000; 191:985-94; PMID:10727460; http://dx.doi.org/10.1084/jem.191.6.985
- Gilfillan S, Chan CJ, Cella M, Haynes NM, Rapaport AS, Boles KS, Andrews DM, Smyth MJ, Colonna M. DNAM-1 promotes activation of cytotoxic lymphocytes by nonprofessional antigen-presenting cells and tumors. J Exp Med 2008; 205:2965-73; PMID:19029380; http://dx.doi.org/10.1084/jem.20081752
- Allard B, Pommey S, Smyth MJ, Stagg J. Targeting CD73 enhances the antitumor activity of anti-PD-1 and anti-CTLA-4 mAbs. Clin Cancer Res 2013; 19:5626-35; PMID:23983257; http://dx.doi.org/10.1158/1078-0432.CCR-13-0545
- Klages K, Mayer CT, Lahl K, Loddenkemper C, Teng MW, Ngiow SF, Smyth MJ, Hamann A, Huehn J, Sparwasser T. Selective depletion of Foxp3+ regulatory T cells improves effective therapeutic vaccination against established melanoma. Cancer Res 2010; 70:7788-99; PMID:20924102; http://dx.doi.org/10.1158/0008-5472.CAN-10-1736
- Ngiow SF, von Scheidt B, Moller A, Smyth MJ, Teng MW. The interaction between murine melanoma and the immune system reveals that prolonged responses predispose for autoimmunity. Oncoimmunology 2013; 2:e23036; PMID:23524369; http://dx.doi.org/10.4161/onci.23036
- Ferrari de Andrade L, Ngiow SF, Stannard K, Rusakiewicz S, Kalimutho M, Khanna KK, Tey SK, Takeda K, Zitvogel L, Martinet L, Smyth MJ. Natural killer cells are essential for the ability of BRAF inhibitors to control BRAFV600E-mutant metastatic melanoma. Cancer Res 2014; 74:7298-308; PMID:25351955; http://dx.doi.org/10.1158/0008-5472.CAN-14-1339
- Mlecnik B, Bindea G, Angell HK, Sasso MS, Obenauf AC, Fredriksen T, Lafontaine L, Bilocq AM, Kirilovsky A, Tosolini M et al. Functional network pipeline reveals genetic determinants associated with in situ lymphocyte proliferation and survival of cancer patients. Sci Transl Med 2014; 6:228ra37; PMID:24648340; http://dx.doi.org/10.1126/scitranslmed.3007240
- de Andrade LF, Ngiow SF, Martinet L, Smyth MJ. Natural Killer cell control of mutant melanoma during targeted therapy. Oncoimmunology 2015; 4:e998119; PMID:26137412; http://dx.doi.org/10.1080/2162402X.2014.998119
- Guillerey C, Huntington ND, Smyth MJ. Targeting natural killer cells in cancer immunotherapy. Nat Immunol 2016; 17:1025-36; PMID:27540992; http://dx.doi.org/10.1038/ni.3518
- Souza-Fonseca-Guimaraes F, Young A, Mittal D, Martinet L, Bruedigam C, Takeda K, Andoniou CE, Degli-Esposti MA, Hill GR, Smyth MJ. NK cells require IL-28R for optimal in vivo activity. Proc Natl Acad Sci U S A 2015; 112:E2376-84; PMID:25901316; http://dx.doi.org/10.1073/pnas.1424241112
- Chan CJ, Martinet L, Gilfillan S, Souza-Fonseca-Guimaraes F, Chow MT, Town L, Ritchie DS, Colonna M, Andrews DM, Smyth MJ. The receptors CD96 and CD226 oppose each other in the regulation of natural killer cell functions. Nat Immunol 2014; 15:431-8; PMID:24658051; http://dx.doi.org/10.1038/ni.2850
- Guillerey C, Chow MT, Miles K, Olver S, Sceneay J, Takeda K, Möller A, Smyth MJ. Toll-like receptor 3 regulates NK cell responses to cytokines and controls experimental metastasis. Oncoimmunology 2015; 4:e1027468; PMID:26405596; http://dx.doi.org/10.1080/2162402X.2015.1027468
