
ABSTRACT
Indoleamine 2,3-deoxygenase 1 (IDO1) induces immune tolerance in the tumor microenvironment (TME) and is recognized as a potential therapeutic target. We studied the expression of both IDO1 and the related tryptophan 2,3-dioxygenase (TDO) in several different subtypes of cutaneous T-cell lymphoma (CTCL), and evaluated the kynurenine (KYN) pathway in the local TME and in patient sera. Specimens from the total of 90 CTCL patients, including mycosis fungoides (MF, n = 37), lymphomatoid papulosis (LyP, n = 36), primary cutaneous anaplastic large cell lymphoma (pcALCL, n = 4), subcutaneous panniculitis-like T-cell lymphoma (SPTCL n = 13), and 10 patients with inflammatory lichen ruber planus (LRP), were analyzed by immunohistochemistry (IHC), immunofluorescence (IF), quantitative PCR, and/or liquid chromatography–tandem mass spectrometry (LC–MS/MS). Three CTCL cell lines also were studied. Expression of both IDO1 and TDO was upregulated in CTCL. In MF specimens and in the MF cell line MyLa2000, IDO1 expression exceeded that of TDO, whereas the opposite was true for LyP, ALCL, and corresponding Mac1/2A cell lines. The spectrum of IDO1-expressing cell types differed among CTCL subtypes and was reflected in the clinical behavior. In MF, SPTCL, and LyP, IDO1 was expressed by malignant cells and by CD33+ myeloid-derived suppressor cells, whereas in SPTCL CD163+ tumor-associated macrophages also expressed IDO1. Significantly elevated serum KYN/Trp ratios were found in patients with advanced stages of MF. Epacadostat, an IDO1 inhibitor, induced a clear decrease in KYN concentration in cell culture. These results show the importance of IDO1/TDO-induced immunosuppression in CTCL and emphasize its role as a new therapeutic target.
Abbreviations
| APC | = | antigen presenting cell |
| CTCL | = | cutaneous T-cell lymphoma |
| CTLA-4 | = | cytotoxic T-lymphocyte associated protein 4 |
| DC | = | dendritic cell |
| IDO1 | = | indoleamine-2,3-dioxygenase 1 |
| KYN | = | kynurenine |
| LRP | = | lichen ruber planus |
| LyP | = | lymphomatoid papulosis |
| MF | = | mycosis fungoides |
| MDSC | = | myeloid-derived suppressor cell |
| pcALCL | = | primary cutaneous anaplastic large cell lymphoma |
| PD | = | programmed cell death |
| SPTCL | = | subcutaneouos panniculitis-like T cell lymphoma |
| Trp | = | tryptophan |
| TDO | = | tryptophan-2,3-dioxygenase |
| TAM | = | tumor-associated macrophage |
| TME | = | tumor microenvironment |
Introduction
Prognostic and therapeutic implications of tissue and serum levels of indoleamine 2,3-dioxygenase 1 (IDO1 also known as IDO), tryptophan (Trp), and kynurenine (KYN) are currently of great interest in cancer research. IDO1-catalyzed depletion of Trp in the tumor microenvironment (TME) results in release of soluble KYN and downstream metabolites, renders regulatory T cells (Tregs) and antigen presenting cells (APCs) tolerogenic, and inhibits antitumor T cell responses.Citation1 Three enzymes, namely IDO1, tryptophan 2,3-dioxygenase (TDO, also known as TDO2), and indoleamine 2,3-dioxygenase 2 (IDO2), catabolize the same rate-limiting step in the conversion of Trp into KYN.Citation2 IDO1 and TDO share limited structural homology but have distinct enzymatic properties and differ in their expression profile in normal and neoplastic tissues.Citation3 Constitutive expression of IDO1 occurs in the placenta, eye, pancreas, eosinophils, and certain dendritic cell (DC) subsets. Many malignant cells, tumor-associated cells including myeloid-derived suppressor cells (MDSCs) and macrophages (TAMs) express IDO1 and its upregulation has been reported in human neoplasms,Citation4,5 including HodgkinCitation6 systemic anaplastic large cell lymphoma,Citation7 and adult T-cell leukemia/lymphoma (ATLL).Citation8
IDO1 expression is actively induced by inflammation and T cell activation. Interestingly, as a counter-regulatory action, IDO1 further acts to suppress these same signals. This is advantageous when IDO1 is controlling harmful inflammation but unfavorable if suppressing antitumor responses.Citation1 IDO1 also plays an important role in peripheral tolerance required to suppress autoimmunity. In these conditions, IDO1 is expressed mostly by APCs, such as DCs and macrophages, in response to signals like interferon-gamma (IFNγ) or activation of signal transducer and activator of transcription 3 (STAT3).Citation9 Overall, IDO1 can regulate inflammatory responses and change the local milieu from immunogenic to tolerogenic.Citation10,9,1 Strong TDO expression has been observed mainly in hepatocellular carcinoma.Citation3,11 The nature of TDO-expressing cells in tumors is poorly characterized and even less is known about IDO2.Citation12,13,14,15 We reported that IDO1 is among the most highly upregulated genes in subcutaneous panniculitis-like T-cell lymphoma (SPTCL),Citation16 which is a rare form of CTCL with a favorable prognosis and good response to immunosuppressive therapy.Citation17,18 The same study showed upregulation of CTLA-4 and PD-L1 in SPTCL.Citation16 These checkpoint molecules are among the most promising therapeutic targets for cancer immunotherapy. In ongoing clinical trials for multiple solid tumor patients, CTLA-4 and PD-1/PD-L1- targeting antibodies are combined with IDO1 inhibitors.Citation1,19
Since the TME and, in particular, tumor-infiltrating macrophages and DCs are believed to be involved in tumor progression and treatment resistance (reviewed in Citationref. 20), we undertook this study to clarify the cell-specific expression of IDO1 in additional types of CTCL, including lymphomatoid papulosis (LyP), primary cutaneous anaplastic large cell lymphoma (pcALCL), and mycosis fungoides (MF). LyP and pcALCL share a CD30+ immunophenotype and favorable prognosis. LyP is a chronic papulonecrotic or papulonodular skin disease with histology suggestive of malignant lymphoma but with spontaneous regression.Citation21 Spontaneous regressions of skin tumors are less frequent in pcALCL. LyP and MF may share a similar clonal T cell origin.Citation22 The risk of a secondary lymphoma is high in LyP patients, with 10–40% developing other lymphomas.Citation23 We compared the expression of IDO1, TDO, and KYN in the CD30+ lymphoproliferative Mac1/2A cell linesCitation24 and the MF-derived cell line MyLa2000.Citation25 To further understand the systemic immunosuppressive effects, we analyzed serum levels of Trp, KYN, and other intermediates of the KYN pathway in MF and LyP patients.
Results
Converse expression patterns of IDO1 and TDO in CTCL subgroups
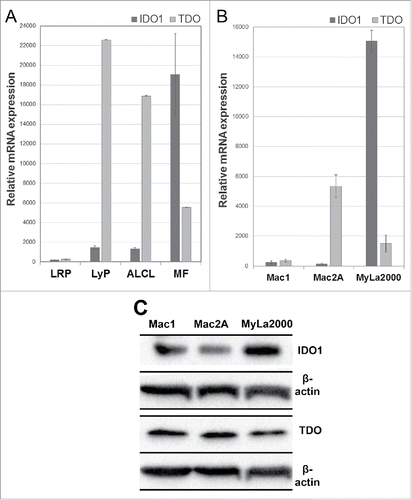
In MF, the relative mRNA expression level of IDO1 was increased 3- to 4-fold compared with the expression of TDO (). Interestingly, in LyP and ALCL the opposite was true; with TDO mRNA expression exceeded that of IDO1 by approximately 10-fold. A concordant disparate expression profile was found in representative cell lines, too. Accordingly, IDO1 expression in the MF-derived MyLa2000 cell line was almost 10-fold higher than that of TDO and vice versa in Mac2A representing ALCL (). Similar conversed expression patterns were observed using western blotting analysis (). MyLa2000 was chosen as calibrator (relative density value 1) and after normalization against the density values of β-actin, the adjusted density values for IDO1 in Mac1 and Mac2A cells were 0.48 and 0.4, respectively. Likewise, the corresponding density values for TDO were 1.43 and 1.45, respectively. Thus, IDO1 is 0.5-fold downregulated and TDO2 is approximately 1.4-fold upregulated in Mac1 and Mac2A cell lines compared with Myla2000.
Figure 1. Gene expression of IDO1 and TDO in CTCL skin specimens and cell lines. Relative mRNA levels in (A) FFPE skin specimens of LRP, LyP, ALCL, MF, and in (B) the cell lines Mac1 (LyP-derived), Mac2A (LyP-derived), and MyLa2000 (MF-derived). mRNA expression levels are presented as mean +/− SD. (C) Western blot analysis of CTCL cell lines. A densitometer was used to evaluate the protein expressions and the adjusted density values for IDO1 and TDO fragments were calculated. MyLa2000 was chosen as calibrator (relative density value 1) and after normalization against β-actin, the adjusted density values for IDO1 in Mac1 and Mac2A cells were 0.48 and 0.4, respectively. Likewise, the corresponding density values for TDO were 1.43 and 1.45, respectively.
Immunohistochemical (IHC) analysis of formalin-fixed paraffin-embedded (FFPE) sections revealed protein expression of IDO1 and TDO to be substantially expressed in all studied CTCL subgroups (). Inflammatory or non-malignant cells accounted mostly for IDO1 expression (). In MF, approximately 10% of morphologically malignant lymphocytes expressed IDO1, whereas IDO1-positive macrophages often surrounded the malignant cells (). Interestingly, TDO expression dominated especially in LyP and ALCL (). TDO was expressed by most of the large atypical cells in the inflammatory infiltrate in LyP () as well as in malignant lymphocytes in Pautrier microabscesses of MF (). In SPCTL, TDO was also expressed by the malignant cells surrounding the adipocytes ().
Figure 2. Relative frequencies of IDO1 and TDO expression in LRP and in each CTCL subgroup. The shade code indicates the percentage of the mononuclear cells expressing the given marker; +10–25% (light gray), ++ 26–50% (gray), and +++ >50% (dark gray).
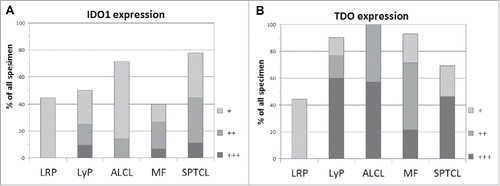
Figure 3. Expression of IDO1, TDO, and KYN in tissue specimens of CTCL as determined by immunohistochemistry. (A) Expression of IDO1 in LyP. (B) Expression of IDO1 in TME of MF specimen and in macrophages surrounding the malignant cells (enlarged insert, upper right corner). (C) IDO-positive cells surrounding the adipocytes in SPTCL, (D) Expression of TDO in LyP. (E) Expression of TDO in MF. (F) Expression of TDO in SPTCL (G) Expression of KYN in LyP. (H) Expression of KYN in MF. (I) Expression of KYN in SPTCL. (Scale bar 20 µm and 40x magnification).
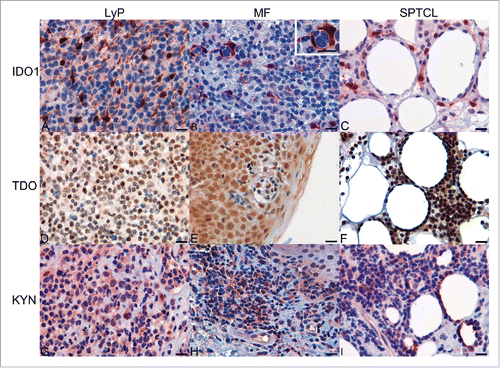
Since IDO1 and TDO catabolize conversion of Trp to KYN, we also examined KYN abundance in IDO1-expressing skin specimens. Ten of twelve IDO1-expressing LyP and all IDO1-expressing MF samples showed sparse or moderate nuclear and/or cytosolic KYN (). Malignant cells also contained KYN in MF, () and KYN was detected in morphologically malignant cells surrounding adipocytes in SPTCL ().
IDO1 is expressed by different cell populations in CTCL subgroups
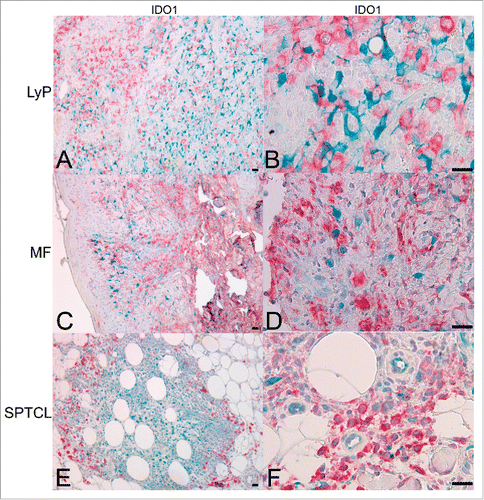
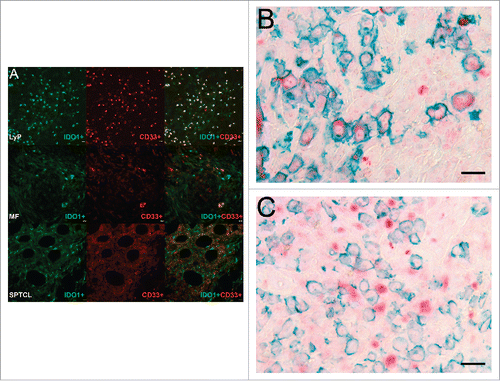
We next identified IDO1-expressing cells in the lymphoma microenvironment by performing double IHC and IF staining. Both techniques revealed that the cell types expressing IDO1 in the microenvironment differed between LyP, MF, and SPTCL. LyP and MF contained considerable numbers of CD163+ TAMs, but they did not express IDO1 (, respectively). In SPTCL, CD163+ TAMs surrounding the subcutaneous malignant lymphocyte infiltrates expressed IDO1 (). Also, a proportion of the morphologically malignant lymphocytes in SPTCL ( and Citationref. 16) and in MF expressed IDO1 (ca. 10%, ).
Figure 4. IDO1 is expressed in CD163+ TAMs in SPTCL but not in MF or LyP skin lesions. Double IHC staining for IDO1 (turquoise) and CD163 (red) showing (A and B) LyP lesions and (C and D) MF lesions with separate cells expressing either IDO1 or CD163 (10x, and 40x, respectively), (E and F) Double positive IDO1+/CD163+ TAMs are seen surrounding the periadipocytic SPTCL infiltrate like a protective wall (10x and 40x, respectively). Light hematoxylin counterstaining. (Scale bar 20 µm). TAM, tumor-associated macrophage.
Furthermore, we found CD33+ myeloid derived suppressor cells (MDSCs) to express IDO1 in all studied CTCL subtypes (). In the inflammatory infiltrates of some LyP samples, up to 30% of the cells were IDO1+ MDSCs (), clearly exceeding the number of double-positive cells in MF (). Interestingly, in some MF specimens the IDO1-expressing cells were CD33-negative. This indicates the presence of yet another IDO1-expressing cell population in MF awaiting identification. Double and single positive cells for IDO1 and CD33 were found to occur frequently in SPTCL (). In LyP, IDO1 was expressed only by a limited number of CD30+ cells (red) (), whereas other cell types in the TME accounted mostly for IDO1 expression (green) ().
Figure 5. CD33+/IDO1+ expressing MDSCs are found in CTCL. (A) Double immunofluorescence staining of CD33 (red) and IDO1 (green) in typical LyP, MF, and SPTCL specimens. The top panel row shows a LyP tissue section with many strong double positive IDO1+/CD33+ cells (yellow) and some single positive IDO1+ or CD33+ cells. The second panel row shows an MF tissue section with cells either positive for IDO1+ or CD33+ as well as a few double positive IDO1+/CD33+ cells at lower right. The third panel row from top shows a SPTCL with double positive IDO1+/CD33+ cells as well as single positive cells (40x). In addition, IDO1 is expressed by both (B) CD30-positive and (C) CD30-negative cells in LyP (40x magnification). (Scale bar 20 µm).
Increased enzymatic activity of IDO1 associates with advanced MF stage
The concentration ratio of KYN to Trp has been used widely as an indicator of IDO1 enzymatic activity. Here, we evaluated its correlation to MF disease stage. First, we investigated the necessity of overnight fasting and collected two partly overlapping sets of patient sera, fasting and non-fasting. We did not detect any significant effect of fasting on the KYN/Trp ratio (data not shown) and, hence, all sera were included in the final analysis. Overall, compared with healthy sera, the concentration of Trp was decreased in both, LyP and MF (, S2A and B). However, only in MF the serum KYN/Trp ratio was increased significantly (p = 0.012, (), while it did not differ in LyP (). Elevated KYN/Trp ratios were found more often in advanced than early stages of MF (). Correspondingly, a moderate elevation of KYN was also found in MyLa2000 compared with Mac1 and −2A cells ().
Table 1. Serum KYN/Trp ratios in relation to MF disease stage.
Figure 6. The activation of the KYN pathway in CTCL. (A) Significant difference in KYN/Trp ratio between healthy controls and MF sera (*p = 0.012), but no statistically significant difference between controls and LyP or between LyP and MF sera (Kruskal–Wallis test). (B) KYN concentrations in supernatants of CD30+ cell lines Mac1 (1.351 µM), Mac2A (1.282 µM), and the MF-derived cell line MyLa2000 (1.650 µM) after 24 h culturing (5000 cells/96-well in 200 µL). (C) A diagram illustrating the significant changes in the concentrations of KYN pathway metabolites in MF compared with healthy sera. Red box indicates that the value is significantly decreased; green is significantly increased and orange means no change (Kruskal–Wallis test).
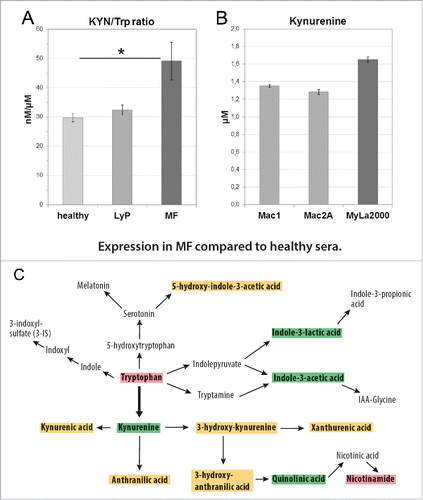
We also measured the concentrations of 10 other KYN pathway metabolites ( and S2). In a comparison of MF to healthy sera, we found KYN and quinolinic acid (QA) to be significantly increased in addition to indole-3-lactic and indole-3 acetic acids (). In LyP, the levels of the metabolites were generally lower or showed no significant difference compared with healthy sera (Fig. S2A and B). The difference between LyP and MF was obvious as 8 of 12 KYN pathway metabolites were significantly increased in MF compared with LyP (Fig. S2C). Interestingly, the end product of the KYN pathway, nicotinamide (NAm), was significantly decreased in both entities ( and S2B).
In vitro inhibition of IDO1 in MF-derived cell line
Although IDO1 inhibitors, currently in clinical trials, are not intended to kill tumor cells directly, we studied the effect of the IDO1 inhibitor epacadostat (INCB024360) on the IDO1-expressing MF-derived MyLa2000 cell line. HeLa cells were used as control cell line. IDO1 inhibition decreased the concentration of KYN in the cell supernatant of MyLa2000 and HeLa cells by 29% and 53%, respectively, but had no direct effect on cell viability, as expected (Fig. S3B and C).
Discussion
Overcoming immune tolerance in tumors has become a major objective of cancer research and treatment. IDO1 and its metabolite KYN have been recognized as major mediators of immunosuppressionCitation1 and, thus, potential therapeutic targets. Our study focused primarily on the identification of IDO1-expressing cells in different CTCL subtypes. We report, for the first time, that several cell types other than malignant cells contribute to the expression of IDO1 in CTCL. Among hematologic malignancies, IDO1 expression has been previously found in the acute myeloid leukemia (AML) blastsCitation26 and in MDSCs in chronic lymphocytic leukemia (CLL) of B-cell origin.Citation10 We found the spectrum of IDO1-expressing cells to differ markedly among CTCL subtypes. In LyP, IDO1 was prominent and expressed by both CD33+ MDSCs and CD30+ large atypical cells. While non-malignant cells in the TME, including CD33+ MDSCs, accounted for most of the IDO1 expression observed in clinical samples of MF, about 10% of morphologically malignant MF cells also expressed IDO1. Moreover, we found clusters of malignant MF cells to be surrounded by IDO1-expressing APCs or macrophages, which support the hypothesis of a tumor-promoting microenvironment. In SPTCL, IDO1 expression was observed in malignant cells as well as in CD33+ MDSCs and CD163+ TAMs. Recently, in lymphoma and leukemia, CD163+ TAMs were shown to be tumor promoting and associated with disease progression.Citation20
It was somewhat unexpected, that both Mac1 and Mac2A, clonally derived from LyP, showed only slight IDO1 mRNA expression compared with clinical LyP specimens. This would suggest that in vivo MDSCs cells account for most IDO1 expression in LyP. Our findings on these cell lines agree with gene expression profiling dataCitation27 (see Table S3 of Citationref. 26 for more details), where IDO1 was not ranked among the top 400 differentially expressed genes. Instead, Mac cells showed upregulation of TDO, whose overexpression could be confirmed at mRNA and protein levels in clinical LyP and ALCL specimens and in the CTCL cell lines (). Compared to IDO1, TDO has a lower affinity to L-tryptophan. Thus, it is less capable of depleting tryptophan and causing in vitro T-cell inhibition or activation of a stress response in Treg cells,Citation28 which are abundant in LyP tissue.Citation29 This led to the hypothesis that anti-inflammatory and tumor-protective effects of TDO are mediated by the production of Trp catabolites rather than by tryptophan depletion. Interestingly, our data showed that TDO expression exceeded that of IDO1 in LyP and ALCL. These results warrant further study on the role of TDO in these CTCL subtypes.
In hematologic and lymphoid malignancies, high IDO1 expression was shown to associate with inferior survival and adverse clinical outcome.Citation6,26 Because our observation on local KYN abundance correlated with IDO1 expression, we randomly selected a cohort of LyP and MF patients under follow-up or treatment, measured the serum concentrations of Trp and various KYN pathway metabolites and used the KYN/Trp ratio as an indicator of IDO1 enzymatic activity. KYN/Trp ratio was significantly increased in sera of MF patients compared with healthy controls and associated with advanced disease. Hence, the serum KYN/Trp ratio may serve as a potential prognostic biomarker for progressive MF but this will require validation in a large-scale prospective study. Despite the relatively strong local immunosuppression suspected from IDO1 expression and KYN in LyP, we did not find any significant difference in the corresponding patients' serum KYN/Trp ratios compared with healthy controls (). While these results support the indolent nature of LyP, it will be interesting to determine in a prospective study whether LyP patients with elevated KYN/Trp ratios suffer more frequently from second lymphomas.
KYN and other Trp metabolites inhibit T-cell responses mainly by their binding to the aryl hydrocarbon receptor (AhR).Citation30 The nuclear expression observed here may, therefore, also indicate activated AhR receptor signalingCitation31 also found in Mac cell lines (MEK, article in preparation). Lastly, we wanted to see whether we could downregulate IDO1 activity in MF-derived cell line MyLa2000 using KYN concentration and cell viability as parameters. It is understood that IDO1 inhibitors are not expected to kill tumor cells directly but we were able to demonstrate a clear decrease in the KYN concentration in these malignant cells with epacadostat (Fig. S3B), currently under investigation in several clinical trials (reviewed in Citationref 1). Moreover, IDO1-induced Treg activity, also observed here (Fig. S1), is strictly dependent on the PD-1/PD-L1 ligand pathway to create suppression.Citation1 Thus, this would indicate that a combination trial with an IDO1 inhibitor and anti-PD-1 or PD-1L might be feasible for MF.
In summary, we show that both IDO1 and TDO are expressed in CTCL tissues and cell lines. CTCL subtypes show unique patterns of IDO1 and TDO expressions by malignant cells and cells in the TME. Serum KYN/Trp ratios are elevated in MF patients and correlate significantly with advanced disease, thus being a potential test for clinical use. We conclude that our data shows evidence of IDO1-induced immunosuppression in CTCL and suggests that blocking IDO1 activity might improve therapeutic responses in CTCL in combination with other therapies.
Materials and methods
Patients and specimens
With the approval of the Medical Ethical Review Board of the Helsinki and Uusimaa Hospital District, Finland and in accordance with the Helsinki Declaration of 1975, a total of 100 patients were enrolled, including 90 CTCLs (37 MF, 36 LyP, 4 ALCL, and 13 SPTCL), and 10 inflammatory LRP. All LyP specimens were subtype A. Diagnoses were confirmed at the Dermatopathology Unit of the Department of Dermatology and Allergology, Helsinki University Central Hospital (HUCH). The numbers of patients and specimens included in the investigations performed varied and are given in the respective sections.
For the analysis of tryptophan metabolites, serum specimens were collected from 40 CTCL patients (14 LyP, 26 MF) followed at HUCH and 21 healthy volunteers. Sera were collected either after overnight fasting (14 LyP, 12 MF, and 11 healthy) or from non-fasting individuals (22 MF, 10 healthy). Eight MF patients donated both types of sera. The demographic features and follow-up data of these patients are shown in Table S1. The mean age of LyP and MF patients was 54.9 and 70.5 years, respectively. The corresponding mean follow-up times, calculated from the time of first histopathologically confirmed diagnosis until the time of serum collection, were 102 and 89 mo, respectively. Three MF patients died during follow-up, two of MF and a third of secondary diffuse large B-cell lymphoma.
Relative gene expression
RNA was extracted from archival FFPE skin specimens available from the patients enrolled, including 10 specimens from MF (nine patients), eight from LyP, and five from pcALCL (follow-up specimens of two patients) and LRP, using NucleoSpin FFPE RNA XS kit (cat#740969.10 Macherey-Nagel GmbH & Co.KG) or from cell cultures with the RNeasy Mini Kit (cat#74104, Qiagen) according to manufacturers' instructions. No microdissection was used. From each sample, 200 ng of RNA were subjected to reverse transcription using the SuperScript® VILO cDNA synthesis kit (cat#11754–050, Invitrogen).
The expression of IDO1 and TDO was measured by quantitative PCR on a LightCycler 1.5 System (Roche Applied Science, Germany) using 11.25 ng of cDNA per reaction, iQ Supermix (cat#170–8860, Bio-Rad Laboratories, Inc.), and the following TaqMan assays (IDO1; Hs00984148_m1, 66 bp, TDO; Hs00194611_m1, cat#4448892, Life Technologies). The relative expression levels were calculated by means of the 2−ΔΔCt-method using the housekeeping gene GAPDH as the reference (TaqMan assay cat#4310884E, 118bp, Life Technologies). Samples were analyzed in triplicate, a calibrator sample and negative controls were used. The LRP sample with the largest ΔCt-value served as tissue reference.
Immunohistochemistry
IHC detection of the proteins IDO1 (cat#MAB5412, 1:100, Chemicon International Inc.) and FoxP3 (cat#M3972, 1:50, Spring Bioscience Corp.) was performed on 72 FFPE tissue specimens: 9 LRP, 32 LyP (from 27 patients), 7 pcALCL (from 3 patients), 15 MF, and 9 SPTCL. IHC for TDO (TDO2 ab, cat#LS-B5791, 1:200, Life Span Biosciences) was performed on 9 LRP, 30 LyP, 14 MF, 7 ALCL, and 13 SPTCL samples. ImmPRESS Universal Antibody (anti-mouse Ig/anti-rabbit Ig, peroxidase) Polymer Detection Kit (cat#MP-7500, Vector Laboratories) and NovaRED (cat#SK-4805, Vector Laboratories), DAB Peroxidase Substrate Kit (cat#SK-4100, Vector Laboratories), or AEC (cat#ab64252, Abcam) were used as chromogens. IHC for L-KYN was performed on 7 LyP, 12 MF, and 4 SPTL specimens with a monoclonal antibody (1:100, clone 3D4-F2, mAb, cat#IS003, ImmuSmol) after antigen retrieval in 10 mM Tris–HCl, pH 8.5, 1 mM EDTA, 0.05% Tween20, and using the above ImmPRESS kit and NovaRED chromogen. Colon carcinoma specimens were used as positive tissue controls. The IHC staining was graded as follows: indicates <10%, +10–25%, ++26–50%, and +++ over 50% of mononuclear cells expressing a given marker (). For IHC double staining, used to identify IDO1-expressing cells, a total of 12 FFPE tissue specimens (3 each from MF, LyP, SPTL, and LRP) were selected based on their IDO1 expression status to cover both strongly positive and negative cases. Double IHC for CD163 (cat#NCL−L-CD163, mouse, 1:100, Novocastra) and IDO1 (cat#04–1056, rabbit, 1:2000, Merck Millipore) was performed using Vectastain ABC-AP Kit (cat#AK-5002, mouse, Vector Laboratories)/Permanent AP-Red Kit (cat#BCB-20041, Nordic BioSite) and Vectastain Elite ABC HRP Kit (cat#PK-6101, rabbit, Vector Laboratories)/Permanent HRP Green Kit (cat#KDB-10049, Nordic BioSite), respectively.
Double IHC staining for CD30 (cat#ab132080, 1:1000, rabbit, Abcam) and IDO1 (cat#MAB5412, 1:50, mouse IgG3, Chemicon International) was performed using Vectastain Elite ABC HRP Kit /Permanent HRP Green Kit and Vectastain ABC-AP Kit /Permanent AP-Red Kit, respectively. Primary antibodies were replaced with 1% BSA/PBS in negative controls. Microscopes from Leica Biosystems were used.
Double immunofluorescence
Double immunofluorescence (IF) for CD33 (cat#133M-17, mouse IgG2b, 1:200, Cell Marque) and IDO1 (cat# mouse IgG3, 1:200, clone MAB5412, Chemicon International) were performed on the same sample set as analyzed by double IHC (see above). AlexaFluor-594 anti-mouse IgG2b antibody (cat#A-21145, 1:1000, Thermo Scientific) and AlexaFluor-488 anti-mouse IgG3 antibody (cat#115–545–209, 1:1000, Jackson ImmunoResearch Laboratories) were used as secondary antibodies and the slides were analyzed and photographed using an Axio Imager.Z2 upright epifluorescence microscope (Carl Zeiss AG, Oberkochen, Germany) and checked with a Zeiss Axio Imager.Z1 upright epifluorescence microscope equipped with a Zeiss ApoTome for structured illumination.
Cell lines
Cells were suspended in 10% DMSO–fetal bovine serum (FBS) and stored in liquid nitrogen using standard procedures. The MF-derived cell line MyLa2000Citation25 was grown in DMEM Glutamax (cat# 10566–016, Gibco/Invitrogen), supplemented with 10% FBS (cat# SH30071.01, HyClone, GE Healthcare Bio-Sciences,) and penicillin–streptomycin (100 U/mL) for a maximum of 20 passages. The Mac1 cell line had been established from peripheral blood cerebriform lymphocytes of a 31-year-old male patient with indolent LyP, while Mac2A was established from a skin tumor of the same patient after progression to ALCL. Albeit clonally related, Mac1 and Mac2A are genomically and transcriptionally distinct.Citation27 Mac1, Mac2A, and HeLa cell lines were grown in RPMI 1640 (cat# 31870–082, Gibco/Invitrogen), supplemented with 2 mM glutamine, 10% FBS, and penicillin–streptomycin (100 U/mL). The cell lines have been authenticated at the DSMZ (Braunschweig, Germany) using short tandem repeat DNA typing. For all subsequent experiments, fresh aliquots were thawed, and only cells cultured for less than 20 passages in 8% CO2 were used. Cell yield and viability were followed using (1:2) 0.4% Trypan Blue or the Dojindo Cell Counting Kit-8 (Dojindo Laboratories) according to the manufacturer's instructions.
Western blot
MyLa2000, Mac-1, and Mac-2A cell lines were washed twice with ice cold PBS. Cell pellets were resuspended in RIPA buffer (50 mM Tris–HCl pH 7.2, 150 mM NaCl, 2 mM EDTA, 1% NP-40, 0.1% SDS) with EDTA free protease inhibitor (cat#04693132001, Roche) and incubated on ice for 30 min. Cell lysates were centrifuged at 12.000xg at 4°C for 20 min. Protein concentration was determined using the Pierce BCA Protein Assay Kit (cat#23225 Thermo Scientific). 34 µg and 25 µg of protein were used for TDO and IDO western blot analysis, respectively. Samples were boiled at 70°C for 10 min with Laemmli Sample Buffer (cat#161–0747, Bio-Rad). Protein lysates were separated by 10% SDS-PAGE electrophoresis, transferred onto nitrocellulose membrane (cat#NBX 085C001EA, Millipore) 100 V for 90 min. Membranes were incubated with anti-TDO2 (cat#LS-B5791, 3:1000, Life Span Biosciences), anti-IDO1 (cat#MAB5412, 1:500, Millipore) antibodies overnight at 4°C, and with anti β-actin (cat#4970L, 1:1000, Cell Signaling) for 1 h at RT. After washing, the membranes were incubated with anti-rabbit HRP-conjugated secondary antibody (cat#PO448, Dako) or with anti-mouse HRP-conjugated secondary antibody (cat#AP308P, Millipore). Proteins were detected using the Clarity ECL reagent (cat#170–5061, BioRad). TDO2 and IDO1 expression values were normalized against β-actin using the ChemiDoc MP Imaging System and adjusted density values were calculated using the Image Lab software (Bio-Rad).
L-Kynurenine concentrations in CTCL-derived cell lines
The KYN concentrations of cell culture supernatants were measured by L-Kynurenine ELISA kit (cat#BA-E-2200, ImmuSmol) according to the manufacturer's instructions. The OD values were measured on a Multiscan FC spectrophotometer (Thermo Scientific) and results were analyzed using non-linear regression.
Determination of Trp metabolites in patient sera
Sera were stored at –80°C until analyzed by liquid chromatography–electrospray ionization–tandem mass spectrometry (LC–ESI–MS/MS) as described previouslyCitation32 to determine the concentrations (µM) of QA, 3-hydroxykynurenine (3-HK), NAm, kynurenine (KYN), tryptophan (Trp), xanthurenic acid (XA), kynurenic acid (KA), anthranilic acid (AA), 3-hydroxyanthranilic acid (3-HAA), 5-hydroxy-indole-3-acetic acid (HIAA), indole-3-lactic acid (ILA), and indole-3-acetic acid (IAA).
Statistical analysis
IMB SPSS Statistics 22 software was used to calculate the statistical significance between variables using either the Kruskal–Wallis test or the Mann–Whitney U test.
Disclosure of potential conflicts of interest
No potential conflicts of interest were disclosed.
KONI_A_1273310_s02.pdf
Download PDF (942.7 KB)Acknowledgments
We are indebted to Mrs. Alli Tallqvist, Kaija Järvinen, and Nadine Nürnberger for their skillful technical assistance, Dr. Pilar García Muret for providing the FFPE tissues of six Spanish LyP patients, and Prof. Dr. Robert Gniadecki for providing the MyLa2000 cells.
Funding
This study was supported by funding from Instrumentarium Science Foundation (PM), K. Albin Johansson foundation (PM), Emil Aaltonen-foundation (PM), HUCH Research Grants (AR), Finska Läkaresällskapet (AR, PM), and the German Research Society (KFO262, KD, PJO). MEK is supported by Drs. Martin and Dorothy Spatz Charitable Foundation.
References
- Munn DH, Mellor AL. IDO in the tumor microenvironment: inflammation, counter-regulation, and tolerance. Trends Immunol 2016; 37(3):193-07; PMID:26839260; http://dx.doi.org/10.1016/j.it.2016.01.002
- Zhai L, Spranger S, Binder DC, Gritsina G, Lauing KL, Giles FJ, Derek A. Molecular pathways: targeting IDO1 and other tryptophan dioxygenases for cancer immunotherapy. Clin Cancer Res 2015 21(24):5427-33; PMID:26519060; http://dx.doi.org/10.1158/1078-0432.CCR-15-0420
- van Baren N, Van den Eynde BJ. Tumoral immune resistance mediated by enzymes that degrade tryptophan. Cancer Immunol Res 2015; 3:978-85; PMID:26269528; http://dx.doi.org/10.1158/2326-6066.CIR-15-0095
- Godin-Ethier J, Hanafi LA, Piccirillo CA, Lapointe R. Indoleamine 2,3-dioxygenase expression in human cancers: clinical and immunologic perspectives. Clin Cancer Res 2011; 17(22):6985-91; PMID:22068654; http://dx.doi.org/10.1158/1078-0432.CCR-11-1331
- Théate I, van Baren N, Pilotte L, Moulin P, Larrieu P, Renauld JC, Hervé C, Gutierrez-Roelens I, Marbaix E, Sempoux C et al. Extensive profiling of the expression of the indoleamine 2,3-dioxygenase 1 protein in normal and tumoral human tissues. Cancer Immunol Res 2015; 3(2):161-72; PMID:25271151; http://dx.doi.org/10.1158/2326-6066.CIR-14-0137
- Choe JY, Yun JY, Jeon YK, Kim SH, Park G, Huh JR, Oh S, Kim JE. Indoleamine 2,3-dioxygenase (IDO) is frequently expressed in stromal cells of Hodgkin lymphoma and is associated with adverse clinical features: a retrospective cohort study. BMC Cancer 2014; 14:335; PMID:24886161; http://dx.doi.org/10.1186/1471-2407-14-335
- Liu XQ, Lu K, Feng LL, Ding M, Gao JM, Ge XL, Wang X. Up-regulated expression of indoleamine 2,3-dioxygenase 1 in non-Hodgkin lymphoma correlates with increased regulatory T-cell infiltration. Leuk Lymphoma 2014; 55(2):405-14; PMID:23682557; http://dx.doi.org/10.3109/10428194.2013.804917
- Masaki A, Ishida T, Maeda Y, Suzuki S, Ito A, Takino H, Ogura H, Totani H, Yoshida T, Kinoshita S et al. Prognostic significance of tryptophan catabolism in adult T-cell leukemia/lymphoma. Clin Cancer Res 2015; 21(12):2830-9; PMID:25788494; http://dx.doi.org/10.1158/1078-0432.CCR-14-2275
- Yeung AW, Terentis AC, King NJ, Thomas SR. Role of indoleamine 2,3-dioxygenase in health and disease. Clin Sci 2015; 129(7): 601-72; PMID:26186743; http://dx.doi.org/10.1042/CS20140392
- Jitschin R, Braun M, Büttner M, Dettmer-Wilde K, Bricks J, Berger J, Eckart MJ, Krause SW, Oefner PJ, Le Blanc K et al. CLL-cells induce IDOhi CD14+HLA-DRlo myeloid-derived suppressor cells that inhibit T-cell responses and promote TRegs. Blood 2014; 124(5):750-60; PMID:24850760; http://dx.doi.org/10.1182/blood-2013-12-546416
- Pilotte L, Larrieu P, Stroobant V, Colau D, Dolusic E, Frederick R, De Plaen E, Uyttenhove C, Wouters J, Masereel B et al. Reversal of tumoral immune resistance by inhibition of tryptophan 2,3-dioxygenase. Proc Natl Acad Sci USA 2012; 109:2497-502; PMID:22308364; http://dx.doi.org/10.1073/pnas.1113873109
- Ball HJ, Sanchez-Perez A, Weiser S, Austin CJ, Astelbauer F, Miu J, McQuillan JA, Stocker R, Jermiin LS, Hunt NH. Characterization of an indoleamine 2,3-dioxygenase-like protein found in humans and mice. Gene 2007; 396:203-13; PMID:17499941; http://dx.doi.org/10.1016/j.gene.2007.04.010
- Metz R, Duhadaway JB, Kamasani U, Laury-Kleintop L, Muller AJ, Prendergast GC. Novel tryptophan catabolic enzyme IDO2 is the preferred biochemical target of the antitumor indoleamine 2,3-dioxygenase inhibitory compound D-1-methyl-tryptophan. Cancer Res 2007; 67:7082-7; PMID:17671174; http://dx.doi.org/10.1158/0008-5472.CAN-07-1872
- Metz R, Smith C, DuHadaway JB, Chandler P, Baban B, Merlo LM, Pigott E, Keough MP, Rust S, Mellor AL et al. IDO2 is critical for IDO-mediated T-cell regulation and exerts a non-redundant function in inflammation. Int Immunol 2014; 26(7):357-67. PMID:24402311; http://dx.doi.org/10.1093/intimm/dxt073
- Ball HJ, Jusof FF, Bakmiwewa SM, Hunt NH, Yuasa HJ. Tryptophan-catabolizing enzymes – party of three. Front Immunol 2014 9; 5:485; PMID:25346733; http://dx.doi.org/10.3389/fimmu.2014.00485
- Maliniemi P, Hahtola S, Ovaska K, Jeskanen L, Väkevä L, Jäntti K, Stadler R, Michonneau D, Fraitag S, Hautaniemi S et al. Molecular characterization of subcutaneous panniculitis-like T-cell lymphoma reveals upregulation of immunosuppression- and autoimmunity-associated genes. Orphanet J Rare Dis 2014; 9:160; PMID:25928531; http://dx.doi.org/10.1186/s13023-014-0160-2
- Lee WS, Hwang JH, Kim MJ, Go SI, Lee A, Song HN, Lee MJ, Kang MH, Kim HG, Lee JH. Cyclosporine a as a primary treatment for panniculitis-like T cell lymphoma: a case with a long-term remission. Cancer Res Treat 2014; 46(3):312-6; PMID:25038767; http://dx.doi.org/10.4143/crt.2014.46.3.312
- Nagai K, Nakano N, Iwai T, Iwai A, Tauchi H, Ohshima K, Ishii E. Pediatric subcutaneous panniculitis-like T-cell lymphoma with favorable result by immunosuppressive therapy: a report of two cases. Pediatr Hematol Oncol 2014; 31(6):528-33; PMID:24684413; http://dx.doi.org/10.3109/08880018.2014.896062
- Vilgelm AE, Johnson DB, Richmond A. Combinatorial approach to cancer immunotherapy: strength in numbers. J Leukoc Biol 2016; 100(2):275-90; PMID:27256570; http://dx.doi.org/10.1189/jlb.5RI0116-013RR
- Komohara Y, Niino D, Ohnishi K, Ohshima K, Takeya M. Role of tumor-associated macrophages in hematological malignancies. Pathol Int 2015; 65(4):170-6; PMID:25707506; http://dx.doi.org/10.1111/pin.12259
- de Souza A, el-Azhary RA, Camilleri MJ, Wada DA, Appert DL, Gibson LE. In search of prognostic indicators for lymphomatoid papulosis: a retrospective study of 123 patients. J Am Acad Dermatol 2012; 66(6):928-37; PMID:21982062; http://dx.doi.org/10.1016/j.jaad.2011.07.012
- de la Garza Bravo MM, Patel KP, Loghavi S, Curry JL, Torres Cabala CA, Cason RC, Gangar P, Prieto VG, Medeiros LJ, Duvic M et al. Shared clonality in distinctive lesions of lymphomatoid papulosis and mycosis fungoides occurring in the same patients suggests a common origin. Hum Pathol 2015; 46(4):558-69; PMID:25666664; http://dx.doi.org/10.1016/j.humpath.2014.12.008
- Kunishige JH, McDonald H, Alvarez G, Johnson M, Prieto V, Duvic M. Lymphomatoid papulosis and associated lymphomas: a retrospective case series of 84 patients. Clin Exp Dermatol 2009; 34:576-81; PMID:19196298; http://dx.doi.org/10.1111/j.1365-2230.2008.03024.x
- Davis TH, Morton CC, Miller-Cassman R, Balk SP, Kadin ME. Hodgkin's disease, lymphomatoid papulosis, and cutaneous T-cell lymphoma derived from a common T-cell clone. N Engl J Med 1992; 326(17):1115-22; PMID:1532439; http://dx.doi.org/10.1056/NEJM199204233261704
- Drexler HG. The Leukemia-Lymphoma Cell Lines Factsbook San Diego: Academic Press. 2000.
- Fukuno K, Hara T, Tsurumi H, Shibata Y, Mabuchi R, Nakamura N, Kitagawa J, Shimizu M, Ito H, Saito K et al. Expression of indoleamine 2,3-dioxygenase in leukemic cells indicates an unfavorable prognosis in acute myeloid leukemia patients with intermediate-risk cytogenetics. Leuk Lymphoma 2015; 56(5):1398-405; PMID:25248875; http://dx.doi.org/10.3109/10428194.2014.953150
- Ehrentraut S, Nagel S, Scherr ME, Schneider B, Quentmeier H, Geffers R, Kaufmann M, Meyer C, Prochorec-Sobieszek M, Ketterling RP et al. t(8;9)(p22;p24)/PCM1-JAK2 activates SOCS2 and SOCS3 via STAT5. PLoS One 2013; 8(1):e53767 PMID:23372669; http://dx.doi.org/10.1371/journal.pone.0053767
- Munn DH, Shafizadeh E, Attwood JT, Bondarev I, Pashine A, Mellor AL. Inhibition of T-cell proliferation by macrophage tryptophan catabolism. J Exp Med 1999; 189:1363-72; PMID:10224276
- Gjerdrum LM, Woetmann A, Odum N, Hother C, Henrik-Nielsen R, Gniadecki R et al. FOXP3 positive regulatory T-cells in cutaneous and systemic CD30 positive T-cell lymphoproliferations.Eur J Haematol 2008; 80(6):483-9. PMID:18331599; http://dx.doi.org/10.1111/j.1600-0609.2008.01064.x
- Platten M, von Knebel Doeberitz N, Oezen I, Wick W, Ochs K. Cancer immunotherapy by targeting IDO/TDO and their downstream effectors. Front Immunol 2015; 5:673; PMID:25628622; http://dx.doi.org/10.3389/fimmu.2014.00673
- Alam MS, Maekawa Y, Kitamura A, Tanigaki K, Yoshimoto T, Kishihara K, Yasutomo K. Notch signaling drives IL-22 secretion in CD4+ T cells by stimulating the aryl hydrocarbon receptor. Proc Natl Acad Sci USA 2010; 107(13):5943-8; PMID:20231432; http://dx.doi.org/10.1073/pnas.0911755107
- Zhu W, Stevens AP, Dettmer K, Gottfried E, Hoves S, Kreutz M, Holler E, Canelas AB, Kema I, Oefner PJ. Quantitative profiling of tryptophan metabolites in serum, urine, and cell culture supernatants by liquid chromatography-tandem mass spectrometry. Anal Bioanal Chem 2011; 401(10):3249-61; PMID:21983980; http://dx.doi.org/10.1007/s00216-011-5436-y