
ABSTRACT
Triple-negative breast cancer (TNBC) is a heterogeneous subtype with varying disease outcomes. Tumor-infiltrating lymphocytes (TILs) are frequent in TNBC and have been shown to correlate with outcome, suggesting an immunogenic component in this subtype. However, other factors intrinsic to the cancer cells may also influence outcome. To identify proteins and molecular pathways associated with recurrence in TNBC, 34 formalin-fixed paraffin-embedded (FFPE) primary TNBC tumors were investigated by global proteomic profiling using mass spectrometry. Approximately, half of the patients were lymph node-negative and remained free of local or distant metastasis within 10 y follow-up, while the other half developed distant metastasis. Proteomic profiling identified >4,000 proteins, of which 63 exhibited altered expression in primary tumors of recurrence versus recurrence-free patients. Importantly, downregulation of proteins in the major histocompatibility complex (MHC) class I antigen presentation pathways were enriched, including TAP1, TAP2, CALR, HLA-A, ERAP1 and TAPBP, and were associated with significantly shorter recurrence-free and overall survival. In addition, proteins involved in cancer cell proliferation and growth, including GBP1, RAD23B, WARS and STAT1, also exhibited altered expression in primary tumors of recurrence versus recurrence-free patients. The association between the antigen-presentation pathway and outcome were validated in a second sample set of 10 primary TNBC tumors and corresponding metastases using proteomics and in a large public gene expression database of 249 TNBC and 580 basal-like breast cancer cases. Our study demonstrates that downregulation of antigen presentation is a key mechanism for TNBC cells to avoid immune surveillance, allowing continued growth and spread.
Introduction
Triple-negative breast cancer (TNBC), defined by lack of estrogen receptor (ER) and progesterone receptor (PR) expression as well as no HER2 amplification, is an aggressive subtype frequently affecting younger women.Citation1-3 TNBC displays higher early recurrence rates than other breast cancer subtypes, resulting in decreased disease-free survival (DFS), with approximately 30% of patients experiencing recurrence within 5 y of diagnosis.Citation4-6 Gene expression profiling studies of breast cancer tumors revealed that basal-like breast cancers significantly overlapped with the immunohistochemistry (IHC)-defined TNBC subtype.Citation7-9 Basal-like breast cancers are classified as having high proliferation, grade, epidermal growth factor receptor (EGFR) expression, hormone receptor cluster under-expression and expression of cytokeratin 5, 14 and 17,Citation7, 10-13 but as gene expression profiling is not yet standard clinical practice, the TNBC subtype is used as a clinical surrogate.Citation9, 14
Increasing amounts of tumor-infiltrating lymphocytes (TILs), especially CD8+ cells, in different types of cancer, including ovarian, colorectal and non-small cell lung cancer, has been shown to be associated with a better prognosis.Citation15-16 In breast cancer, the prognostic value of CD8+ and total lymphocyte count TILs seems to depend on the breast cancer subtype. A recent study of breast cancer patients demonstrated that CD8+ cells were significantly associated with longer survival and disease-free intervals in patients with ER−, but not ER+ tumors.Citation17 Another study showed that total lymphocyte count was an independent prognostic marker and survival was improved in women with ER− tumors when intraepithelial, stromal and total lymphocyte counts were high.Citation18 Further, another study found that the favorable prognostic effect of CD8+ TILs was significant only in the TNBCs that expressed markers associated with the basal-like subtype, and not in TNBCs that lacked expression of those markers or in the other intrinsic subtypes.Citation19 Both stromalCitation20 and intra-tumoralCitation21 TILs have been reported as positive prognostic markers in TNBC patients.Citation22 Together, these studies strongly indicate an immune involvement in the prognosis of patients with TNBC.
Liquid Chromatography-tandem mass spectrometry (LC-MS/MS) is a widely used technique in proteomic investigations allowing global analyses of samples of multiple biologic types and disease states, including cancer.Citation23-24 MS offers the ability to directly investigate altered signaling pathways and biologic anomalies found in the tumors. Generally, the utility of MS in the analysis of clinical tissue samples has been limited by the requirement for fresh or frozen samples, whereas the largest clinical resource of such tissues is in the form of archival tissues stored as formalin-fixed, paraffin-embedded (FFPE) blocks in biobanks.Citation25-26 More recently, several proteomic studies using both reverse-phase protein arrays (RPPA)Citation27-29 and MSCitation25,30-35 have unequivocally shown the feasibility of using these FFPE samples for global and targeted proteomics. High concordance in identifiable proteins from fresh-frozen and FFPE samples in multiple studies underscores the minimal impact of formalin-fixation on MS-based analysis.Citation25,36-39
In this study, we sought to identify proteins within cancer cells of primary tumors that were significantly associated with recurrence of TNBC. Laser microdissected tumor cells of archival FFPE primary tumors from a cohort of well-characterized TNBC patients that did or did not experience recurrence in a 10-y follow-up were analyzed by quantitative MS-based proteomics. The analysis identified several differentially altered proteins associated with the MHC class I antigen-presentation machinery, a finding that was recapitulated in an independent, second cohort of primary tumors and corresponding metastases. The identification of tumors that not only lack TILs, but also exhibit downregulation of MHC class I antigen-presentation machinery proteins, may have important clinical implications when identifying patients not suited for immunotherapy, such as checkpoint inhibitors.
Results
Patient characteristics
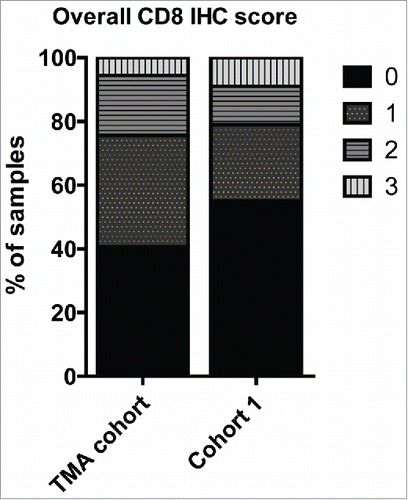
To identify proteins and molecular pathways in cancer cells of primary tumors associated with recurrence in TNBC patients, we used laser microdissection (LCM) to collect highly enriched cancer cell preparations from archival FFPE primary tumors of TNBC patients who subsequently did or did not experience recurrence. Prior to laser microdissection, cancer cell-rich areas (>80%) were identified on an adjacent hematoxylin and eosin stained tissue section in collaboration with a skilled pathologist. Two to nine slides were used, with 5,000,000 µm2 deemed the minimum required sample. Microscale amounts of protein (5–10 µg each) extracted from the cancer cell enriched samples were differentially labeled with isobaric reagents (Tandem Mass Tags (TMT)), pooled, fractionated by hydrophilic interaction chromatography (HILIC), and analyzed on a high-resolution hybrid quadrupole-Orbitrap mass spectrometer (Q-Exactive). Thirty-four patients of a cohort of 233 were selected for inclusion in the discovery cohort based on rigorous selection criteria to ensure maximum homogeneity of patient groups, (). Approximately, half of these patients were lymph node-negative (N−) and remained free of local or distant metastasis for 10 y follow-up (n = 19), while the other half developed distant metastasis (n = 15) within the same period. The median time to recurrence was 1,036 d (range: 402–1,861) from time of diagnosis, and 14 of the 15 patients that recurred died within the 10-y follow-up. Clinical data for the patients were updated in January 2014. The amount of TILs was determined by microscopic analysis of hematoxylin-eosin stained tumor sections, and the amount of CD8+ TILs was determined by IHC. Primarily tumors with no or minimal TILs, including CD8+ cells, were selected for MS analysis to focus the study on intrinsic factors within the cancer cells that influenced outcome (). A second cohort consisting of 20 paired primary TNBC samples and corresponding distant metastasis were also analyzed by TMT-HILIC-LC-MS/MS (). The median time to recurrence in the second cohort was 1,223 d (range = 552–3,017), and all patients died within the follow-up period. All included TNBC tumors were verified by IHC, and were grade 2 or higher. All patients received post-surgical chemotherapy (anthracycline- or antifolate-based) and none received neo-adjuvant chemotherapy.
Table 1. Clinicopathological characteristics at time of surgery for patients in the proteomic study.
Figure 1. Bar diagram showing the percentage of TNBC tissue samples exhibiting high amount (IHC-score 3), intermediate (IHC-score 2), low (IHC-score 1), no (IHC-score 0) CD8+ TILs in the entire TNBC cohort (TMA cohort) and the discovery mass spectrometry TNBC cohort (Cohort 1).
Hierarchical clustering analysis reveals protein clusters associated with recurrence in TNBC
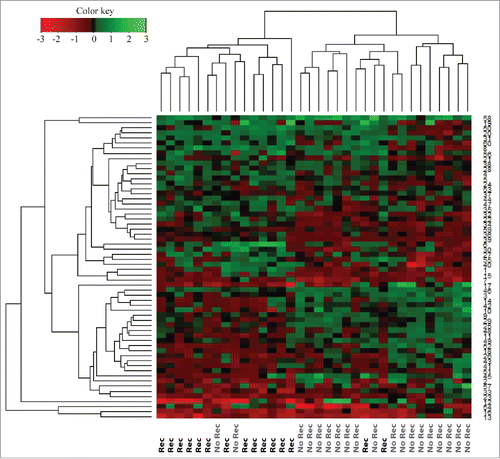
The quantitative MS-based proteomic analysis of the 34 TNBC FFPE identified a total of 4,163 proteins, of which 2,564 proteins were identified by at least two unique peptides (Table S1). Of these, 1,088 proteins had quantifiable expression in all samples (Table S2), and 63 were found to be significantly altered (p ≤ 0.05) between the recurrence and recurrence-free patient groups (Table S3). Using the expression values for these 63 proteins, we built an unsupervised hierarchical cluster and all but four patients stratified correctly according to their clinical outcome ().
Figure 2. Hierarchical cluster of proteins differentially expressed (p < 0.05) between recurrence and recurrence-free patients with an FDR < 1% identified by Student's t-test. Red = high expression in recurrence-free vs. recurrence patients; Green = low expression in recurrence-free vs. recurrence patients.
Network analysis
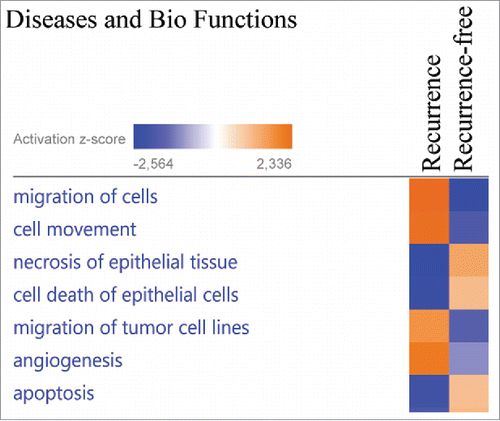
To elucidate the biologic pathways and disease functions associated with the significantly altered proteins, the 63 altered proteins were analyzed using Ingenuity Pathway Analysis (IPA, Qiagen), which stratifies significantly regulated proteins to different Diseases and Biofunctions. “Migration of cells,” “cell movement” and “angiogenesis” were identified as activated in the primary tumors in recurrent patients, whereas “apoptosis,” “necrosis of epithelial tissue” and “cell death of epithelial cells” were identified as activated in the primary tumors of patients that did not recur (). The underlying protein expression data for the different Diseases and Biofunctions exhibited high prediction confidence, with most proteins exhibiting the expected altered abundance (up/down) for the predicted disease functions (Fig. S1).
Figure 3. The proteins exhibiting significantly altered average protein expression (p ≤ 0.05) in the recurrence and recurrence-free group was examined by comparative analysis using IPA (Ingenuity Pathway Analysis). Diseases and Bio Functions revealed activation z-scores for patients with recurrence in “migration of cells,” “invasion of cells” and “proliferation of cells” compared with recurrence-free patients. Recurrence-free patients exhibited higher activation of “apoptosis” and “cell death” compared with patients with recurrence.
The top IPA network of differentially regulated proteins between the recurrence and recurrence-free TNBC groups was found to be associated with cell cycle, growth, proliferation, cell death and survival (), and the key nodes in the network were the NFκB complex, P38 MAPK and ERK1/2. Signal transducer and activator of transcription 1-α/β (STAT1) and antigen peptide transporter 1 (TAP1) were found to be significantly less abundant in recurrence versus recurrence-free patients (−1.2 and −1.3-fold, respectively), directly linking to the NFκB complex and ERK1/2 with STAT1 also interacting with P38 MAPK. We found that ezrin (EZR), which has been implicated in breast cancer metastasis and cancer progressionCitation40-42 and shows a direct interaction with Erk1/2 in Network 1, was elevated in recurrence versus recurrence-free patients (1.2-fold).
Figure 4. Network analysis obtained from Ingenuity Pathway Analysis (IPA) of aberrantly (p ≤ 0.05) regulated proteins between recurrence (R) and recurrence-free (RF) patients. Official gene symbols and relative expression values for each protein are depicted. For detailed information on aberrantly regulated proteins see Table S3.
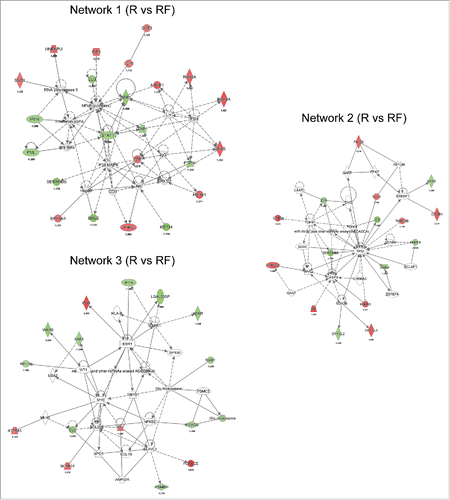
Network 2 was also associated with cellular growth, proliferation, cell death and survival. The key nodes of the network were the tumor suppressor protein 53 (TP53) and caspase 3 (CASP3). The UV excision repair protein RAD23 homolog B (RAD23B), a member of the nucleotide excision repair system, was elevated in recurrence versus recurrence-free (1.14-fold) patients (). In the same network, we observed SERPINB5, a member of the serine protease inhibitor family known to be differentially expressed in cancers, with nucleus localization representing a favorable prognosis in breast cancer,Citation43 to be diminished in recurrence versus recurrence-free patients (1.7-fold. ). The heat shock protein HSPB1, a known factor involved in preventing apoptosisCitation44 and tumor progression,Citation45 was found to interact with both major key nodes in Network 2 and elevated recurrence versus recurrence-free patients (1.4-fold)().
Network 3 was found to be associated with biologic functions such as survival, cell cycle progression and cancer. Numerous nodes were present in the network, with estrogen receptor (ESR1), myc proto-oncogene protein (MYC) and mitogen-activated protein kinase 1 (MAPK1) being three of the major nodes ().
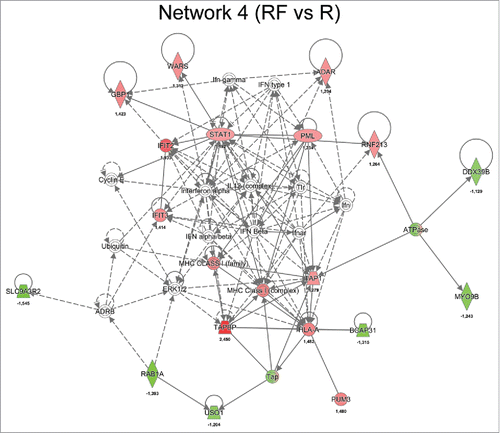
When examining the significantly regulated proteins between recurrence and recurrence-free patients and allowing for missing values, a network associated with antigen presentation, protein synthesis and antimicrobial response was identified (). The key nodes in the network were STAT1, MHC class I (complex) and interferon gamma-associated protein (IFNγ). The network of antigen presentation-associated proteins were diminished in recurrence versus recurrence-free TNBC patients, as was STAT1, which is known to interact with TAP1.Citation46
Figure 5. Network analysis obtained from IPA of differentially regulated proteins (p ≤ 0.05) between recurrence (R) and recurrence-free (RF) patients. Official gene symbols and relative expression values (recurrence-free vs. recurrence) for each protein are depicted.
Correlation between expression levels in primary tumors and patient outcome
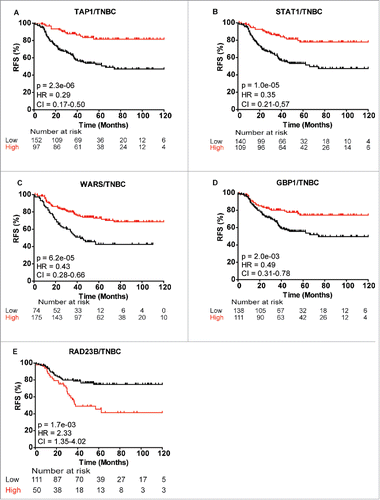
To evaluate the clinical relevance of some of the 63 differentially abundant proteins central to our network analysis, we evaluated their prognostic significance in cohorts of 249 TNBC and 580 basal-like breast cancer patients using the publicly available gene expression survival tool KMplotter (www.kmplot.com). Evaluating recurrence-free survival (RFS) and overall survival (OS), five candidates exhibited significant expression differences using the stringent cutoff of p <0.005, including guanylate binding protein 1 (GBP1), RAD23B, TAP1, STAT1 and tryptophan-tRNA ligase (WARS). Low levels of TAP1 and STAT1 exhibited the most significant association with recurrence in TNBC patients (pTAP1 = 2.3E−06, pSTAT1 = 1E−05; and ). Likewise, low expression of WARS and GBP1 was associated with a poor RFS (pWARS = 6.2E−05, pGBP1 = 2.0E−03; ). Conversely, high expression of RAD23B correlated with a poor outcome in TNBC patients (pRAD23B = 1.7E−03; ). We observed similar correlation between gene expression of TAP1, STAT1, WARS and GBP1 with RFS and OS in the basal-like breast cancer patient cohort, while only correlation with RFS, and not OS, were significant for RAD23B in the basal-like breast cancer patient group (Fig. S2). All five proteins displayed similar expression characteristics between gene expression in KMplotter and protein levels by MS, i.e., high gene expression levels in KMplotter = high protein expression levels in MS, with high TAP1, STAT1, GBP1 and WARS expression correlating with a significantly better RFS in the discovery MS data set (Fig. S3). Conversely, high RAD23B expression levels correlated with a significantly worse RFS in the discovery cohort (Fig. S3).
Figure 6. Kaplan-Meier survival curves showing strong association between expression of selected gene and recurrence-free survival (RFS) of TNBC patients. (A) TAP1, (B) STAT1, (C) WARS, (D) GBP1 and (E) RAD23B. Plots were generated using KMplotterCitation68 with optimal cutoff values and 10-y follow-up period.
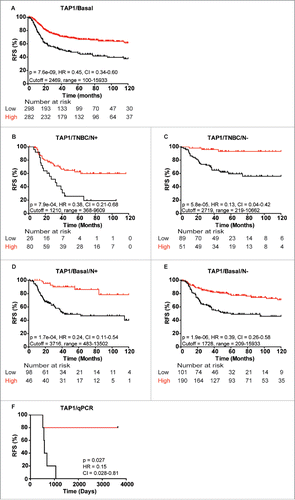
Detailing the prognostic value of TAP1 in TNBC and basal-like breast cancer patients
As indicated, high TAP1 levels in the TNBC and basal-like breast cancer cohort correlated with a significantly better RFS (Basal-like: p = 7.6E−09, ). This correlation was independent of lymph node status, with both lymph node-positive (N+) and lymph node-negative (N−) TNBC patients showing highly favorable outcome with high TAP1 expression (pN+ = 7.9E04, pN− = 5.8E−05, and ). Similarly, both N+ and N− basal-like breast cancer patients showed significantly better RFS with high TAP1 expression (pN+ = 0.00017, vs. pN− = 1.9E−06, and ). To ensure that the prognostic value of TAP1 as measured at the mRNA level likely would be similar if measured at the protein level, 10 of the patient samples used for our MS discovery analysis (6 recurrence and 4 recurrence-free patients) were analyzed by RT-PCR using a non-optimized median cutoff value. In agreement with the TAP1 proteome data, we found a significant correlation between high TAP1 gene expression and longer RFS in the 10 TNBC samples (p = 0.027, ).
Figure 7. Kaplan-Meier curves showing association between TAP1 gene expression and recurrence-free survival (RFS) of different patient subgroups. Strong association between TAP1 expression and RFS in (A) basal-like breast cancer patients, TNBC patients with (B) lymph node-positive (N+) and (C) lymph node-negative (N−) status, respectively, and basal-like breast cancer patients with (D) N+ and (E) N− status, respectively. (F) Gene expression analysis of 10 patients from the MS data set revealed a good correlation between mRNA and protein expression of TAP1. Kaplan-Meier curves were generated with KMplotter using optimized cutoff values (A–E) and censuring at 10 y or median cutoff value (F).
Downregulation of antigen-processing pathway proteins in the primary tumors of poor outcome patients and in metastatic lesions
Since TAP1 is an important protein in antigen presentation, we explored whether the expression of other key proteins involved in TAP1-associated antigen-presentation via the classical MHC class I pathway, including class I histocompatibility antigens (α chain) (HLA-A), CALR, TAPBP, ERAP1 and TAP2, were associated with recurrence.Citation47-48 We analyzed the expression status of the proteins in both MS cohorts and the association between gene expression of the six proteins and RFS and OS in TNBC and basal-like breast cancer patients. Low gene expression of all six genes correlated with a significantly worse RFS in both TNBC and basal-like breast cancer (and and Fig. S4) as well as shorter OS in basal-like breast cancer patients for all (Fig. S5), as assessed by KMplotter. In contrast, MHC class II proteins did not exhibit altered expression.
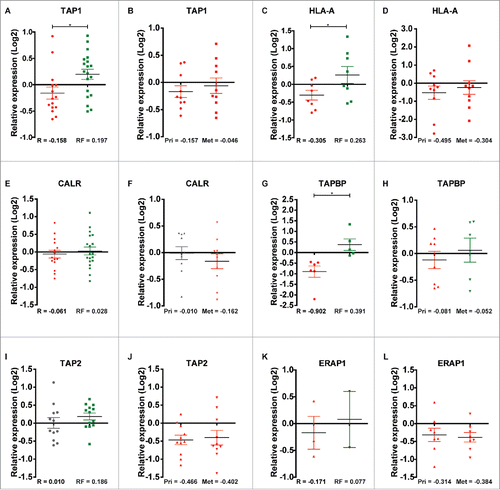
In agreement with the observation that TAP1 was downregulated in primary tumors of patients with recurrence relative to recurrence-free patients in the discovery cohort (p = 0.023, ), TAP1 was also downregulated in our second proteomic cohort consisting of 10 primary (Pri) TNBC tumors and their corresponding metastasis (Met) (). This determination was possible because the same reference was used in the analysis of both proteomics cohorts. HLA-A was also downregulated in recurrence versus recurrence-free patients from the discovery cohort, and in the primary tumor and corresponding metastasis groups of the second cohort (p = 0.045, and ). The same trend was observed for CALR, with lower expression in recurrence vs. recurrence-free patients, although the difference did not reach significance (p = 0.58, and). TAPBP were also downregulated in recurrence versus recurrence-free patients from the discovery cohort, and in the primary tumor and corresponding metastasis groups of the second cohort (p = 0.004, and ). In contrast, TAP2 did not exhibit altered expression between recurrence and recurrence-free patients (p = 0.31, ), however, TAP2 was strongly downregulated in both the primary tumor and corresponding metastasis groups in the second cohort (). ERAP1, a protein involved in N-terminal trimming of TAP1 transported peptides in the endoplasmatic reticulum, was only identified in three recurrence patients and in two recurrence-free patients with a tendency toward lower expression in the recurrence versus recurrence-free group and in eight primary patient tumors and their corresponding metastatic lesions in the second cohort (p = 0.68, and ).
Figure 8. Relative quantile normalized expression ratios for MHC class-I-associated proteins in patient samples from the discovery and second cohorts. TAP1 shows differential regulation between (A) recurrence and recurrence-free patients and overall downregulation in (B) Pri and Met samples. HLA-A displays the same tendency as TAP1 in (C) recurrence and recurrence-free patients and in (D) Pri and Met samples. CALR shows a slight differential regulation between (E) recurrence and recurrence-free samples and a neutral to downregulated profile for (F) Pri and Met, respectively. TAPBP shows differential regulation between (G) recurrence and recurrence-free samples and differential regulation between (H) Pri and Met groups. TAP2 displayed a neutral and an overall upregulated expression status in (I) recurrence and recurrence-free patients respectively and a clear downregulation in (J) Pri and Met patient samples. ERAP1 display a tendency of differential regulation in (K) recurrence and recurrence-free samples (n = 3 and 2, respectively) and is highly downregulated in (L) Pri and Met samples. *p < 0.05.
Discussion
Significant differences in outcome of TNBC patients highlight the need for delineating the factors within the cancer that give rise to these prognostic differences as well as biomarkers for clinical stratification and treatment regimens. Proteomic profiling of FFPE TNBC samples and online gene expression analysis showed that downregulation of several key molecules in the MHC-class I antigen-presentation machinery correlate with a significantly shorter recurrence-free and OS in TNBC and basal-like breast cancer patients. Previous studies demonstrated an association between outcome and the amount of TILs and expression levels of different components of the antigen-presentation machinery,Citation49-50 but a systematic global analysis has not been performed. Liu and coworkers reported lower expression of TAP1 in primary breast cancer tumors of different subtypes with known brain metastasis compared with primary tumors of patients without known brain metastasis.Citation51 Although their study was performed with an unselected patient cohort, their findings are in agreement with our observations in selected cohorts of TNBC patients with low amount of TILs and strongly implicate the role of the antigen-presentation machinery proteins in breast cancer prognosis. Downregulation of TAP transporter complex reduces diversity of cell surface antigens, leading to ineffective recognition by cytotoxic T lymphocytes (CTLs).Citation52 Further, studies in squamous cell carcinoma cell lines showed that lowering TAP1 and TAPBP expression resulted in reduced CTL-mediated killing of the cells.Citation53 The correlation observed between TILs and good outcome indicates an important function of the immune response in the progression of TNBC disease.Citation54 Forero and coworkers demonstrated that TNBC patients exhibiting good prognosis had extensive TILs and high expression of molecules in the MHC class II pathway.Citation55 Although we did not observe downregulation of MHC class II, but only class I, our data compliments their findings and potentially explains the poor outcome in a subset of TNBC patients, those tumors that lack TILs. We show for the first time in a systemic fashion and using a label-free approach on FFPE TNBC samples that the cancer cells in these tumors from poor outcome patients lack or have low levels of MHC class I antigen-presentation machinery proteins, resulting in deficient presentation of a diverse set of tumor-specific neoantigens on the cell surface and subsequent lower activation of cytotoxic CD8+ T cells. This finding may have important practical and clinical implications for stratifying patients according to whether their tumors are immune responsive or unresponsive, thus identifying patients suited for immunotherapy. For example, checkpoint inhibitors are currently under evaluation as a potentially potent treatment option for TNBC. Currently, the only biomarker in extensive clinical development for PD1/PDL1 antibody therapy is the expression level of PDL1 on cancer cells. However, our and other studies suggest that administration of PD1/PDL1 antibodies to all TNBC patients with highly PDL1-expressing tumors is unlikely to benefit patients whose tumors lack MHC class I or II expression, suggesting MHC class I or II expression should be included in the biomarker panel when examining the tumors.
Pathways associated with cell cycle, survival and growth (cell proliferation), was also found activated in recurrence versus recurrence-free patients. A causal relationship between increased cell survival and proliferation and MHC-class I antigen-presentation machinery downregulation cannot be made based on our data, but it is plausible that the lack of immune surveillance in some of the TNBCs allow the tumor cells to proliferate more readily. In the most significant network associated with cycle, survival and growth, we found STAT1, TAP1, GBP1 and EZR to be key nodes surrounding functional nodes such as P38 MAPK, NFkB and ERK1/2. STAT1 has been found to modulate the activity of TAP1 in squamous cell carcinoma of the head and neck in an IFNγ-inducible pathway mediating CTL response in this cancer type.Citation46 As a mediator of IFNγ signaling, STAT1 exerts an anti-tumorigenic effect via numerous mechanisms involving both immunosurveillanceCitation56 and angiogenetic inhibition.Citation57 Very recent data support the notion that IFNγ signaling changes how tumor cells epigenetically respond to in vivo signals. STAT1 occupancy appears to associate with these epigenomic differences and is responsible for elevated expression of cancer-related interferon-stimulated genes and multiple T cell inhibitory receptor ligands on resistant tumors. Interestingly, STAT1 has been shown to increase after persistent IFN stimulation to maintain a subset of interferon stimulated genes.Citation58,59 Like STAT1 and TAP1, GBP1 is inducible by IFNγ and has been shown to act as tumor suppressor in colorectal cancer cells.Citation60 Taken together, this indicates a higher IFNγ active state in the recurrence-free group, which has been shown to potentiate the effect of anthracycline-based chemotherapy.Citation61 The tryptophan aminoacyl synthetase WARS was likewise found to be downregulated in poor outcome samples. This observation confirms the findings of a recent publication by Campone and colleagues that high expression of WARS confers a good prognosis in TNBC patients using a nearly identical methodological setup as described here.Citation62 Aside from synthesizing tryptophan tRNA, WARS can also function as an angiostatic cytokine through alternative splicing of the N-terminal with loss of the first 47 amino acids.Citation63-64
Our proteomic analysis identified >4,000 proteins in the discovery cohort and >5,000 proteins in the second cohort, which is quite remarkable for a label-based quantification approach of FFPE tissue, particularly when only microscale amounts of protein extract (5–10 μg) from LCM-enriched cancer cells were examined. By comparison, chemical-label-based studies of FFPE samples have identified 170–730 proteins, usually from a much larger sample amount.Citation65-68 The notably higher protein identification in our analysis is likely a result of low sample manipulation, since protein extraction and digestion occurred in the same microcentrifuge tube without the need for membrane washing steps. Furthermore, the referred studies are between 3 and 6 y older and thereby run on older instruments. Recently, Yin and coworkers reported the identification of 6,294 proteins from colorectal cancer FFPE tumor tissue by iTRAQ LC-MS/MS; however, their study was performed on whole-tissue slides without using LCM.Citation69 Although LCM offers the opportunity of specifically enriching for a particular cell type, such as cancer cells in our study, it is implicit in this strategy that stromal cells and cell types of the tumor microenvironment are disregarded. Enrichment of proteins from FFPE tissue is likewise potentially biased for certain types of proteins, e.g., low molecular weight and basic proteins.Citation39 Nuclear membrane proteins may be underrepresented in FFPE tissue, while membrane and mitochondrion proteins are common,Citation70 as also observed in our data set.
Our study demonstrates a clear relationship between downregulation of MHC class I antigen presentation proteins and poor outcome in TNBC patients as analyzed at both the protein and gene levels. Further, MHC-class I antigen-presentation machinery downregulation was also observed in TNBC metastasis, suggesting that the spreading cancer cells maintain the phenotype of the primary tumor and thus the ability to evade immune surveillance.
In conclusion, we found a significant correlation between TNBC recurrence and low levels of MHC class I antigen-presentation machinery proteins, including TAP1, HLA-A and TAPBP. Our results strongly indicate that TNBC tumors lacking or exhibiting low levels of MHC class I antigen-presentation machinery proteins exhibit deficient presentation of a diverse set of tumor-specific neoantigens on the cell surface and subsequent lower activation of cytotoxic CD8+ T cells allowing the tumors to be undetected by the immune system and continuously grow and spread. Novel biomarker tests measuring the expression levels of MHC class I antigen-presentation machinery proteins could likely effectively predict recurrence risk in TNBC patients and influence therapeutic strategy. The results warrant further testing in a larger TNBC cohort both at the transcriptomic and proteomic level. Furthermore, therapeutic strategies for re-inducing the expression of MHC class I antigen-presentation machinery proteins in low expression tumors could increase tumor neo-antigens on the surface, potentially increasing the efficacy of immunotherapy.
Materials and methods
Patient tissue samples
FFPE TNBC tissues from two patient cohorts (N = 34 and N = 20) were included in the proteomic study. The discovery cohort consisted of 34 primary TNBC tumors diagnosed and treated between 1997 and 2005 at Odense University Hospital. Inclusion criteria were verified TNBC status, <70 y at diagnosis, at least 10 y of follow-up after surgery, no lymph node metastasis in the recurrence-free patient subgroup, and grade 2 tumors or higher. Re-evaluation of ER and HER2 receptor status post-LC-MS/MS revealed 5 ER and/or HER2 positive patients in the discovery cohort that were excluded in the quantitative analysis of the data. The second cohort consisted of 10 primary TNBC tumors and their corresponding paired metastases. All primary tumors in the second cohort were diagnosed and initially treated at Odense University Hospital, while post-metastatic treatment was performed at different hospitals in Denmark. Inclusion criteria for this cohort were verified TNBC status, allowable local recurrence in the axillary lymph nodes, grade 2 or higher tumors and no distant metastasis at diagnosis. Carcinomas were categorized according to the SNOMED™ criteria and graded via the Bloom and Richardson's histological grading system. Fresh-frozen tissue from 10 patients (6 recurrence and 4 recurrence-free) included in the discovery cohort was obtained from the pathology department for RNA isolation. Clinicopathological data, including time to recurrence, age at diagnosis, tumor size and adjuvant treatment status, were obtained from the Danish Breast Cancer Group. The study was approved by the Regional Scientific Ethical Committee of Southern Denmark (S-20080115).
Laser capture microdissection and protein extraction
Between 2 and 9 sections (7 µm), depending on cancer cell content, were cut from each FFPE breast cancer block, on a microtome, mounted on 1.5 µm PEN membrane slides (Olympus, Ballerup, Denmark) and air-dried. Slides were deparaffinized in xylene (3×5 min) followed by hydration in three alcohol gradients (100%, 96% and 70%) and H2O for 3, 2, 1 and 1 min, respectively. Sections were stained with Mayer's hematoxylin and Eosin for 15 and 5 sec, respectively, rinsed with water, 96% and absolute ethanol and air-dried. Dissection was performed on a Cell Cut Plus instrument (MMI AG, Glattbrugg, Switzerland). Areas of interest for laser capture microdissection (LCM) were marked on a touchscreen using a 10× objective and dissected under optimized cutting conditions. Dissected tissue was collected on adhesive IsolationCaps (MMI AG, Glattbrugg, Switzerland). The minimum required sample was 5,000,000 µm2 corresponding to 5 µg protein. Microdissected tissue was lysed in a buffer consisting of 80 µL 0.1 M NH4HCO3, pH 7.63 and 20% ACN at 95 °C in a heating block for 1 h, followed by heating at 65 °C for 2 h with agitation (650 rpm). Porcine sequencing grade trypsin (Promega) was added to the samples at a 1:50 enzyme:protein ratio. Samples were incubated at 37 °C overnight. Thereafter, samples were frozen at −80 °C and lyophilized on a vacuum centrifuge until dry. Samples were stored at −80 °C until further processing.
TMT labeling of peptides
Lyophilized peptide samples were resuspended in 30 µL 100 mM TEAB (Sigma-Aldrich). Five µL was extracted for protein concentration measurement by BCA according to the manufacturer's protocol (Pierce™ BCA Protein Assay Kit, ThermoFisher Scientific, San Jose, CA). TMT labeling reagent (TMTsixplex™, ThermoFisher Scientific, San Jose, CA) was equilibrated to room temperature and 41 µL anhydrous acetonitrile was added, followed by brief vortexing. An internal standard master mix was created by combining proteins from each patient sample. Briefly, equal amounts of protein was taken out from each sample and transferred to an Eppendorf-tube. Labeling reagent (8 µL) was added to each of the peptide samples followed by incubation for 1 h at ambient temperature. The internal standard mix was labeled with the TMT-126 reporter-ion. Reaction was quenched by addition of 2 µL, 5 % hydroxylamine for 15 minutes. Samples were combined in a 1:1 ratio, frozen at −80 °C and lyophilized to completion.
Hydrophilic interaction liquid chromatography (HILIC)
Samples were re-dissolved in 0.4 μL of 10% TFA, followed by addition of 3.6 μL of H2O and subsequently 36 μL of ACN (final volume of 40 μL peptides in 90% ACN, 0.1% TFA). The samples were injected onto an in-house-packed TSKgel Amide-80 HILIC 320 μm × 170 mm capillary HPLC column using an Agilent 1200 capillary HPLC system (Agilent Technologies, Santa Clara, USA). The peptides were eluted using a 54 min gradient from 90% ACN, 0.1% TFA to 60% ACN, 0.1% TFA at a flow rate of 6 μL/min. The fractions were automatically collected in a micro-well plate at 1 min intervals after UV detection at 210 nm, and the fractions were pooled according to UV detection to a total of seven fractions. The fractions were dried by vacuum centrifugation.
Tandem mass spectrometry (LC-MS/MS)
HILIC fractions were resuspended in 30 μL of 25 mM NH4HCO3 (Sigma Aldrich, St. Louis, MO) and analyzed in duplicate by LC-MS/MS on a nanoflow LC system (Easy-nLC 1000, ThermoFisher Scientific, San Jose, CA) coupled online with a Q-Exactive MS (ThermoFisher Scientific). Samples were resolved on a 100 μm I.D. × 360 μm O.D. × 20 cm long capillary column (Polymicro Technologies, Phoenix, AZ), which was slurry packed in house with 5 μm, 100Å pore size C-18 silica-bonded stationary phase (Magic C18AQ, Bruker). Following pre- and analytical column equilibration, each sample was loaded onto a 2-cm reversed-phase (C-18) pre-column (ThermoFisher Scientific) at 3 µL/min at 3× the injection volume with mobile phase A (0.1% formic acid in water). Peptides were eluted at a constant flow rate of 200 nL/min by development of a linear gradient of 0.33% mobile phase B (0.1% formic acid in ACN) per min for 80 min and then to 95% mobile phase B for an additional 10 min. The columns were washed for 15 min at 95% mobile phase B and then quickly brought to 100% mobile phase A for the next sample injection. The MS was configured to collect broadband mass spectra (m/z 375–1800) in profile mode using the lock mass feature for the polydimethylcyclosiloxane (PCM) ion generated in the electrospray process (m/z 445.12003). MS conditions were set as follows: electrospray voltage, 1.7 kV; no sheath and auxiliary gas flow; capillary temperature, 250°C; S-Lens RF level, 60%; resolution, 70,000 at m/z 200. The ion selection threshold for the broadband scan was set at 1E6 with a maximum ion accumulation time of 50 ms. The 10 most abundant ions were selected for MS/MS with the following settings: ion threshold, 1E6; intensity threshold, 5E3; maximum ion accumulation time, 200 ms; resolution, 17,500 at m/z 200; isolation window, 3 m/z; and dynamic exclusion, 40 s. Data for the TMT labeled samples were collected in profile mode and also had the following settings: fixed first mass, m/z 115; normalized collision energy (NCE), 30.
Quantitative protein expression analysis
All Q-Exactive raw data files were processed and quantified using Proteome Discoverer version 1.4.0.288 (Thermo Scientific). The Sequest and Mascot search algorithms (v. 2.2.3), both integrated with Proteome Discoverer, were used to search the data with the following criteria: SwissProt protein database (downloaded 5th October 2012, 452,768 entries) and restricted to humans. Fixed search parameters included trypsin, two missed cleavages allowed, and TMT labeling at lysine and N-terminal amines, while methionine oxidation and deamidation were set as dynamic. Precursor mass tolerance was set to 8 ppm and fragment mass tolerance was set to 0.05 Da. Peptide data were extracted using Mascot significance threshold 0.05 and minimum peptide length 6. A minimum of two peptides were used for protein identification, and a minimum of two unique peptides were used for protein quantitation. False discovery rate (FDR) was calculated using a decoy database search and only high confidence peptide identifications (FDR < 1 %) were included. Protein expression data was log2 transformed and quantile normalized. Fold changes between recurrence and recurrence-free patients were determined by taking the difference (x = recurrence/recurrence-free) and raising two to the power of x (2x).
The mass spectrometry proteomics data have been deposited to the ProteomeXchange Consortium (http://proteomecentral.proteomexchange.org) via the PRIDE partner repository with the data set identifier PXD005544.
Online gene expression validation of significant proteins
We used a previously established Kaplan-Meier (KM) plotter analysis platformCitation68 to analyze significant (p < 0.05) proteins from the MS data in published gene expression data sets. The online tool (http://www.kmplotter.com/breast) contains 4,142 breast cancer patients curated from 26 GEO gene expression data sets, of which 3,557 have RFS data. Of the 3,557 breast cancer patients, 249 are confirmed TNBC patients by IHC. Each percentile between the lower and upper quartiles was computed for each analyzed gene expression and the best-performing threshold was used as cutoff in the Cox regression analysis.Citation69 KMplotter then generated survival plots with hazard ratios, 95% confidence intervals and log rank p value for each selected gene probe (the best JetSet gene probe was always selected). Basal-like breast cancer patients in the database were identified by low expression of ER and HER2 using Affymetrix HGU133A or HGU133plus2 arrays with cutoff values of 500 and 4,800, respectively.Citation71-72
Quantitative real-time PCR
RNA from frozen TNBC patient tumors was isolated using TRIzol® followed by reverse transcription to cDNA using random hexamer oligonucleotide primers (Thermo Scientific). Relative quantification of TAP1 gene expression was performed in duplicate using QuantiTect SYBR Green PCR kit (Qiagen; Applied Biosystems StepOnePlus) and primers: TAP1: QT00057288, PUM1: QT00029421, ACTB: QT0009531 (Qiagen). The relative median expression was normalized using PUM1 and ACTB as reference genes. Expression was shown as fold change relative to a random recurrence-free patient.
Statistical analysis
RStudio 3.2.0 and GraphPad Prism 5.01 were used for statistical analysis. All p-value calculations were two-sided and homoscedastic and p < 0.05 was considered statistically significant. Network analysis was performed in IPA (Ingenuity, Qiagen). DFS and OS curves were generated by Kaplan-Meier survival analysis in GraphPad Prism 5. Hazard ratio (HR) and p-values were calculated via log-rank tests. Unsupervised cluster analysis was performed in RStudio 3.2.0 using the Heatmap.2 function in the gplots 3.0.1 package.
Disclosure of potential conflicts of interest
No potential conflicts of interest were disclosed.
Supplementary_materials.zip
Download Zip (3.6 MB)Funding
This work was supported by the Danish Council for Independent Research (DFF), The Danish Cancer Society, the Region of Southern Denmarks Research Council, the Foundation for the Advancement of Medical Research (A.P. Møller Foundation), Race Against Breast Cancer, NEXT bioinformatic (National Experimental Therapy Partnership) financed by Innovation Fund Denmark, Manufacturer Einar Willumsens Memorial Foundation, Therese Maria Hansen born Beers Foundation, the Neye Foundation and Engineer K. A. Rohde and wife Foundation.
References
- Lee JA, Kim KI, Bae JW, Jung YH, An H, Lee ES, Korean Breast Cancer Society. Triple negative breast cancer in Korea-distinct biology with different impact of prognostic factors on survival. Breast Cancer Res Treat 2010; 123(1):177-87; PMID:20574671; https://doi.org/10.1007/s10549-010-0998-5
- Pogoda K, Niwinska A, Murawska M, Pienkowski T. Analysis of pattern, time and risk factors influencing recurrence in triple-negative breast cancer patients. Med Oncol 2013; 30(1):388; PMID:23292831; https://doi.org/10.1007/s12032-012-0388-4
- Dent R, Trudeau M, Pritchard KI, Hanna WM, Kahn HK, Sawka CA, Lickley LA, Rawlinson E, Sun P, Narod SA. Triple-negative breast cancer: Clinical features and patterns of recurrence. Clin Cancer Res 2007; 13(15 Pt 1):4429-34; PMID:17671126; https://doi.org/10.1158/1078-0432.CCR-06-3045
- Lin NU, Vanderplas A, Hughes ME, Theriault RL, Edge SB, Wong YN, Blayney DW, Niland JC, Winer EP, Weeks JC. Clinicopathologic features, patterns of recurrence, and survival among women with triple-negative breast cancer in the national comprehensive cancer network. Cancer 2012; 118(22):5463-72; PMID:22544643; https://doi.org/10.1002/cncr.27581
- Anders CK, Deal AM, Miller CR, Khorram C, Meng H, Burrows E, Livasy C, Fritchie K, Ewend MG, Perou CM et al. The prognostic contribution of clinical breast cancer subtype, age, and race among patients with breast cancer brain metastases. Cancer 2011; 117(8):1602-11; PMID:21472708; https://doi.org/10.1002/cncr.25746
- Liu NQ, Stingl C, Look MP, Smid M, Braakman RB, De Marchi T, Sieuwerts AM, Span PN, Sweep FC, Linderholm BK et al. Comparative proteome analysis revealing an 11-protein signature for aggressive triple-negative breast cancer. J Natl Cancer Inst 2014; 106(2):djt376; PMID:24399849; https://doi.org/10.1093/jnci/djt376
- Irwin WJ, Carey LA. What is triple-negative breast cancer? Eur J Cancer 2008; 44(18):2799-805; PMID:19008097; https://doi.org/10.1016/j.ejca.2008.09.034
- Kreike B, van Kouwenhove M, Horlings H, Weigelt B, Peterse H, Bartelink H, van de Vijver MJ. Gene expression profiling and histopathological characterization of triple-negative/basal-like breast carcinomas. Breast Cancer Res 2007; 9:R65; PMID:17910759; https://doi.org/10.1186/bcr1771
- Bertucci F, Finetti P, Cervera N, Esterni B, Hermitte F, Viens P, Birnbaum D. How basal are triple-negative breast cancers? Int J Cancer 2008; 123(1):236-40; PMID:18398844; https://doi.org/10.1002/ijc.23518
- Sorlie T, Perou CM, Tibshirani R, Aas T, Geisler S, Johnsen H, Hastie T, Eisen MB, van de Rijn M, Jeffrey SS et al. Gene expression patterns of breast carcinomas distinguish tumor subclasses with clinical implications. Proc Natl Acad Sci U S A 2001; 98(19):10869-74; PMID:11553815; https://doi.org/10.1073/pnas.191367098
- Nielsen TO, Hsu FD, Jensen K, Cheang M, Karaca G, Hu Z, Hernandez-Boussard T, Livasy C, Cowan D, Dressler L et al. Immunohistochemical and clinical characterization of the basal-like subtype of invasive breast carcinoma. Clin Cancer Res 2004; 10(16):5367-74; PMID:15328174; https://doi.org/10.1158/1078-0432.CCR-04-0220
- Livasy CA, Karaca G, Nanda R, Tretiakova MS, Olopade OI, Moore DT, Perou CM. Phenotypic evaluation of the basal-like subtype of invasive breast carcinoma. Mod Pathol 2006; 19(2):264-71; PMID:16341146; https://doi.org/10.1038/modpathol.3800528
- Rakha EA, Elsheikh SE, Aleskandarany MA, Habashi HO, Green AR, Powe DG, El-Sayed ME, Benhasouna A, Brunet JS, Akslen LA et al. Triple-negative breast cancer: Distinguishing between basal and nonbasal subtypes. Clin Cancer Res 2009; 15(7):2302-10; PMID:19318481; https://doi.org/10.1158/1078-0432.CCR-08-2132
- Goldhirsch A, Wood WC, Coates AS, Gelber RD, Thürlimann B, Senn HJ et al. Strategies for subtypes-dealing with diversity of breast cancer: Highlights of the St. Gallen internaional expert consensus on the primary therapy of early breast cancer 2011. Ann Oncol 2011; 22(8):1736-47; PMID:21709140; https://doi.org/10.1093/annonc/mdr304
- Canna K, McArdle PA, McMillan DC, McNicol AM, Smith GW, McKee RF, McArdle CS. The relationship between tumour T-lymphocyte infiltration, the systemic inflammatory response and survival in patients undergoing curative resection for colorectal cancer. Br J Cancer 2005; 92(4):651-4; PMID:15700032; https://doi.org/10.1038/sj.bjc.6602419
- Zhang L, Conejo-Garcia JR, Katsaros D, Gimotty PA, Massobrio M, Regnani G, Makrigiannakis A, Gray H, Schlienger K, Liebman MN et al. Intratumoral T cells, recurrence, and survival in epithelial ovarian cancer. N Engl J Med 2003; 348(3):203-13; PMID:12529460; https://doi.org/10.1056/NEJMoa020177
- Mahmoud SM, Paish EC, Powe DG, Macmillan RD, Grainge MJ, Lee AH, Ellis IO, Green AR. Tumor-infiltrating CD8+ lymphocytes predict clinical outcome in breast cancer. J Clin Oncol 2011; 29(15):1949-55; PMID:21483002; https://doi.org/10.1200/JCO.2010.30.5037
- Baker K, Lachapelle J, Zlobec I, Bismar TA, Terracciano L, Foulkes WD. Prognostic significance of CD8+ T lymphocytes in breast cancer depends upon both oestrogen receptor status and histological grade. Histopathology 2011; 58(7):1107-16; PMID:21707712; https://doi.org/10.1111/j.1365-2559.2011.03846.x
- Liu S, Lachapelle J, Leung S, Gao D, Foulkes WD, Nielsen TO. CD8+ lymphocyte infiltration is an independent favorable prognostic indicator in basal-like breast cancer. Breast Cancer Res 2012; 14(2):R48; PMID:22420471; https://doi.org/10.1186/bcr3148
- Tian T, Ruan M, Yang W, Shui R. Evaluation of the prognostic value of tumor-infiltrating lymphocytes in triple-negative breast cancers. Oncotarget 2016; 7(28):44395-405; PMID:27323808; https://doi.org/10.18632/oncotarget.10054
- Matsumoto H, Thike AA, Li H, Yeong J, Koo SL, Dent RA, Tan PH, Iqbal J. Increased CD4 and CD8-positive T cell infiltrate signifies good prognosis in a subset of triple-negative breast cancer. Breast Cancer Res Treat 2016; 156(2):237-47; PMID:26960711; https://doi.org/10.1007/s10549-016-3743-x
- Pruneri G, Gray KP, Vingiani A, Viale G, Curigliano G, Criscitiello C, Láng I, Ruhstaller T, Gianni L, Goldhirsch A et al. Tumor-infiltrating lymphocytes (TILs) are a powerful prognostic marker in patients with triple-negative breast cancer enrolled in the IBCSG phase III randomized clinical trial 22-00. Breast Cancer Res Treat 2016; 158(2):323-31; PMID:27372069; https://doi.org/10.1007/s10549-016-3863-3
- Yeat NC, Lin C, Sager M, Lin J. Cancer proteomics: Developments in technology, clinical use and commercialization. Expert Rev Proteomics 2015; 12(4):391-405; PMID:26145529; https://doi.org/10.1586/14789450.2015.1051969
- Rogers S, Girolami M, Kolch W, Waters KM, Liu T, Thrall B, Wiley HS. Investigating the correspondance between transcriptomic and proteomic expression profiles using coupled cluster models. Bioinformatics 2008; 24(24):2894-900; PMID:18974169; https://doi.org/10.1093/bioinformatics/btn553
- Hood BL, Darfler MM, Guiel TG, Furusato B, Lucas DA, Ringeisen BR, Sesterhenn IA, Conrads TP, Veenstra TD, Krizman DB. Proteomic analysis of formalin-fixed prostate cancer tissue. Mol Cell Proteomics 2005; 4(11):1741-53; PMID:16091476; https://doi.org/10.1074/mcp.M500102-MCP200
- Abramowitz M, Leyland-Jones B. A systems approach to clinical oncology: Focus on breast cancer. Proteome Sci 2006; 4(4):5; PMID:16595007; https://doi.org/10.1186/1477-5956-4-5
- Assadi M, Lamerz J, Jarutat T, Farfsing A, Paul H, Gierke B, Breitinger E, Templin MF, Essioux L, Abrogast S et al. Multiple protein analysis of formalin-fixed and paraffin-embedded tissue samples with reverse phase protein arrays. Mol Cell Proteomics 2013; 12(9):2615-22; PMID:23653450; https://doi.org/10.1074/mcp.M112.023051
- Berg D, Hipp S, Malinowsky K, Böllner C, Becker KF. Molecular profiling of signalling pathways in formalin-fixed and paraffin-embedded cancer tissues. Eur J Cancer 2010; 46(1):47-55; PMID:19914823; https://doi.org/10.1016/j.ejca.2009.10.016
- Chung JY, Hewitt SM. A well-based reverse-phase protein array of formalin-fixed paraffin-embedded tissue. Methods Mol Biol 2015; 1312:129-39; PMID:26043998; https://doi.org/10.1007/978-1-4939-2694-7_17
- Bateman NW, Sun M, Bhargavva R, Hood BL, Darfler MM, Kovatich AJ, Hooke JA, Krizman DB, Conrads TP. Differential proteomic analysis of late-stage and recurrent breast cancer from formalin-fixed paraffin-embedded tissues. J Proteome Res 2011; 10(3):1323-32; PMID:21155598; https://doi.org/10.1021/pr101073s
- Gámez-Pozo A, Berges-Soria J, Arevalillo JM, Nanni P, López-Vacas R, Navarro H, Grossmann J, Castaneda CA, Main P, Díaz-Almirón M et al. Combined label-free quantitative proteomics and microRNA expression analysis of breast cancer unravel molecular differences with clinical implications. Cancer Res 2015; 75(11):2243-53; PMID:25883093; https://doi.org/10.1158/0008-5472.CAN-14-1937
- Kennedy JJ, Whiteaker JR, Schoenherr RM, Yan P, Allison K, Shipley M, Lerch M, Hoofnagle AN, Baird GS, Paulovich AG. Optimized protocol for quantitative multiple reaction monitoring-based proteomic analysis of formalin-fixed, paraffin-embedded tissues. J Proteome Res 2015; 15(8):2717-28; PMID:27462933; https://doi.org/10.1021/acs.jproteome.6b00245
- Alkhas A, Hood BL, Oliver K, Teng PN, Oliver J, Mitchell D, Hamilton CA, Maxwell GL, Conrads TP. Standardization of a sample preparation and analytical workflow for proteomics of archival endometrial cancer tissue. J Proteome Res 2010; 10(11):5264-71; PMID:21932769; https://doi.org/10.1021/pr2007736
- Cheung W, Darfler MM, Alvarez H, Hood BL, Conrads TP, Habbe N, Krizman DB, Mollenhauer J, Feldmann G, Maitra A. Application of a global proteomic approach to archival precursor lesions: Deleted in malignant brain tumors 1 and tissue transglutaminase 2 are upregultated in pancreatic cancer precursors. Pancreatology 2008; 8(6):608-16; PMID:18849643; https://doi.org/10.1159/000161012
- Patel V, Hood BL, Molinolo AA, Lee NH, Conrads TP, Braisted JC, Krizman DB, Veenstra TD, Gutkind JS. Proteomics analysis of laser-captured paraffin-embedded tissues: A molecular portrait of head and neck cancer progression. Clin Cancer Res 2008; 14(4):1002-14; PMID:18281532; https://doi.org/10.1158/1078-0432.CCR-07-1497
- Sprung RW, Martinez MA, Carpenter KL, Ham AJ, Washington MK, Arteaga CL, Sanders ME, Liebler DC. Precision of multiple reaction monitoring mass-spectrometry analysis of formalin-fixed, paraffin-embedded tissue. J Proteome Res 2012; 11(6):3498-505; PMID:22530795; https://doi.org/10.1021/pr300130t
- Guzel C, Ursem NT, Dekker LJ, Derkx P, Joore J, van Dijk E, Ligtvoet G, Steegers EA, Luider TM. Multiple reaction monitoring assay for pre-eclampsia related calcyclin peptides in formalin fixed paraffin embedded placenta. J Proteome Res 2011; 10(7):3274-82; PMID:21329384; https://doi.org/10.1021/pr1010795
- Guo T, Wang W, Rudnick PA, Song T, Li J, Zhuang Z, Weil RJ, DeVoe DL, Lee CS, Balgley BM. Proteome analysis of microdissected formalin-fixed and paraffin-embedded tissue specimens. J Histochem Cytochem 2007; 55(7):763-72; PMID:17409379; https://doi.org/10.1369/jhc.7A7177.2007
- Tanca A, Pagnozzi D, Burrai GP, Polinas M, Uzzau S, Antuofermo E, Addis MF. Comparability of differential proteomics data generated from paired archival fresh-frozen and formalin-fixed samples by GeLC-MS/MS and spectral counting. J Proteomics 2012; 77:561-76; PMID:23043969; https://doi.org/10.1016/j.jprot.2012.09.033
- Elliott BE, Meens JA, SenGupta SK, Louvard D, Arpin M. The membrane cytoskeletal crosslinker ezrin is required for metastasis of breast carcinoma cells. Breast Cancer Res 2005; 7(3):R365-73; PMID:15987432; https://doi.org/10.1186/bcr1006
- Ma L, Jiang T. Clinical implications of Ezrin and CD44 co-expression in breast cancer. Oncol Rep 2013; 30(4):1899-905; PMID:23900701; https://doi.org/10.3892/or.2013.2641
- Saito S, Yamamoto H, Mukaisho K, Sato S, Higo T, Hattori T, Yamamoto G, Sugihara H. Mechanisms underlying cancer progression caused by ezrin overexpression in tongue squamous cell carcinoma. PLoS One 2013; 8(1):e54881; PMID:23357878; https://doi.org/10.1371/journal.pone.0054881
- Machowska M, Wachowicz K, Sopel M, Rzepecki R. Nuclear localization of tumor suppressor protein maspin inhibits proliferation of breast cancer cells without affecting proliferation of normal epithelial cells. BMC Cancer 2014; 14:142; PMID:24581141; https://doi.org/10.1186/1471-2407-14-142
- Charette SJ, Landry J. The interactions of HSP27 with Daxx identifies a potential regulatory role of HSP27 in fas-induced apoptosis. Ann N Y Acad Sci 2000; 926:126-31; PMID:11193028; https://doi.org/10.1111/j.1749-6632.2000.tb05606.x
- Gimenez M, Marie SK, Oba-Shinjo S, Uno M, Izumi C, Oliveira JB, Rosa JC. Quantitative proteomic analysis shows differentially expressed HSPB1 in glioblastoma as a discriminating short from long survival factor and NOVA1 as a differentiation factor between low-grade astrocytoma and oligodendrioglioma. BMC Cancer 2015; 15:481; PMID:26108672; https://doi.org/10.1186/s12885-015-1473-9
- Leibowitz MS, Andrade Filho PA, Ferrone S, Ferris RL. Deficiency of activated STAT1 in head and neck cancer cells mediates TAP1-dependent escape from cytotoxic T lymphocytes. Cancer Immunol Immunother 2011; 60(4):525-35; PMID:21207025; https://doi.org/10.1007/s00262-010-0961-7
- Schölz C, Tampé R. The intracellular antigen transporter machinery TAP in adaptive immunity and virus escape mechanisms. J Bioenerg Biomembr 2005; 37(6):509-15; PMID:16691491; https://doi.org/10.1007/s10863-005-9500-1
- Bangia N, Ferrone S. Antigen presentation machinery (APM) modulation and soluble HLA molecules in the tumor microenvironment: Do they provide tumor cells with escape mechanisms from recognition by cytotoxic T lymphocytes? Immunol Invest 2006; 35(3-4):485-503; PMID:16916763; https://doi.org/10.1080/08820130600808246
- Whitford P, George WD, Campbell AM. Flow cytometric analysis of tumour infiltrating lymphocyte activation and tumour cell MHC class I and II expression in breast cancer patients. Cancer Lett 1992; 61(2):157-64; PMID:1730139; https://doi.org/10.1016/0304-3835(92)90174-T
- van Houdt IS, Sluijter BJ, Moesbergen LM, Vos WM, de Gruijl TD, Molenkamp BG, van den Eertwegh AJ, Hooijberg E, van Leeuwen PA, Meijer CJ et al. Favorable outcome in clinically stage II melanoma patients is associated with the presence of activated tumor infiltrating T-lymphocytes and preserved MHC class I antigen expression. Int J Cancer 2008; 123(3):609-15; PMID:18498132; https://doi.org/10.1002/ijc.23543
- Liu Y, Komohara Y, Domenick N, Ohno M, Ikeura M, Hamilton RL, Horbinski C, Wang X, Ferrone S, Okada H. Expression of antigen processing and presenting molecules in brain metastasis of breast cancer. Cancer Immunol Immunother 2012; 61(6):789-801; PMID:22065046; https://doi.org/10.1007/s00262-011-1137-9
- Seliger B, Maeurer MJ, Ferrone S. Antigen-processing machinery breakdown and tumor growth. Immunol Today 2000 Sep; 21(9):455-64; PMID:10953098; https://doi.org/10.1016/S0167-5699(00)01692-3
- López-Albaitero A, Nayak JV, Ogino T, Machandia A, Gooding W, DeLeo AB, Ferrone S, Ferris RL. Role of antigen-processing machinery in the in vitro resistance of squamous cell carcinoma of the head and neck cells to recognition by CTL. J Immunol 2006; 176(6):3402-9; PMID:16517708; https://doi.org/10.4049/jimmunol.176.6.3402
- Hida AI, Sagara Y, Yotsumoto D, Kanemitsu S, Kawano J, Baba S, Rai Y, Oshiro Y, Aogi K, Sagara Y et al. Prognostic and predictive impacts of tumor-infiltrating lymphocytes differ between triple-negative and HER2-positive breast cancers treated with standard systemic therapies. Breast Cancer Res Treat 2016; 158(1):1-9; PMID:27260189; https://doi.org/10.1007/s10549-016-3848-2
- Forero A, Li Y, Chen D, Grizzle WE, Updike KL, Merz ND, Downs-Kelly E, Burwell TC, Vaklavas C, Buchsbaum DJ et al. Expression of the MHC class II pathway in triple-negative breast cancer tumor cells is associated with a good prognosis and infiltrating lymphocytes. Cancer Immunol Res 2016; 4(5):390-9; PMID:26980599; https://doi.org/10.1158/2326-6066.CIR-15-0243
- Brucet M, Marqués L, Sebastián C, Lloberas J, Celada A. Regulation of murine Tap1 and Lmp2 genes in macrophages by interferon gamma is mediated by STAT1 and IRF-1. Genes Immun 2004; 5(1):26-35; PMID:14735146; https://doi.org/10.1038/sj.gene.6364035
- Battle TE, Lynch RA, Frank DA. Signal transducer and activator of transcription 1 activation in endothelial cells is a negative regulator of angiogenesis. Cancer Res 2006; 66(7):3649-57; PMID:16585190; https://doi.org/10.1158/0008-5472.CAN-05-3612
- Benci JL, Xu B, Qiu Y, Wu TJ, Dada H, Twyman-Saint\sVictor C, Cucolo L, Lee DS, Pauken KE, Huang AC et al. Tumor interferon signaling regulates a multigenic resistance program to immune checkpoint blockade. Cell 2016; 167(6):1540-54; PMID:27912061; https://doi.org/10.1016/j.cell.2016.11.022
- Reading JL, Quezada SA. Too much of a good thing? Chronic IFN fuels resistance to cancer immunotherapy. Immunity 2016; 45(6):1181-3; PMID:28002724; https://doi.org/10.1016/j.immuni.2016.12.004
- Britzen-Laurent N, Lipnik K, Ocker M, Naschberger E, Schellerer VS, Croner RS, Vieth M, Waldner M, Steinberg P, Hohenadl C et al. GBP-1 acts as a tumor suppressor in colorectal cancer cells. Carcinogenesis 2013; 34(1):153-62; PMID:23042300; https://doi.org/10.1093/carcin/bgs310
- Mattarollo SR, Loi S, Duret H, Ma Y, Zitvogel L, Smyth MJ. Pivotal role of innate and adaptive immunity in anthracycline chemotherapy of established tumors. Cancer Res 2011; 71(14):4809-20; PMID:21646474; https://doi.org/10.1158/0008-5472.CAN-11-0753
- Campone M, Valo I, Jézéquel P, Moreau M, Boissard A, Campion L, Loussouarn D, Verriele V, Coqueret O, Guette C. Prediction of recurrence and survival for triple-negative breast cancer (TNBC) by a protein signature in tissue samples. Mol Cell Proteomics 2015; 14(11):2936-46; PMID:26209610; https://doi.org/10.1074/mcp.M115.048967
- Tolstrup AB, Bejder A, Fleckner J, Justesen J. Transcriptional regulation of the interferon-gamma-inducible tryptophanyl-tRNA synthase includes alternative splicing. J Biol Chem 1995; 270(1):397-403; PMID:7814400; https://doi.org/10.1074/jbc.270.1.397
- Otani A, Slike BM, Dorrell MI, Hood J, Kinder K, Ewalt KL, Cheresh D, Schimmel P, Friedlander M. A fragment of human TrpRS as a potent antagonist of ocular angiogenesis. Proc Natl Acad Sci U S A 2002; 99(1):178-83; PMID:11773625; https://doi.org/10.1073/pnas.012601899
- Nakatani S, Wei M, Ishimura E, Kakehashi A, Mori K, Nishizawa Y, Inaba M, Wanibuchi H. Proteome analysis of laser capture microdissected glomeruli from formalin-fixed paraffin-embedded kidneys of autopsies of diabetic patients: Nephronectin is associated with the development of diabetic glomerulosclerosis. Nephrol Dial Transplant 2012; 27(5):1889-97; PMID:22172726; https://doi.org/10.1093/ndt/gfr682
- Maes E, Valkenborg D, Mertens I, Broeckx V, Baggerman G, Sagaert X, Landuyt B, Prenen H, Schoofs L. Proteomic analysis of formalin-fixed paraffin-embedded colorectal cancer tissue using tandem mass tag protein labeling. Mol Biosyst 2013; 9(11):2686-95; PMID:23986405; https://doi.org/10.1039/c3mb70177h
- Xiao Z, Li G, Chen Y, Li M, Peng F, Li C, Li F, Yu Y, Ouyang Y, Xiao Z et al. Quantitative proteomic analysis of formalin-fixed paraffin-embedded nasopharyngal carcinoma using iTRAQ labeling, two-dimensional liquid chromatography, and tandem mass spectrometry. J Histochem Cytochem 2010; 58(6):517-27; PMID:20124091; https://doi.org/10.1369/jhc.2010.955526
- Jain MR, Li Q, Liu T, Rinaggio J, Ketkar A, Tournier V, Madura K, Elkabes S, Li H. Proteomic identification of immunoproteasome accumulation in formalin-fixed rodent spinal cords with experimental autoimmune encephalomyelitis. J Proteome Res 2012; 11(3):1791-803; PMID:22188123; https://doi.org/10.1021/pr201043u
- Yin X, Zhang Y, Guo S, Jin H, Wang W, Yang P. Large scale systematic proteomic quantification from non-metastatic to metastatic colorectal cancer. Sci Rep 2015; 15(5):12120; PMID:26175278; https://doi.org/10.1038/srep12120
- Tanca A, Abbondio M, Pisanu S, Pagnozzi D, Uzzau S, Addis MF. Critical comparison of sample preparation strategies for shotgun proteomic analysis of formalin-fixed, paraffin-embedded samples: Insights from liver tissue. Clin Proteomics 2014; 11(1):28; PMID:25097466; https://doi.org/10.1186/1559-0275-11-28
- Gyorffy B, Lanczky A, Eklund AC, Denkert C, Budczies J, Li Q, Szallasi Z. An online survival analysis tool to rapidly assess the effect of 22,277 genes on breast cancer prognosis using microarray data of 1,809 patients. Breast Cancer Res Treat 2010; 123(3):725-31; PMID:20020197; https://doi.org/10.1007/s10549-009-0674-9
- Mihály Z, Kormos M, Lánczky A, Dank M, Budczies J, Szász MA, Győrffy B. A meta-analysis of gene expression-based biomarkers predicting outcome after tamoxifen treatment in breast cancer. Breast Cancer Res Treat 2013; 140(2):219-32; PMID:23836010; https://doi.org/10.1007/s10549-013-2622-y