
ABSTRACT
Stem cell-like tumor-repopulating cells (TRCs) have a critical role in establishing a tumor immunosuppressive microenvironment. However, means to enhance antitumor immunity by disrupting TRCs are absent. Our previous studies have shown that tumor cell-derived microparticles (T-MPs) preferentially abrogate TRCs by delivering antitumor drugs into nuclei of TRCs. Here, we show that low dose irradiation (LDI) enhances the effect of cisplatin-packaging T-MPs (Cis-MPs) on TRCs, leading to inhibiting tumor growth in different tumor models. This antitumor effect is not due to the direct killing of tumor cells but is T cell-dependent and relies on macrophages for their efficacy. The underlying mechanism is involved in therapeutic reprograming macrophages from tumor-promotion to tumor-inhibition by disrupting TRCs and curtailing their vicious education on macrophages. These findings provide a novel strategy to reset macrophage polarization and confer their function more like M1 than M2 types with highly promising potential clinical applications.
Introduction
Despite the success of current immunotherapies such as checkpoint inhibitor blockade, adoptive cell transfer and oncolytic virus treatment in patients with a broad spectrum of cancers, recurrence still occurs, begging for a better understanding of the relationship between immune cells and tumor cells.Citation1-4 Stem cell-like cancer cells that can repopulate tumors tumor-repopulating cells (TRC)Citation5-7 are a self-renewing, highly tumorigenic subpopulation of cancer cells and play crucial roles in the initiation, promotion and progression of tumorigenesis. Recent studies have highlighted the critical role of TRCs in regulating the effect of immune cells on tumors.Citation8 On the one hand, TRCs themselves effectively evade immune-derived killing by (1) producing immunosuppressive molecules;Citation9 (2) recruiting immunosuppressive cells;Citation10 (3) losing antigen processing and presentation machinery and downregulating the expression of MHC I and co-stimulatory molecules.Citation11 On the other hand, tumorigenic TRCs profoundly reset immune cells, including macrophages and regulatory T cells into tumor-promoting ones.Citation12-13 Thereby, in addition to the direct decrease of cell numbers, targeting tumorigenic cells may relieve tumor immunosuppression and improve antitumor immune responses. However, notwithstanding the current chemotherapy, radiotherapy and target therapy that kill differentiated tumor cells, the means to abrogate stem-like tumorigenic TRCs remains unavailable.
Upon stimulation or apoptosis, cells can change their cytoskeleton, leading to encapsulation of cytosolic contents within cellular membrane to form vesicles that are subsequently released into extracellular space.Citation14 Such specialized subcellular vesicles with 0.1–1 μm sizes are called microparticles (MPs). Recently, we have demonstrated that tumor cell-derived MPs (T-MPs) are capable of delivering chemotherapeutic drugs or oncolytic adenoviruses to nuclei of TRCs and disrupting them through a lysosome-mediated pathway,Citation15-19 suggesting that drug-packaging MPs might be a potential means to improve antitumor immunity by abrogating TRCs. However, whether such drug-packaging MP-based approach of targeting TRCs can be strengthened by other means is not clear. Radiotherapy is a conventional method for cancer treatment with typical side effects. To decrease the side effects, low-dose irradiation (LDI) has been explored. Intriguingly, despite its very poor tumor cell-killing effect, LDI is actually able to improve antitumor immunity through modulating macrophages, recruiting T cells to tumor sites and other ways,Citation19-20 raising a possibility of LDI enhancing the anti-TRC effect of drug-MPs followed by a better modulation of antitumor immune microenvironments. This study demonstrates that the combination of drug-packaging MPs and LDI effectively reverses macrophage polarization from tumor-promoting to tumor-inhibiting through disrupting TRCs, providing a new strategy for tumor immunotherapy.
Results
Combination of Cis-MPs and LDI generates better tumor treatment outcomes
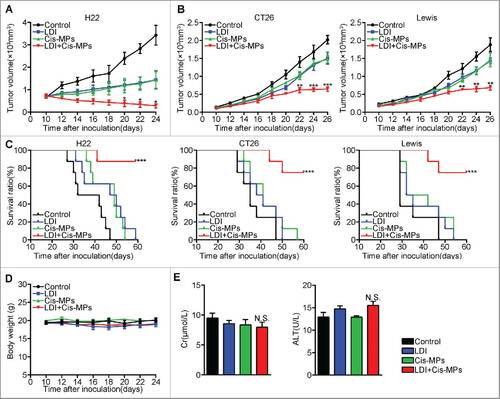
To determine whether drug-packaging MPs combining LDI generates a better antitumor consequence, H22 hepatocarcinoma cells (2 × 10⁵) were subcutaneously injected into BABL/c mice. When tumor reached 8 × 8 mm, the mice were received twice 2 Gy LDI treatment (once per 3 d). This dosage was considered as a low dose, since neither the weight nor the survival of the mice was influenced by the irradiation (Fig. S1A and S1B). Mice were then intravenously injected with cisplatin-packaging MPs (Cis-MPs) following each LDI. The result showed that this combined treatment was superior to single treatments and markedly inhibited tumor growth (). Such expected outcomes from combined treatment were also observed in mice with CT-26 colon or Lewis lung cancer (). Moreover, combining Cis-MPs and LDI significantly prolonged the survival of those tumor-bearing mice (). Notably, this combination neither induced the hair and weight changes () nor altered liver and kidney functions (). Together, these data suggest that the combination of drug-packaging T-MPs and LDI may generate a better treatment outcome against cancers.
Figure 1. Combination of Cis-MPs and LDI generates better tumor treatment outcomes. (A) BALB/c mice were pre-inoculated with 2 × 10⁵ H22 tumor cells. When the tumor reached 8 × 8 mm, mice were received LDI or i.v. injected with cisplatin-packaging MPs alone or combination treatment. Tumor volumes were measured and calculated every day. Data are representative of three independent experiments, and error bars represent means ± SEM, n = 8, #p < 0.05, LDI + Cisplatin-MPs group compared with other groups. (B) Tumor volumes of CT-26 colon and Lewis lung cancer were measured and calculated every day. Data are representative of three independent experiments, and error bars represent means ± SEM, n = 8, ##p < 0.01, ###p < 0.001, LDI + Cisplatin-MPs group compared with other groups. (C) The percentage of surviving mice was analyzed by Log-rank test, n = 8, ###p < 0.001, LDI + Cisplatin-MPs group compared with other groups. (D) Weight of mice was measured every day. Data are representative of three independent experiments, and error bars represent means ± SEM, n = 8, N.S., not statistically significant, LDI + Cisplatin-MPs group compared with other groups. (E) Serum levels of creatinine and glutamic-pyruvate transaminase was detected. Data are representative of three independent experiments, and error bars represent means ± SEM, N.S., not statistically significant, LDI + Cisplatin-MPs group compared with other groups.
T cells are required to mediate the antitumor effect of Cis-MPs and LDI
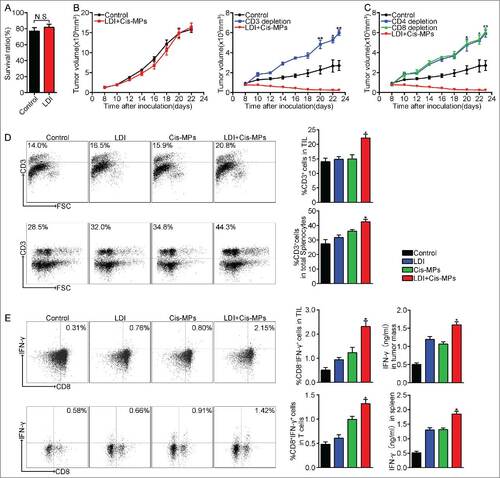
Regardless of the above effective treatment on tumors, closer study showed no increased apoptosis 24 h after irradiation (4 Gy) in these mice (). On the other hand, we only injected 2 × 10⁶ Cis-MPs to each mouse with large tumor (8 × 8 mm2). Although such small numbers of drug-packaging MPs can be expected to only kill a very small number of tumor cells by themselves, recent success of immunotherapy in clinic practice, however, suggests that a potential immune regulation retains the abilities to kill tumor cells. In this regard, we hypothesized that the above combination antitumor effect might be due to the activation of antitumor immunity. To test this hypothesis, we used T cell-deficient nude mice to repeat the above experiment, since T cells are thought as the most important antitumor immune cell types.Citation21 Surprisingly, T cell deficiency caused the complete loss of the above treatment efficacy (), which was also confirmed in the mice pre-treated with CD3 antibody that depleted T cells (). We thus further depleted CD4+ T cells and CD8+ T cells, respectively. We found that the depletion of either CD4+ or CD8+ T cells impaired the antitumor effect of the above combined treatment (). In line with these results, more CD3+ T cells were recruited to tumor mass and the expression of IFNγ was also upregulated in those tumor-infiltrating T cells as well as splenic T cells (). Together, these data suggest that T cells are required to mediate the combined antitumor effect of Cis-MPs and LDI.
Figure 2. T cells are required to mediate the antitumor effect of Cis-MPs and LDI. (A) BALB/c mice were s.c. inoculated with 2 × 10⁵ H22 tumor cells, followed by 2 × 2 Gy irradiation treatment when tumor reached 8 × 8 mm. Apoptosis of tumor cells in tumor tissues was analyzed by flow cytometry. Data are representative of three independent experiments, and error bars represent means ± SEM, N.S., not statistically significant. (B) Nude mice, pre-inoculated with H22 tumor cells, were received LDI and i.v. injected with cisplatin-packaging MPs. Tumor volumes were measured and calculated every day. Data are representative of three independent experiments, and error bars represent means ± SEM, n = 8, N.S., not statistically significant. BALB/c mice, pre-inoculated with H22 tumor cells, were received LDI and i.v. injected with cisplatin-packaging MPs. Meanwhile, a treatment group was treated with CD3 antibody at 4-d intervals before and after tumor inoculation. Tumor volumes were measured and calculated every day. Data are representative of three independent experiments, and error bars represent means ± SEM, n = 6, #p < 0.05, ##p < 0.01, CD3 depletion group compared with LDI + Cisplatin-MPs group. (C) Similar setting as in B but treated with CD4, −CD8 antibody. Tumor volumes were measured and calculated every day. Data are representative of three independent experiments, and error bars represent means ± SEM, n = 6, #p < 0.05, ##p < 0.01, CD4, CD8 depletion group compared with LDI + Cisplatin-MPs group. (D) BALB/c mice were pre-inoculated with 2 × 10⁵ H22 tumor cells. When the tumor reached 8 × 8 mm, mice were received LDI or i.v. injected with cisplatin-packaging MPs alone or combination treatment. Leukocytes in the tumor tissues (up) and spleen (down) were isolated in each groups, and the number of infiltrating CD3+ T cells was analyzed by flow cytometry. Data are representative of three independent experiments, and error bars represent means ± SEM, #p < 0.05, LDI + Cisplatin-MPs group compared with other groups. (E) Analysis of IFNγ expression of tumor-infiltrating leukocytes (up) and splenocytes (down) using flow cytometry (left) and ELISA kit (right); data are representative of three independent experiments, and error bars represent means ± SEM, #p < 0.05, LDI + Cisplatin-MPs group compared with other groups.
Macrophages are required for the antitumor T cell immunity by Cis-MPs and LDI
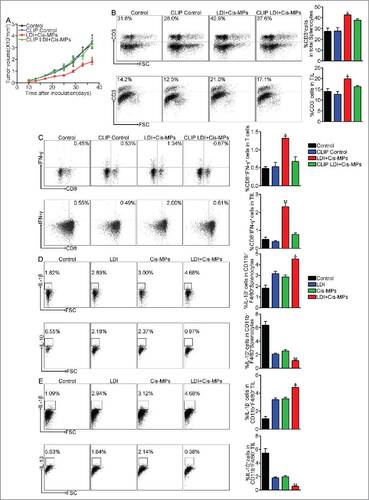
Various innate immune cells are involved in tumor-specific T cell activation. Although dendritic cells as professional antigen-presenting cells play critical roles in T cell priming, macrophages are also crucial in mediating T cell immunity. In addition to their large number, macrophages have the ability to support vascular normalization, improve T cell recruitment and promote Th1 responses after differentiation into M1 phenotype.Citation22 Here, we further tested whether macrophages were required for the combined treatment of Cis-MPs and LDI. To this end, we used clodronate liposomes, a wide used approach, to deplete macrophages. We found that the depletion of macrophages abrogated the antitumor effect of Cis-MPs and LDI (). In line with the loss of antitumor effect, macrophage depletion resulted in less CD3+ T cell infiltration into tumor mass and the expression of IFNγ was downregulated in tumor-infiltrating T cells as well as splenic T cells (), suggesting that the induced antitumor T cell immunity by the combination of drug-MPs and LDI is through a macrophage-dependent pathway. In line with this notion, we found that the combined treatment decreased the proportion of CD11b+F4/80+IL-10+ but increased the proportion of CD11b+F4/80+IL-1β+ macrophages in tumor mass (). The former was more like a suppressive subset due to the IL-10 production and the latter with IL-1β was more like an inflammatory subset. To better understand the significance of the polarization and function of macrophages by drug-MPs/LDI in tumor microenvironment, we used CSF-1R antibody to treat mice at 4-d intervals before and after tumor inoculation. Compared to the drug-MPs/LDI treatment, CFS-1R blockade also showed significant tumor repression (Fig. S5A). Consistently, anti-CSF-1R enhanced M1 macrophages, as evidenced by IL-1β increase and IL-10 decrease in CD11b+F4/80+ macrophages from both TILs and the spleen of the treated mice (Fig. S5B and S5C). In parallel, anti-CSF-1R resulted in the more CD3 infiltration in TILs as well as more IFNγ+ CD8+ T cells in TILs and the spleen (Fig. S5D and S5E). Together, these data suggest that combining drug-MPs and LDI might remodel the function of macrophages in tumor microenvironment, thus leading to enhancing antitumor T cell immunity.
Figure 3. Macrophages are required for the antitumor T cell immunity by Cis-MPs and LDI. (A) BALB/c mice, pre-inoculated with H22 tumor cells, were received LDI and i.v. injected with cisplatin-packaging MPs. Meanwhile, a treatment group was treated with clodronate liposomes at 4-d intervals before and after tumor inoculation. Tumor volumes were measured and calculated every day. Data are representative of three independent experiments, and error bars represent means ± SEM, n = 6, #p < 0.05, LDI + Cisplatin-MPs group compared with other groups. (B) Leukocytes in the above spleen (up) and tumor tissues (down) were isolated in each groups, and the number of infiltrating CD3+ T cells was analyzed by flow cytometry. Data are representative of three independent experiments, and error bars represent means ± SEM, #p < 0.05, LDI + Cisplatin-MPs group compared with other groups. (C) Analysis of IFNγ expression of splenocytes (up) and tumor-infiltrating leukocytes (down) using flow cytometry. Data are representative of three independent experiments, and error bars represent means ± SEM, #p < 0.05, ##p < 0.01, LDI + Cisplatin-MPs group compared with other groups. (D) BALB/c mice were pre-inoculated with 2 × 10⁵ H22 tumor cells. When the tumor reached 8 × 8 mm, mice were received LDI or i.v. injected with cisplatin-packaging MPs alone or combination treatment. Leukocytes in the spleen were isolated in each groups, and the number of CD11b+F4/80+IL-1β+ (up) and CD11b+F4/80+IL-10+ (down) cells were analyzed by flow cytometry. Data are representative of three independent experiments, and error bars represent means ± SEM, #p < 0.05, ##p < 0.01, LDI + Cisplatin-MPs group compared with other groups. (E) Similar setting as in D but the tumor-infiltrating leukocytes were isolated from tumor tissues, and the number of CD11b+F4/80+IL-1β+ (up) and CD11b+F4/80+IL-10+ (down) cells were analyzed by flow cytometry. Data are representative of three independent experiments, and error bars represent means ± SEM, #p < 0.05, ##p < 0.01, LDI + Cisplatin-MPs group compared with other groups.
Macrophages remodel tumor microenvironment after the combined treatment with Cis-MPs and LDI
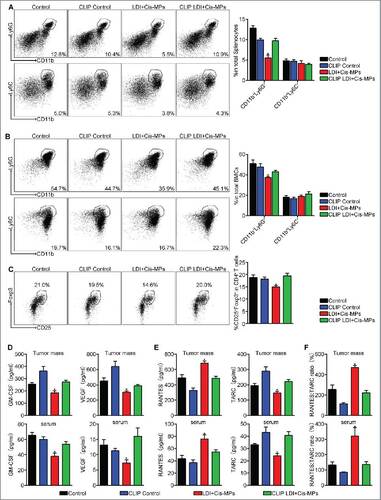
Tumor development is profoundly influenced by its immune microenvironment. An immunosuppressive microenvironment can favor tumor cell growth and metastasis. MDSCs and Treg cells have been known as two major immunosuppressive cell types in tumor microenvironment that suppress antitumor T cell immunity.Citation23 In addition, macrophages in tumor microenvironment can be reset to become tumor-associated macrophages (TAM) that are also conferred with an immunosuppressive function.Citation24 Notably, MDSCs, Treg cells and TAMs may interact with each other and form an immunosuppressive triangle in tumor microenvironment.Citation25 Notwithstanding this triangle relationship, a strategy might be provided by re-setting TAMs to break this immunosuppressive chain. When we analyzed MDSCs and Treg cells in tumor microenvironment after the combined drug-MPs and LDI treatment, a significant decrease of CD11b+Ly-6G+ granulocytic but not CD11b+Ly-6C+ monocytic MDSCs () and CD4+CD25+Foxp3+ Treg cells () were found. However, this decrease was abrogated by the depletion of macrophages in the above tumor-bearing mice (), suggesting that the combined treatment confers macrophages with the ability to negatively regulate MDSCs and Treg cells. Besides immune cell type alteration, various cytokines are also involved in remodeling of tumor microenvironment. For instance, VEGF and GM-CSF can drive the formation of aberrant vessel phenotype and recruitment of immunosuppressive MDSCs to tumor microenvironment.Citation26 We found that the combined treatment resulted in the downregulation of the expression of VEGF and GM-CSF in tumor tissues and the peripheral blood of the mice, which, however, was abrogated by macrophage depletion (). In addition to VEGF and GM-CSF, we also accessed the major Th1 chemokine RANTESCitation27 and the major Th2 chemokine TARC or CCL1728 in the tumor microenvironment. The increased expression of RANTES and decreased expression of TARC were observed after the combined treatment (). As expected, this Th1 bias was abrogated by macrophage depletion (). Together, these data suggest that the combination of LDI with Cis-MPs may remodel tumor microenvironment in a macrophage dependent manner, leading to improve antitumor immune responses.
Figure 4. Macrophages remodel tumor microenvironment after the combined treatment with Cis-MPs and LDI. (A–C) BALB/c mice, pre-inoculated with H22 tumor cells, were received LDI and i.v. injected with cisplatin-packaging MPs. Meanwhile, a treatment group was treated with clodronate liposomes at 4-d intervals before and after tumor inoculation. The splenocytes and bone marrow cells were harvested from H22 tumor-bearing mice and analyzed by flow cytometry. Data are representative of three independent experiments, and error bars represent means ± SEM, #p < 0.05, LDI + Cisplatin-MPs group compared with other groups. (D) Tumor mass lysates (up) and serum (down) in the above animals were isolated and GM-CSF (left) and VEGF (right) expression were analyzed using ELISA kit. Data are representative of three independent experiments, and error bars represent means ± SEM, #p < 0.05, LDI + Cisplatin-MPs group compared with other groups. (E) Expression of RANTES (left) and TARC (right) of tumor mass lysates (up) and serum (down) was analyzed by ELISA kit. Data are representative of three independent experiments, and error bars represent means ± SEM, #p < 0.05, LDI + Cisplatin-MPs group compared with other groups. (F) Ratio of RANTES/TARC in tumor mass lysates (up) and serum (down) were calculated. Data are representative of three independent experiments, and error bars represent means ± SEM, #p < 0.05, LDI + Cisplatin-MPs group compared with other groups.
Remodeling macrophages by combined LDI and Cis-MPs is explained by their disrupting tumor-repopulating cells
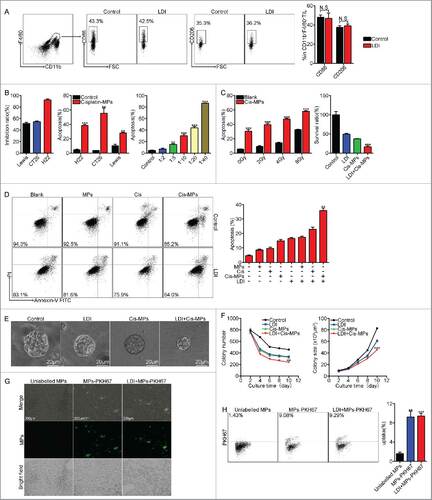
Next, we begged the question how the combined treatment remodeled macrophages' function in tumor microenvironment. LDI has been shown to promote M1 type macrophages in tumor models.Citation22 In our settings, we did not find the effect of LDI on macrophage phenotype in tumor microenvironment (), suggesting that the combination of drug-MPs and LDI probably uses indirect means to reset TAMs. Previously, we have shown that drug-packaging MPs can enter and induce tumor cell apoptosis.Citation15 Here, we also found that Cis-MPs were cytotoxic to H22, CT26 and Lewis lung cancer cells (), which, however, was enhanced by LDI (). We found that irradiation by 2 Gy twice had minimal effect on tumor cell apoptosis, but significantly enhanced the killing effect of Cis-MPs on tumor cells (). Relative to differentiated tumor cells, drug-packaging T-MPs are more partial to attacking stem-like TRCs as they are softer than differentiated tumor cells and easier to deform when taking up T-MPs.Citation17 These TRCs were generated by the previously reported soft 3D fibrin gel method.Citation5 About 1,250 tumor cells were mixed with 125 μL fibrinogen solution (2 mg/mL fibrinogen, activated by 0.5 units of thrombin) and seeded on 24-well plate. Adapting this method, we found that combination of Cis-MPs and LDI more effectively disrupted different types of TRCs (H22, CT26 and Lewis) (Fig. S2A and S2B). To corroborate this result in vivo, H22 hepatocarcinoma-bearing mice were treated with Cis-MPs and LDI, and the primary H22 tumor cells isolated were seeded into soft 3D fibrin gels. Compared to single treatment, the combination of Cis-MPs and LDI significantly decreased colony number and colony size (). In line with this, we found that LDI enhanced the intracellular retention of the MP-delivered chemotherapeutic drug in TRCs (Fig. S3A and S3B). In addition, although ionizing radiation may affect vascular reactivity,Citation29 here, we did not find that LDI affected the infiltration of drug-packaging MPs into tumor mass (). Together, these data suggest that combined treatment of drug-MPs and LDI may well curtail TRCs in tumor microenvironment.
Figure 5. Combination of Cis-MPs and LDI effectively abrogates tumor-repopulating cells. (A) BALB/c mice were s.c. inoculated with 2 × 10⁵ H22 tumor cells, followed by 2 × 2 Gy irradiation treatment when tumor reached 8 × 8 mm. Macrophages were analyzed for cell-surface expression of the indicated molecules 24 h later by flow cytometry. Data are representative of three independent experiments, and error bars represent means ± SEM, N.S., not statistically significant. (B) H22, CT26 and Lewis cell lines were incubated with Cisplatin, Cisplatin-MPs and different concentrations of Cisplatin-MPs, respectively. Apoptosis of tumor cells was analyzed by flow cytometry. Data are representative of three independent experiments, and error bars represent means ± SEM, ##p < 0.01, ###p < 0.001, compared with control. (C) H22 cell lines were irradiated with different dose, apoptosis of tumor cells was analyzed by flow cytometry, data are representative of three independent experiments, and error bars represent means ± SEM, ###p < 0.001, compared with control. H22 cell lines were incubated with Cisplatin-MPs after irradiated with 4 Gy, survival ratio of tumor cells was detected by CCK-8, data are representative of three independent experiments, and error bars represent means ± SEM, ###p < 0.001, LDI + Cisplatin-MPs group compared with other groups. (D) H22 cell lines were irradiated with 4 Gy, then incubated with Cisplatin, MPs and Cisplatin-MPs, respectively, apoptosis of tumor cells was analyzed by flow cytometry. Data are representative of three independent experiments, and error bars represent means ± SEM, ##p < 0.01, LDI + Cisplatin-MPs group compared with other groups. (E) Single H22 cell purified from tumor-bearing mice grew into a multicellular tumor spheroid in 3D fibrin on day 10. Scale bar, 20 μm. (F) Colony number (left) and the colony size (right) of TRCs derived from tumor-bearing mice were measured. Data are representative of three independent experiments, and error bars represent means ± SEM, ##p < 0.01, ###p < 0.001, LDI + Cisplatin-MPs group compared with other groups. (G) PKH67 (Green)-conjugated MPs were i.v. injected to H22 subcutaneous tumor-bearing mice alone or in combination with LDI treatment, 4 h later, tumor tissues were used for the analysis by fluorescence microscope. Scale bar, 200 μm. (H) Ten thousand isolated tumor cells were collected for flow cytometric analysis of PKH67-positive population. Data are representative of three independent experiments, and error bars represent means ± SEM, ##p < 0.01, ###p < 0.001, unlabelled MPs group compared with other groups.
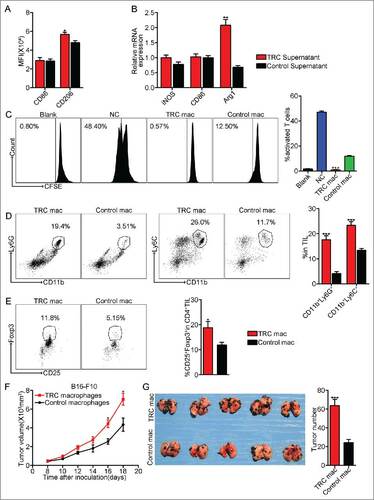
TRCs have a stronger ability to induce TAMs, compared with differentiated tumor cells. When TRC-derived supernatants were used to culture macrophages, it was found that compared with the supernatants from tumor cells in rigid plastic, TRC-educated macrophages expressed higher M2 phenotype markers such as CD206 and arginase 1 (). Moreover, these TRC-educated macrophages showed stronger ability to suppress T cell activation and proliferation, compared with the control (), indicating that TRCs indeed have stronger ability to reset macrophages into M2 phenotype. When to further evaluate the effect of these educated macrophages on tumor microenvironment, we injected TRC-configured macrophages into tumor mass, 3 d later, immunosuppressive cell types MDSCs and Treg cells were significantly increased in tumor microenvironment (). In addition, when TRC-configured macrophages were incubated with B16-F10 cells for 24 h, and then subcutaneously or intravenously injected the tumor cells into mice, we found that TRC-configured macrophages significantly promoted subcutaneous melanoma growth and lung metastasis (), suggesting that TRC-configured macrophages have direct tumor-promoting effect. On the other hand, we tried to confirm TRCs as the main factor that resets TAMs. We inoculated BALB/c mice with H22 tumor cells, followed by LDI and cisplatin-MPs. 20 d later, H22 TRCs (1 × 10⁵) or control tumor cells were injected into tumor mass. We found that although drug-MPs/LDI abrogated TRCs, the replenishment of TRCs promoted tumor growth (Fig. S6A). Consistently, the increase of TRCs resulted in more M2 macrophages (more CD11b+F4/80+IL-10+ cells) in TILs and the spleen (Fig. S6B and S6C). In parallel, less CD3 T cells and IFNγ+ CD8+ T cells in TILs and the spleen (Fig. S6D and S6E). Based on these data, we proposed that resetting of macrophages by TRCs could be a pivotal pathway for the formation of M2 tumor-promoting macrophages and the effective killing of TRCs by the combined Cis-MPs and LDI can block this suboptimum pathway, leading to a domination of tumor immunity-promoting macrophages in tumor microenvironments.
Figure 6. TRCs as a major player to polarize M2 type tumor-promoting macrophages. (A) Macrophages were incubated with the supernatants from TRCs or control tumor cells. Macrophages were analyzed for cell-surface expression of the indicated molecules 24 h later by flow cytometry and presented as the MFI. Data are representative of three independent experiments, and error bars represent means ± SEM, #p < 0.05. (B) iNOS, CD86 and Arg1 mRNAs were assessed by real-time PCR, respectively. Data are representative of three independent experiments, and error bars represent means ± SEM, ##p < 0.01. (C) Splenic T cells purified from WT mice were incubated with the above macrophages. T-cell proliferation was examined by CFSE dilution assay. Data are representative of three independent experiments, and error bars represent means ± SEM, ###p < 0.001, macrophages were incubated with TRCs supernatants group compared with control group. (D–E) C57BL/6 mice, pre-inoculated with B16-F10 tumor cells, were injected the above macrophages into tumor mass. Three days later, tumor-infiltrating leukocytes were isolated from tumor tissues in each groups and analyzed by flow cytometry. Data are representative of three independent experiments, and error bars represent means ± SEM, #p < 0.05, ###p < 0.001. (F) B16-F10 cell lines were incubated with the above macrophages for 24 h, then the B16-F10 cells were injected via s.c. into C57BL/6 mice. Tumor volumes were measured and calculated every day. Data are representative of three independent experiments, and error bars represent means ± SEM, n = 7, #p < 0.05. (G) Similar setting as in F but challenge with 1 × 10⁵ B16-F10 tumor cells through tail vein. Twenty-one days later, the mice were killed, and the black melanoma nodules on the lungs were measured and calculated. Data are representative of three independent experiments, and error bars represent means ± SEM, n = 6, ###p < 0.001.
Discussion
Despite their inherent tumor-killing machinery, mounting evidence has shown that a large number of macrophages accumulate in tumor microenvironments where they alter their intrinsic molecular programs to profoundly promote tumor development by mediating tumor immune evasion, promoting angiogenesis, tumor cell growth and metastasis.Citation24 Currently, depletion-based strategies are being developed to clear macrophages from tumor microenvironment. However, a better strategy of targeting TAMs lies in not killing but switching their function of macrophages from tumor-promoting to tumor-inhibiting. The present study provides evidence that tumor-promoting macrophages can be induced by stem-like TRCs, while a combination of drug-packaging MPs and LDI efficiently curtails effects of TRCs, leading to restoration of the tumor-inhibiting properties of macrophages in tumor microenvironment and thereby enhancing T cell-mediated tumor cell killing.
The relationship found among TRCs, T-MPs and macrophages is complex. Cytoskeletal alteration is a key event that triggers the formation of MPs through cellular membrane bubbling and shedding.Citation30 Many signals are capable of inducing cytoskeletal alteration, including TLR4 signaling, commonly existed in the tumor microenvironment, that can be transduced to cellular cytoskeletons of tumor cells, leading to their releasing MPs.Citation31 In addition, hypoxia, nutrient deficiency and apoptotic signals also induce tumor cells to produce MPs in tumor microenvironment. In practice, both chemotherapy and radiotherapy cause abundant tumor cell death, leading to their releasing MPs. Therefore, the existence of T-MPs should be made universal in tumor microenvironment. And significant pathophysiology of T-MPs lies in that they can act as a general mechanism to educate macrophages into M2-type TAMs, leading to tumor growth, metastasis as well as stem-like TRC development.Citation32 Such TRCs, in turn, as shown in this study, effectively reset macrophages into M2-type TAMs. Our previous study showed that tumor-infiltrating mast cells can mobilize MDSCs and Treg cells to tumor sites.Citation33 Here, we further found that TRC-configured macrophages efficiently recruit MDSCs and Treg cells in tumor microenvironment and significantly promote tumor growth and metastasis (). Thus, in addition to mast cells, MDSCs and Treg cells that form an immunosuppressive triangle, TRCs, TAMs and T-MPs may also form a vicious cycle that promotes tumor progression. Curtailment of this cycle undoubtedly results in the antitumor effect. Softness might be a typical feature for TRCs, compared with differentiated tumor cells that are physically stiff. However, this softness can be used by T-MPs to target TRCs. That is, it is easier for deformable TRCs to take up drug-packaging MPs. In turn, these MPs enter lysosomes and initiate the lysosome-mediated transport of drugs to the nucleus, leading to efficacious killing of TRCs. Intriguingly, this study found that killing of TRCs by drug-packaging MPs can be further enhanced by LDI. Macrophages as professional phagocytes are capable of effectively taking up drug-packaging MPs via phagocytosis. Although tumor cell-derived MPs (T-MPs) markedly polarize macrophages toward M2 phenotype,Citation32 we found in another study that drug-packaging MPs, intriguingly, are able to reverse this process by polarizing M2 macrophages to M1, thus facilitating antitumor microenvironment remodeling. In addition, unlike tumor cells, macrophages as terminally differentiated cell type, are resistant to drugs, leading to a very small population of macrophages undergoing death by those drug-packaging MPs. Currently, how drug-packaging MPs regulate the antitumor microenvironment by directly targeting macrophages is under study. Besides macrophages, we also found that combination of drug-packaging MPs and LDI enhances tumor antigen cross-presentation by DCs (Fig. S4), which probably also explain the improved antitumor efficacy of combined treatment of drug-MPs and LDI.
Radiotherapy possesses the potential capacity to enhance antitumor immunity. Recent data from different cancer models have shown that ionizing radiation can contribute to systemic antitumor immunity.Citation34 Radiotherapy may cause the release of tumor antigens from dying tumor cells, facilitating tumor antigen presentation and tumor-specific T cell activation.Citation35 Radiotherapy has also been shown to enhance the expression of MHC I,Citation36 costimulatory molecules,Citation37 adhesion molecules,Citation38 NKG2D ligandsCitation39 and FASCitation40 in tumor cells. However, it should be noted that radiotherapy can also promote immunosuppression. In fact, radiotherapy has originally been thought to be immunosuppressive due to its ablating immune cells following total body irradiation. It has been reported that Treg cells and TAMs both can be enhanced following radiotherapy.Citation41-42 The dosage of radiotherapy might be a key factor in the reconciliation of this apparent contradiction.Citation29 LDI has been shown to program macrophage differentiation into an iNOS+/M1 phenotype, leading to normalization of tumor vasculature and facilitation of immune cell entry into tumor sites.Citation22 In the present study, we explore whether LDI can be combined with drug-packaging MPs to generate a better antitumor outcome. Although treatment by either drug-packaging MPs or LDI alone delays the tumor growth, the combination markedly increases the treatment efficiency and significantly prolongs the overall survival of the tumor-bearing mice. It should be not surprising that LDI is incapable of killing tumor cells, especially for TRCs directly. However, in this study we found that LDI enhances the intracellular retention of chemotherapeutic drugs in TRCs delivered by T-MPs thus actually facilitating the killing of TRCs. This might be explained by that LDI impairs the ability of TRCs either to pump drugs out or to detoxify them via biotransformation. Whether LDI uses other mechanism(s) to enhance drug-packaging MP-mediated killing of TRCs is worthy of further investigation.
Identification of such a combined therapy of drug-packaging MPs and LDI may be very significant for current cancer immunotherapy. In clinical practice, neither adoptive T cell therapy nor check point blockade therapy or oncolytic virotherapy are efficient to attack TRCs. Thus, TRCs' immune evasion may lead to treatment failure. Currently reported tumor recurrence after PD-1 antibody treatment in certain melanoma and lung cancer patients might be explained by TRCs escaping immunotherapy.Citation43 On the other hand, the efficacy and efficiency of T cell-based immunotherapy are mainly dependent on the tumor microenvironment, in which macrophages play crucial roles.Citation44 Given their central regulation of immunosuppression, cancer stem cell development, angiogenesis and drug resistance, different strategies to target macrophages have being developed, including (1) inhibition of macrophage recruitment by blocking CCL2 or CSF1/CSF1R signaling; (2) pharmacological depletion of macrophages through the administration of bisphosphonates or liposomal encapsulated clodronate; (3) reprogramming macrophages from M2 to M1 like phenotype by the intravesical instillation of Mycobacterium bovis (bacillus Calmette-Guèrin), which stimulates the cytotoxic activity of macrophages to treat superficial bladder cancer. In addition, a broad variety of nanoparticle systems (NPs) has been developed with the aim of delivering drugs to solid tumors.Citation45 Considering their ability to capture NPs, using NPs to package siRNAs or other active molecules is another promising way to target TAMs. Compared to the above strategies, the combination of drug-packaging MPs and LDI targeting TAMs possesses several advantages, including (1) this combined therapy represents a patient-friendly approach with high safety; (2) targeting TRCs not just re-programs macrophage differentiation to a M1-like phenotype but also benefits DCs and T cells; and (3) the preparation of tumor cell-derived, drug-packaging MPs is simple, facilitating their applicability. In line with these merits, we observed in this study that more CD3+ T cells are recruited to tumor mass with increased IFNγ expression, while immunosuppressive cells, such as MDSCs and Treg cells are reduced in line with the decreased VEGF and GM-CSF levels in tumor microenvironment. Moreover, the combined treatment also results in splenic T cells upregulating IFNγ expression, suggesting that systemic antitumor immune responses are generated. Besides directly killing tumor cells, drug-MPs and LDI uses indirect means to re-educate TAMs, leading to remodeling of immunosuppressive tumor microenvironment and activation of antitumor response.
In summary, this study shows that combination of drug-packaging, tumor cell-derived MPs with LDI, by virtue of their distinctive biophysical features, can effectively curtail TRCs, thus relieving TRC-mediated suppressive configuration of tumor-infiltrating macrophages. The resultant M1-like macrophages remodel tumor microenvironment by decreasing immunosuppressive cells and increasing T cell infiltration, leading to effective antitumor T cell immunity. Our present study provides a novel strategy to reprogram polarized macrophages from tumor-promoting to tumor-inhibiting with potential clinical applications.
Materials and methods
Mice and cell lines
Female BALB/c and C57BL/6 mice, 6- to 8-week-old, were purchased from Center of Medical Experimental Animals of Hubei Province (Wuhan, China) for studies approved by the Animal Care and Use Committee of Tongji Medical College. Murine cell lines H22 hepatocarcinoma, CT26 colon carcinoma and Lewis lung carcinoma tumor cell lines were purchased from China Center for Type Culture Collection (CCTCC, Wuhan, China), and cultured according to the manufacturer's guidelines. All cell lines were tested and determined to be free of Mycoplasma and other rodent pathogens by the CCTCC; no other authentication assay was performed.
Irradiation
Mice were immobilized by using a shielded restrainer, which allowed the tumors to be exposed while sparing the areas surrounding the tumor. Irradiation was delivered using γ radiation therapy by Precise Treatment (EKAKTA, England) at a dose rate of about 500 cGy/min at room temperature. The dose was calibrated by Farmer 2,570 every week. The aperture of the source was opened to the minimal level required to expose the entire tumor.
Generation and isolation of MPs
Tumor cells were exposed to ultraviolet radiation (300 J/m2) for 1 h, and then treated with chemotherapeutic drug cisplatin or doxorubicin. After 18–20 h, supernatants were used for MPs isolation as described previously.Citation15 Briefly, supernatants were centrifuged at 1,300 rpm for 10 min to remove whole cells and then centrifuged at 5,000 rpm for 10 min and 14,000 g for 2 min to remove debris. The supernatants were further centrifuged at 14,000 g for 60 min to pellet MPs. The MPs were washed three times and suspended in culture medium for the following experiments.
Animal model and treatment
Animal model
For the H22 or CT26 tumor models, BALB/c mice were challenged with H22 or CT26 tumor cells (3 × 10⁵ cells/mouse) in the right flank. Palpable tumors were measured by calipers, and tumor volume was calculated according to the formula: volume = (length × widthCitation2)/2, where length and width are measured in millimeters. For the Lewis or B16-F10 tumor model, C57BL/6 mice were received s.c. injection of 3 × 10⁵ Lewis or B16–10 tumor cells. In the metastasis model, C57BL/6 mice were i.v injected with 1 × 10⁵ B16-F10 melanoma cells, and 21 d later, mice were killed and the black melanoma nodules on the lungs were assayed.
For the immune-deficient model, nude mice were challenged with H22 tumor cells. In lymphocyte-depletion experiments, mice were injected i.p. with 0.1 mg anti-CD3 (clone 145–2C11), anti-CD4+ (clone GK1.5), anti-CD8+ (clone 53–6.7), anti-CSF-1R (clone AFS98) or Clodronate Liposomes at 4-d intervals before and after tumor inoculation. Tumor size was measured every day with calipers once tumors became palpable. Flow cytometric analysis confirmed greater than 95% depletion of specific-lymphocyte populations.
Therapeutic setting
Tumors were established in mice by s.c. injection of 3 × 10⁵ H22, CT26 or Lewis tumor cells in the right flank. Nine days after tumor inoculation, mice were received twice 2 Gy LDI treatment (once per 3 d), and then intravenously injected with cisplatin-packaging MPs (Cis-MPs) four times (once per 3 d), each i.v. injected with cisplatin-packaging MPs was performed 24 h after LDI. Control mice received PBS and non-irradiation. C57BL/6 mice carrying subcutaneous B16-F10 tumors or metastases were treated similarly.
Culture of mouse bone marrow-derived macrophages
Bone marrow cells isolated from femurs of mice were cultured for 5 d in the presence of 20 ng/mL recombinant mouse macrophage colony-stimulating factor (M-CSF, PeproTech) in complete RPMI-1640 medium containing 10% fetal bovine serum (FBS), 10 mM glucose, 2 mM L-glutamine, 1 mM HEPES and 100 U/mL penicillin-streptomycin. On day 6, M0 macrophages were harvested and then stimulated for the following experiment.
Flow cytometric analysis
To examine tumor infiltrating leukocytes (TIL) and splenocytes, cells were isolated and stained with antibodies against anti-mouse CD3 (clone 17A2). For phenotypic analysis of macrophages and myeloid-derived suppressor cells (MDSCs), cells were stained with surface antibodies: CD11b (clone M1/70), F4/80 (clone BM8), CD86 (clone GL1), CD206 (clone MR6F3), Ly6G (clone RB6–8C5) and Ly6C (clone HK1.4).
For intracellular cytokine staining, lymphocytes prepared from spleen or tumor mass were restimulated with phorbol 12-myristate 13-acetate (PMA; 50 ng/mL) and ionomycin (1 μg/mL; Sigma-Aldrich) in the presence of Brefeldin A (1 μg/mL; eBioscience) for 4 h, and then stained with CD3 (clone 145–2C11) and CD8 (clone 53–6.7) antibodies. After surface staining, cells were treated with Fix/Perm solution and restained with IFNγ (clone XMG1.2) antibody. In some cases, TILs or splenocytes were stained with CD11b and F4/80 antibodies and then restained with IL-1β (clone NJTEN3) or IL-10 (clone JES5–16E3) antibody.
For Treg analysis, splenocytes were stained with CD4 (clone GK1.5) and CD25 (clone PC61.5) antibodies and then restained with Foxp3 (clone FJK-16s) antibody. All antibodies were purchased from eBioscience, and Flow cytometric analysis was performed with Accuri C6.
Tumor mass lysates
Tumor mass lysates were prepared from tumor tissues obtained from resected tumors. A portion of the tumor tissues (1 cm3) was frozen in liquid nitrogen for 20 min, and then thawed at room temperature for 20 min. The freeze-thaw cycle was repeated two times. Then, the tumor tissues were stirred and centrifuged at 2,000 g for 10 min to remove cellular debris, and supernatants were collected through a 0.2 μm filter.
In vitro cytokine secretion assay
TILs and splenocytes were isolated and cultured in the presence of PMA and ionomycin for 6 h. IFNγ in the supernatants was assessed by the Mouse mini ELISA Kit (PeproTech) according to the manufacturer's protocol. GM-CSF, VEGF, RANTES and TARC in tumor mass lysates and serum were measured with the mouse ELISA kit (eBioscience).
Cytotoxicity assay of drug-packaging MPs
Drug-packaging MPs were prepared and added to the cultured tumor cells. The cells were observed under a microscope at different time points. In some cases, cells were collected and stained with Annexin V and Propidium iodide for apoptosis detection by a flow cytometer.
3D fibrin gel culture of tumor cells
Salmon fibrinogen and thrombin were purchased from Searun Holdings. Detailed methods are described as previously.Citation5 Tumor cells were detached from the standard culture conditions and suspended in culture medium (10% FBS) and cell density was adjusted to 104 cells/mL. Fibrinogen was diluted into 2 mg/mL with T7 buffer (pH 7.4, 50 mM Tris, 150 mM NaCl). 1:1 fibrinogen and cell solution mixture was made, resulting in 1 mg/mL fibrinogen and 5,000 cells/mL in the mixture. 250 μL cell/fibrinogen mixtures were seeded into each well of 24-well plate and mixed well with pre-added 5 μL thrombin (0.1 U/μL) for culture under 37 °C condition.
Labeling of MPs and Fluorescence microscope
Isolated H22-MPs were labeled with a green fluorescent cell linker (PKH67; Sigma-Aldrich), according to the manufacturer's protocol, and visualized by fluorescent microscopy (LEICA DMI 6000B; Leica).
T-cell proliferation assay
Splenic T cells were purified from WT mice by CD3-positive selection, and then fluorescently labeled with 5 mmol/L carboxyfluorescein diacetate succinimidyl ester (CFSE) (Sigma-Aldrich). Supernatants derived from TRC or control tumor cell were used to culture macrophages. 24 h later, discarded the supernatants and added fresh medium for additional 4 h culture. Then, supernatants derived from macrophages were harvested and incubated with CFSE-labeled T cells in the presence of anti-CD3 (clone 145–2C11) and anti-CD28 (clone 37.51) for 24 h.
Real-time quantitative PCR
Total RNA extracted from cells with TRIzol reagent (Invitrogen) was used for real-time quantitative PCR. Total RNA (1 μg) was reverse-transcribed into cDNA using the ReverTra Ace qPCR RT Kit (Toyobo). Real-time PCR was performed using Fast SYBR Green PCR master mix (TOYOBO) on a CFX96 Touch real-time PCR detection system (Bio-rad). The mRNA levels were normalized to β-actin.
The primer sequences were as follows: mouse β-actin, sense 5′– TTCCTTCTTGGGTATGGAATCCT −3′, antisense 5′– CACTGTGTTGGCATAGAGGTC −3′; mouse Arg1, sense 5′– CAAGACAGGGCTCCTTTCAG −3′, antisense 5′– TGGCTTATGGTTACCCTCCC −3′; mouse iNOS, sense 5′– GATGTTGAACTATGTCCTATCTCC −3′, antisense 5′– GAACACCACTTTCACCAAGAC −3′; mouse CD86, sense 5′– ACGTATTGGAAGGAGATTACAGCT −3′, antisense 5′– TCTGTCAGCGTTACTATCCCGC −3′.
Generation of bone marrow-derived DCs
Bone marrow cells were harvested from femurs of mice and cultured in RPMI 1640 supplemented with 10% FBS, 2 mmol/L L-glutamine, 1 mmol/L sodium pyruvate, 1 mmol/L HEPES, 50 mmol/L 2-ME, 100 U/mL penicillin, and 100 mg/mL streptomycin. The cells were cultured in six-well plates with 20 ng/mL GM-CSF (PeproTech) and 20 ng/mL IL4 (PeproTech), and cytokines were replenished on days 3 and 5, non-adherent cells were harvested for experiments.
Statistics analysis
Results were expressed as mean values ± SEM and interpreted by repeated-measure analysis of variance. Differences were considered to be statistically significant when the p value was < 0.05.
Disclosure of potential conflicts of interest
B.H. was supported by Soundny (Sheng-Qi-An) Biotech. The other authors declare no competing financial interests.
Supplementary_Figure1-6.docx
Download MS Word (1.5 MB)Funding
This work was supported by CAMS Initiative for Innovative Medicine (2016-I2M-1–007), National Basic Research Program of China (2014CB542103) and National Natural Science Foundation of China (81661128007, 81472653, 81530080).
References
- Pardoll DM. The blockade of immune checkpoints in cancer immunotherapy. Nat Rev Cancer 2012; 12:252-64; PMID:22437870; https://doi.org/https://doi.org/10.1038/nrc3239
- Lichty BD, Breitbach CJ, Stojdl DF, Bell JC. Going viral with cancer immunotherapy. Nat Rev Cancer 2014; 14:559-67; PMID:24990523; https://doi.org/https://doi.org/10.1038/nrc3770
- Brentjens RJ, Davila ML, Riviere I, Park J, Wang X, Cowell LG, Bartido S, Stefanski J, Taylor C, Olszewska M et al. CD19-targeted T cells rapidly induce molecular remissions in adults with chemotherapy-refractory acute lymphoblastic leukemia. Sci Transl Med 2013; 5:177ra38; PMID:23515080; https://doi.org/https://doi.org/10.1126/scitranslmed.3005930
- Lizee G, Overwijk WW, Radvanyi L, Gao J, Sharma P, Hwu P. Harnessing the power of the immune system to target cancer. Annu Rev Med 2013; 64:71-90; PMID:23092383; https://doi.org/https://doi.org/10.1146/annurev-med-112311-083918
- Liu J, Tan Y, Zhang H, Zhang Y, Xu P, Chen J, Poh YC, Tang K, Wang N, Huang B. Soft fibrin gels promote selection and growth of tumorigenic cells. Nat Mater 2012; 11:734-41; PMID:22751180; https://doi.org/https://doi.org/10.1038/nmat3361
- Li Y, Luo S, Ma R, Liu J, Xu P, Zhang H, Tang K, Ma J, Zhang Y, Liang X et al. Upregulation of cytosolic phosphoenolpyruvate carboxykinase is a critical metabolic event in melanoma cells that repopulate tumors. Cancer Res 2015; 75:1191-6; PMID:25712344; https://doi.org/https://doi.org/10.1158/0008-5472.CAN-14-2615
- Tan Y, Tajik A, Chen J, Jia Q, Chowdhury F, Wang L, Chen J, Zhang S, Hong Y, Yi H et al. Matrix softness regulates plasticity of tumour-repopulating cells via H3K9 demethylation and Sox2 expression. Nat Commun 2014; 5:4619; PMID:25099074; https://doi.org/https://doi.org/10.1038/ncomms5619
- Tang K, Hu L, Ma J, Zhang H, Zhang Y, Li Y, Ma R, Luo S, Liu D, Long G et al. Brief report: human mesenchymal stem-like cells facilitate floating tumorigenic cell growth via glutamine-ammonium cycle. Stem Cells 2015; 33:2877-84; PMID:26031226; https://doi.org/https://doi.org/10.1002/stem.2076
- Aguirre-Ghiso JA. Models, mechanisms and clinical evidence for cancer dormancy. Nat Rev Cancer 2007; 7:834-46; PMID:17957189; https://dx.do i.org/https://doi.org/10.1038/nrc2256
- Kaplan RN, Riba RD, Zacharoulis S, Bramley AH, Vincent L, Costa C, MacDonald DD, Jin DK, Shido K, Kerns SA et al. VEGFR1-positive haematopoietic bone marrow progenitors initiate the pre-metastatic niche. Nature 2005; 438:820-7; PMID:16341007; https://doi.org/https://doi.org/10.1038/nature04186
- Sceneay J, Smyth MJ, Möller A. The pre-metastatic niche: Finding common ground. Cancer Metastasis Rev 2013; 32:449-64; PMID:23636348; https://doi.org/https://doi.org/10.1007/s10555-013-9420-1
- Nassar D, Blanpain C. Cancer stem cells: Basic concepts and therapeutic. Annu Rev Pathol 2016; 11:47-76; PMID:27193450; https://doi.org/https://doi.org/10.1146/annurev-pathol-012615-044438
- Yu X, Li H, Ren X. Implications interaction between regulatory T cells and cancer stem cells. Int J Cancer 2012; 131:1491-8; PMID:22592629; https://doi.org/https://doi.org/10.1002/ijc.27634
- Ratajczak J, Wysoczynski M, Hayek F, Janowska-Wieczorek A, Ratajczak MZ. Membrane-derived microvesicles: Important and underappreciated mediators of cell-to-cell communication. Leukemia 2006; 20:1487-95; PMID:16791265; https://doi.org/https://doi.org/10.1038/sj.leu.2404296
- Tang K, Zhang Y, Zhang H, Xu P, Liu J, Ma J, Lv M, Li D, Katirai F, Shen GX et al. Delivery of chemotherapeutic drugs in tumour cell derived microparticles. Nat Commun 2012; 3:1282; PMID:23250412; https://doi.org/https://doi.org/10.1038/ncomms2282
- Ran L, Tan X, Li Y, Zhang H, Ma R, Ji T, Dong W, Tong T, Liu Y, Chen D et al. Delivery of oncolytic adenovirus into the nucleus of tumorigenic cells by tumor microparticles for virotherapy. Biomaterials 2016; 89:56-66; PMID:26950165; https://doi.org/https://doi.org/10.1016/j.biomaterials.2016.02.025
- Ma J, Zhang Y, Tang K, Zhang H, Yin X, Li Y, Xu P, Sun Y, Ma R, Ji T et al. Reversing drug resistance of soft tumor-repopulating cells by tumor cell-derived chemotherapeutic microparticles. Cell Res 2016; 26:713-27; PMID:27167569; https://doi.org/https://doi.org/10.1038/cr.2016.53
- Jin X, Ma J, Liang X, Tang K, Liu Y, Yin X, Zhang Y, Zhang H, Xu P, Chen D et al. Pre-instillation of tumor microparticles enhances intravesical chemotherapy of nonmuscle-invasive bladder cancer through a lysosomal pathway. Biomaterials 2017; 113:93-104; PMID:27810645; https://doi.org/https://doi.org/10.1016/j.biomaterials.2016.10.036
- Elvington M, Scheiber M, Yang X, Lyons K, Jacqmin D, Wadsworth C, Marshall D, Vanek K, Tomlinson S. Complement-dependent modulation of antitumor immunity following radiation therapy. Cell Rep 2014; 8:818-30; PMID:25066124; https://doi.org/https://doi.org/10.1016/j.celrep.2014.06.051
- Hellevik T, Martinez-Zubiaurre I. Radiotherapy and the tumor stroma: The importance of dose and fractionation. Front Oncol 2014; 4:1; PMID:24478982; https://doi.org/https://doi.org/10.3389/fonc.2014.00001
- Delgoffe GM. Filling the tank: Keeping antitumor T cells metabolically fit for the long Haul. Cancer Immunol Res 2016; 4:1001-1006; PMID:27908931; https://doi.org/https://doi.org/10.1158/2326-6066.CIR-16-0244
- Klug F, Prakash H, Huber PE, Seibel T, Bender N, Halama N, Pfirschke C, Voss RH, Timke C, Umansky L et al. Low-dose irradiation programs macrophage differentiation to an iNOS+/M1 phenotype that orchestrates effective T cell immunotherapy. Cancer Cell 2013; 24:589-602; PMID:24209604; https://dx. doi.org/https://doi.org/10.1016/j.ccr.2013.09.014
- Balkwill FR, Capasso M, Hagemann T. The tumor microenvironment at a glance. J Cell Sci 2012; 125:5591-6; PMID:23420197; https://doi.org/https://doi.org/10.1242/jcs.116392
- Liu Y, Cao X. The origin and function of tumor-associated macrophages. Cell Mol Immunol 2015; 12:1-4; PMID:25220733; https://doi.org/https://doi.org/10.1038/cmi.2014.83
- Gabrilovich DI, Ostrand-Rosenberg S, Bronte V. Coordinated regulation of myeloid cells by tumours. Nat Rev Immunol 2012; 12:253-68; PMID:22437938; https://doi.org/https://doi.org/10.1038/nri3175
- Bayne LJ, Beatty GL, Jhala N, Clark CE, Rhim AD, Stanger BZ, Vonderheide RH. Tumor-derived granulocyte-macrophage colony-stimulating factor regulates myeloid inflammation and T cell immunity in pancreatic cancer. Cancer Cell 2012; 2:822-35; PMID:22698406; https://doi.org/https://doi.org/10.1016/j.ccr.2012.04.025
- Islam SA, Luster AD. T cell homing to epithelial barriers in allergic disease. Nat Med 2012; 18:705-15; PMID:22561834; https://doi.org/https://doi.org/10.1038/nm.2760
- De Monte L, Reni M, Tassi E, Clavenna D, Papa I, Recalde H, Braga M, Di Carlo V, Doglioni C, Protti MP. Intratumor T helper type 2 cell infiltrate correlates with cancer-associated fibroblast thymic stromal lymphopoietin production and reduced survival in pancreatic cancer. J Exp Med 2011; 208:469-78; PMID:21339327; https://doi.org/https://doi.org/10.1084/jem.20101876
- Suvorava T, Luksha L, Bulanova KY, Lobanok LM. Dose-rate dependent effects of ionizing radiation on vascular reactivity. Radiat Prot Dosimetry 2006; 122:543-5; PMID:17132674; https://doi.org/https://doi.org/10.1093/rpd/ncl432
- Thery C, Ostrowski M, Segura E. Membrane vesicles as conveyors of immune responses. Nat Rev Immunol 2009; 9:581-593; PMID:19498381; https://doi.org/https://doi.org/10.1038/nri2567
- Li D, Jia H, Zhang H, Lv M, Liu J, Zhang Y, Huang T, Huang B. TLR4 signaling induces the release of microparticles by tumor cells that regulate inflammatory cytokine IL-6 of macrophages via microRNA let-7b. Oncoimmunology 2012; 1:687-693; PMID:22934260; https://doi.org/https://doi.org/10.4161/onci.19854
- Ma R, Ji T, Chen D, Dong W, Zhang H, Yin X, Ma J, Liang X, Zhang Y, Shen G et al. Tumor cell-derived microparticles polarize M2 tumor-associated macrophages for tumor progression. Oncoimmunology 2016; 5:e1118599; PMID:27141404; https://doi.org/https://doi.org/10.1080/2162402X.2015.1118599
- Yang Z, Zhang B, Li D, Lv M, Huang C, Shen GX, Huang B. Mast cells mobilize myeloid-derived suppressor cells and Treg cells in tumor microenvironment via IL-17 pathway in murine hepatocarcinoma model. PLoS One 2010; 5:e8922; PMID:20111717; https://doi.org/https://doi.org/10.1371/journal.pone.0008922
- Formenti SC, Demaria S. Combining radiotherapy and cancer immunotherapy: A paradigm shift. J Natl Cancer Inst 2013; 105:256-65; PMID:23291374; https://doi.org/https://doi.org/10.1093/jnci/djs629
- Tesniere A, Apetoh L, Ghiringhelli F, Joza N, Panaretakis T, Kepp O, Schlemmer F, Zitvogel L, Kroemer G. Immunogenic cancer cell death: A key-lock paradigm. Curr Opin Immunol 2008; 20:504-11; PMID:18573340; https://doi.org/https://doi.org/10.1016/j.coi.2008.05.007
- Reits EA, Hodge JW, Herberts CA, Groothuis TA, Chakraborty M, Wansley EK, Camphausen K, Luiten RM, de Ru AH, Neijssen J et al. Radiation modulates the peptide repertoire, enhances MHC class I expression, and induces successful antitumor immunotherapy. J Exp Med 2006; 203:1259-71; PMID:16636135; https://doi.org/https://doi.org/10.1084/jem.20052494
- Vereecque R, Buffenoir G, Gonzalez R, Cambier N, Hetuin D, Bauters F, Fenaux P, Quesnel B. γ-Ray irradiation induces B7.1 expression in myeloid leukaemic cells. Br J Haematol 2000; 108:825-31; PMID:10792289; https://doi.org/https://doi.org/10.1046/j.1365-2141.2000.01967.x
- Baluna RG, Eng TY, Thomas CR. Adhesion molecules in radiotherapy. Radiat Res 2006; 166:819-31; PMID:17149971; https://doi.org/https://doi.org/10.1667/RR0380.1
- Gasser S, Orsulic S, Brown EJ, Raulet DH. The DNA damage pathway regulates innate immune system ligands of the NKG2D receptor. Nature 2005; 436:1186-90; PMID:15995699; https://doi.org/https://doi.org/10.1038/nature03884
- Chakraborty M, Abrams SI, Camphausen K, Liu K, Scott T, Coleman CN, Hodge JW. Irradiation of tumor cells up-regulates Fas and enhances CTL lytic activity and CTL adoptive immunotherapy. J Immunol 2003; 170:6338-47; PMID:12794167; https://doi.org/https://doi.org/10.4049/jimmunol.170.12.6338
- Qu Y, Jin S, Zhang A, Zhang B, Shi X, Wang J, Zhao Y. Gamma-ray resistance of regulatory CD4+CD25+Foxp3+ T cells in mice. Radiat Res 2010; 173:148-57; PMID:20095846; https://doi.org/https://doi.org/10.1667/RR0978.1
- Chiang CS, Fu SY, Wang SC, Yu CF, Chen FH, Lin CM, Hong JH. Irradiation promotes an m2 macrophage phenotype in tumor hypoxia. Front Oncol 2012; 2:89; PMID:22888475; https://doi.org/https://doi.org/10.3389/fonc.2012.00089
- Zou W, Wolchok JD, Chen L. PD-L1 (B7-H1) and PD-1 pathway blockade for cancer therapy: Mechanisms, response biomarkers, and combinations. Sci Transl Med 2016; 8:328rv4; PMID:26936508; https://doi.org/https://doi.org/10.1126/scitranslmed.aad7118
- Mills CD, Lenz LL, Harris RA. A breakthrough: Macrophage-directed cancer immunotherapy. Cancer Res 2016; 76:513-6; PMID:26772756; https://doi.org/https://doi.org/10.1158/0008-5472.CAN-15-1737
- Jain RK, Stylianopoulos T. Delivering nanomedicine to solid tumors. Nat Rev Clin Oncol 2010; 7:653-64; PMID:20838415; https://doi.org/https://doi.org/10.1038/nrclinonc.2010.139