
ABSTRACT
Regulatory T cells (Treg) suppress anti-tumor immune responses and their infiltration in the tumor microenvironment is associated with inferior prognosis in cancer patients. Thus, in order to enhance anti-tumor immune responses, selective depletion of Treg is highly desired. We found that treatment with zoledronic acid (ZA) resulted in a selective decrease in the frequency of Treg that was associated with a significant increase in proliferation of T cells and natural killer (NK) cells in peripheral blood of patients with metastatic cancer. In vitro, genome-wide transcriptomic analysis revealed alterations in calcium signaling pathways in Treg following treatment with ZA. Furthermore, co-localization of the nuclear factor of activated T cells (NFAT) and forkhead box P3 (FOXP3) was significantly reduced in Treg upon ZA-treatment. Consequently, reduced expression levels of CD25, STAT5 and TGFβ were observed. Functionally, ZA-treated Treg had reduced capacity to suppress T and NK cell proliferation and anti-tumor responses compared with untreated Treg in vitro. Treatment with ZA to selectively inhibit essential signaling pathways in Treg resulting in reduced capacity to suppress effector T and NK cell responses represents a novel approach to inhibit Treg activity in patients with cancer.
Introduction
Cancer progression is generally associated with impaired anti-tumor immunity mediated by recruitment of regulatory cell populations to the tumor microenvironment. A common feature of several cancers is the frequent infiltration of regulatory T cells (Treg) in the tumor microenvironment.Citation1,Citation2 Several studies have shown that frequencies of Treg significantly correlate with impaired functions of immune effector cells in patients with cancer.Citation3 Moreover, increased Treg frequency along with impaired activity of cytotoxic T lymphocytes (CTL) and natural killer (NK) cells in patients with breast cancer, prostate cancer, renal cell carcinoma among other malignancies is associated with unfavorable prognostic factors.Citation4-8 Therefore, selective targeting of Treg proliferation and suppressive function represent an attractive approach to re-stabilize the anti-tumoral responses by immune effector cells in cancer patients.
Zoledronic acid (ZA) is a third generation bisphosphonate with anti-proliferative properties that is used to reduce skeletal-morbidity in patients with hypercalcemia, osteoporosis and metastatic breast and prostate cancer.Citation9-12 Recent studies have highlighted the anti-tumoral effects of ZA.Citation9,Citation13 Analysis from multi-center randomized trials and 11,767 postmenopausal women comparing breast cancer patients receiving ZA as an adjuvant treatment versus control showed a significant reduction in recurrence and breast cancer mortality.Citation14 Further studies have investigated the immunomodulatory effect of ZA. Interestingly, pre-clinical studies have shown that ZA expand γδ T cells during extended culture of peripheral blood mononuclear cells (PBMC).Citation15-17 Along these lines, administration of ZA has shown to increase the anti-tumoral activity of γδ T cells in cancer patients.Citation18,Citation19 Additional studies have shown that ZA affects other immune cell components. We have earlier demonstrated that ZA triggers the production of IFNγ in monocytes, which subsequently activates NK cells.Citation20 Moreover, ZA has been shown to impair the stromal reactivation by hampering M2-macrophages polarization.Citation21 Castella et. al. and Lui et.al. have independently showed that ZA inhibits Treg suppression, however the mechanism of how ZA act on Treg function has not been fully characterized.Citation22,Citation23
In this study we sought to investigate how ZA modulates the activity of regulatory T cells and whether this is operant in cancer patients. A decreased frequency of circulating Treg accompanied by increased proliferation of NK and T cells was observed in patients with metastatic cancer following ZA treatment. In vitro, ZA-treated Treg had reduced capacity to suppress T and NK cell responses. Transcriptomic analysis revealed alterations in calcium channel gene expression in Treg following treatment with ZA. Subsequently, downstream calcium signaling was obstructed by reduced intranuclear co-localization of NFAT and FOXP3 in ZA-treated Treg. Furthermore, the expression of CD25 and FOXP3 in Treg significantly decreased upon exposure to ZA in vitro. In conclusion, treatment with ZA inhibits calcium and IL-2 signaling in Treg resulting in reduced capacity to suppress T and NK cell responses, and thus represents a novel approach to inhibit Treg activity.
Material and methods
Patients and healthy donors
Peripheral blood was obtained from healthy blood donors and cancer patients (n = 10, supplemental table 1) following signed informed consent. Breast-, bladder-, kidney- and prostate cancer patients with skeletal metastases, fulfilling standard criteria for treatment with ZA in order to reduce or prevent skeletal-related events, were prospectively included following to signed informed consent. All patients were treated at the department of oncology, Radiumhemmet, Karolinska University Hospital. Collection of patient samples was approved by the ethical review board of Karolinska Institutet (#2013/829-31/3) and in accordance with the Declaration of Helsinki. Written consent forms were signed before material collection. Blood from patients was collected before and one week after intravenous administration with 4 mg ZA.
Cell isolation
Peripheral blood mononuclear cells (PBMC) from patients (pre and one week post ZA administration) and healthy blood donors were collected after Ficoll gradient centrifugation (Ficoll-Paque Plus, GE Healthcare). Treg were enriched (50–70%) by two-step magnetic bead isolation, first by isolating CD4+CD127dim/− cells thereafter CD25 selection (Miltenyi Biotech) (Supplemental Figure 1A). NK cells, pan or CD4 T cells, and HLA-DR+ antigen presenting cells were isolated (purity >93%) from PBMC by negative depletion (NK cells, CD4 T cells) or positive selection (HLA-DR+ cells, CD3 T cells) (Miltenyi Biotech). Alternatively, Treg were sorted on a BD FACSJazz CD4+CD127−CD25high (>95%) after CD4 enrichment (Miltenyi Biotech). CD3+CD4+FOXP3− cells are referred to as CD4+ conventional T cells throughout here.
Flow cytometry analysis
PBMC from patients (pre and post ZA) were stained for lymphoid and myeloid markers with fluorochrome-conjugated antibodies, and fixable dead cell marker (Supplemental Table 2). Detection of intracellular FOXP3 and Ki67 was performed using a Foxp3/Transcription Factor Fixation/Permeabilization kit according to the manufacturer's instructions (eBioscience). Treg from healthy blood donors were preactivated with either IL-2 (500 IU/ml) or with IL-2 (500 IU/ml) and OKT3 (100-250 ng/ml) in the presence or absence of ZA (10 μM) for 1 or 3 days and stained for CD3, CD4, CD127, FOXP3, CD25, TGFβ, and fixable dead cell marker. Gating strategy for Treg is shown in (Supplemental Figure 1B). All cells were acquired by a BD LSRII flow cytometer (BD Biosciences) and analyzed using FlowJo software (Tree Star).
For STAT5 analysis, enriched Treg from healthy blood donors were cultured in IL-2 (500 IU/ml) for 15, 30, and 90 minutes in the presence or absence of ZA (10 μM) before analysis of STAT5 phosphorylation. Cells were fixed and permeabilized with BD fixation buffer and permeabilization buffer III and stained for pSTAT5 (pY694) according to the manufacturer's instructions (BD biosciences).
Confocal microscopy
Treg were pre-activated with IL-2 (500 IU/ml) and OKT3 (100 ng/ml) in the presence or absence of ZA (10 μM) overnight. Cells were loaded on a poly-lysine pre-treated cover glass for 30 min, blocked with 3% BSA and fixed and permeabilized in ice-cold methanol:acetone (1:1) at −20°C for 10 minutes. Following fixation, cells were stained with anti-FOXP3, anti-NFAT for 2 hours at room temperature and then stained for 1 hour with the fluorescence-labeled secondary antibodies and DAPI (Molecular probes/Life technology) and imaged by a Zeiss LSM 700 confocal microscope with a 20x-objective. Images were analyzed using ImageJ 2.0 software.
RNA-sequencing
Flow cytometry-sorted Treg were cultured overnight with IL-2 (500 IU/ml), OKT3 (250 ng/ml, and with or without ZA (10 μM). Following culture, cells were resuspended and stored in RLT buffer (Qiagen) at −80˚C. RNA was purified using the RNeasy Micro Kit (Qiagen) to a final volume of 14µl. Of this, 10µl was used to generate cDNA using the Clonetech SMARTer Kit (Clonetech). After library generation using the Nextera XT Kit (Illumina), pooled libraries were loaded at 10pM on High-Output flow cells onto a HiSeq2500 System (Illumina) and one-hundred base paired-end read sequencing was performed. All procedures were performed according to the manufacturer's instructions. Raw sequencing FASTQ files were assessed for quality control using FASTQC software (http://www.bioinformatics.babraham.ac.uk/projects/fastqc/). The FASTQ files were processed to trim Illumina adaptors using the TrimGalore! Software package (http://www.bioinformatics.babraham.ac.uk/projects/trim_galore/). Reads were mapped to the GRCh37 human reference genome with the STAR algorithm v2.5.0a.Citation24 Aligned reads were output as sorted BAM files that were quantified using the GeneCounts function within STAR using the GENCODE v19 release. The differential gene expression analyses were implemented in EdgeR,Citation25 using the generalized linear model (GLM) capability of EdgeR to perform differential expression adjusting for differences between individuals. Each gene, where at least three samples had a normalized count per million (cpm) of at least 0.5, was examined for differential expression. Fold change, p-values and FDRs (false discovery rates) were reported. A volcano plot was generated for genes where at least 3 individuals had a cpm of 0.5 using R programming. Gene Set Enrichment Analysis (GSEA) was performed and enrichment scores (ES), which reflect the degree to which a set of genes is overrepresented among those differentially expressed genes, as well as nominal p values and FDRs for a particular function or pathway of interest, were reported. GEO accession number: GSE96075.
Suppression assay
Treg were pretreated with OKT3 (250 ng/ml), IL-2 (500 IU/ml), and +/− ZA (10 μM) for 3 days. Following pretreatment, Treg were washed and co-cultured with NK cells or CD4+ conventional T cells and HLA-DR+ cells (1:1) at different ratios (1:1-1:8) in the presence of IL-2 (200 IU/ml) or OKT3 (250 ng/ml) for 4 and 3 days respectively. Cell proliferation was measured by 3H-thymidine incorporation, on day 3 and 4. Tritiated thymidine (3H, 25 μCi per well) was added to the cells during the final 6-8 hours of incubation. Incorporation of 3H-thymidine was analyzed by a MicroBeta scintillation (TriLux 1450, PerkinElmer) plate reader.
Chromium release assay
Following 3 days of pretreatment with IL-2 (500 IU/ml) and OKT3 (250 ng/ml) in the presence or absence of ZA (10 μM), Treg were washed and thereafter co-cultured (1:2) with NK cells or Her2-specific chimeric antigen receptor (CAR)-transduced T cellsCitation26 for 48 hours. Following co-culture, NK and T cells were directly co-cultured without further purification with chromium 51Cr (30 μCi, PerkinElmer) labeled K562 (ATCC) or Her2-expressing SKOV3 (ATCC) target cells at different effector to target (E:T) ratio (2:1-0.5:1) for 18 hours. Following co-culture with effector cells, 25μl supernatant was transferred onto LumaPlates (PerkinElmer) and analyzed on the MicroBeta scintillation plate reader and specific target lysis was determined.
Statistical analysis
All data were first analyzed in the software mentioned above and summarized by Prism Version 5 and 6 software (GraphPad). All data were first tested for normal distribution. Thereafter, differences among groups were analyzed by a Student's t test, Two-Way ANOVA, or nonparametric Wilcoxon test (as indicated in the figure legends). Representative histograms or images were chosen based on the average values.
Results
Administration of ZA reduces the frequency of circulating Treg in patients with cancer
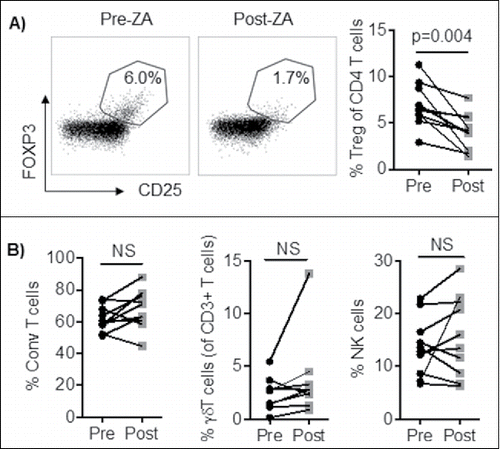
To investigate whether treatment with ZA changes the frequencies of peripheral blood lymphocytes, blood from ten patients with advanced disease (Supplemental Table 1) was collected before and after treatment with ZA and analyzed for Treg, conventional and γδ T cells, and NK cell frequencies by flow cytometry. On average, the frequency of Treg decreased from 7.0% ± 2.3% to 4.0% ± 2.0%, following ZA treatment (p = 0.004, ). However, no significant changes in frequencies of conventional T cells (CD3+FOXP3−, mean ± SD: 63.3% ± 11.7% vs. 61.8% ± 10.0%, p = 0.8), neither in CD4+ conventional T cells (Supplemental Figure 2A), γδ T cells (mean: 2.4% ± 1.6% vs. 3.8% ± 3.9%, p = 0.1), or NK cells (mean ± SD: 13.7% ± 5.5% vs. 15.7% ± 7.6%, p = 0.4) were observed one week post ZA treatment ().
Figure 1. PBMC from cancer patients (n = 10) were stained and analyzed by flow cytometry for; A) Treg (CD3+CD4+CD127−CD25+FOXP3+ of lymphocytes), B) NK cell (CD3−CD56+ of lymphocytes), γδ T cell (CD3+γδ+), and Conventional T cell (CD3+FOXP3−) frequencies before and after ZA treatment. Statistical analyses were performed on pooled data using Student's t test.
ZA alters gene expression of calcium channel activity in Treg from healthy individuals
To examine the underlying cause of reduced Treg frequency in patients after treatment with ZA, enriched Treg from healthy blood donors were exposed to ZA and IL-2 and analyzed for their proliferation and viability. No significant change in Treg proliferation or viability was observed between Treg cultured in the presence of absence of ZA (). Similarly, we found no significant changes in Treg proliferation or viability following ZA administration in patients with metastatic cancer (data not shown). Moreover, we did not observe any direct effect of ZA treatment on proliferation of healthy donor conventional T cells (data not shown).
Figure 2. A) Enriched Treg from healthy blood donors were cultured with IL-2 and OKT3 for three days and analyzed for their proliferation by 3H-thymidine incorporation and viability by 7AAD and Annexin V. Statistical analyses were done on pooled data (n = 4) using non-parametric Wilcoxon matched-pair test. B) Heat-map or C) volcano plot of Differential Gene Expression (DEG) following RNA-sequencing of overnight cultured healthy blood donor Treg with IL-2, OKT3 in the presence or absence of ZA (n = 6). NS = not significant. The volcano plot shown illustrates the expression fold change (log2) vs. p-value (–log10). Single dots represent individual genes, where red dots indicate a p-value ≤ 0.05 and fold change of ≥1.3 while green dots indicate a p value ≤ 0.05 and a fold change of ≤ -1.3. D) The ranked DEG lists were used to perform GSEA using Gene Ontology annotated functions. Selected significantly altered gene set functions (p ≤ 0.05), showing the contribution of individual genes to the enriched gene sets in ZA treated Treg from healthy blood donor relative to untreated. E) The enrichment plot indicating the positive enrichment of genes associated with voltage gated calcium channel complex in ZA-treated compared to untreated healthy blood donor Treg.
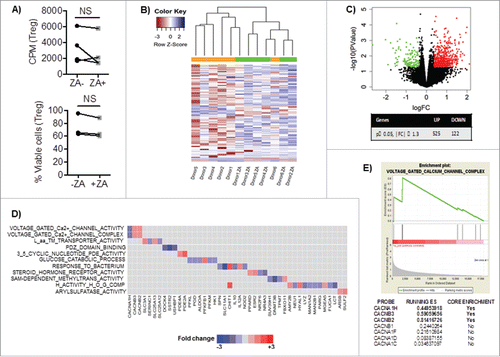
To investigate potential alterations in the molecular pathways in Treg upon ZA-treatment, gene expression analysis was performed on flow cytometry sorted Treg from healthy blood donors. Upon ZA treatment of Treg, 525 genes were upregulated and 122 were downregulated (p value ≤ 0.05 and fold change ≥ 1.3). In an unsupervised analysis of the top 100 differentially expressed genes, we found that five of the six donors segregated together based on ZA treatment status, with distinct sets of genes commonly altered in the donors upon treatment with ZA (). A volcano plot illustrates 18 218 genes that were up- or downregulated in ZA-treated Treg compared to untreated Treg (). Gene Set Enrichment Analysis (GSEA) revealed a significant enrichment in 30 Gene Ontology pathways (p ≤ 0.05) (). Based on high enrichment score, voltage gated calcium channel activity and complex represented the top pathways that were significantly altered by ZA (). This included a significant downregulation of CACNA1H, a gene encoding for alpha-subunit of the low-voltage activated (LVA) calcium channel was observed. In contrast, CACNB2 and CACNB3, which are involved in the regulation of the calcium channel activation state, were enriched in ZA-treated Treg (). Taken together, treatment with ZA alters key regulators of voltage-dependent calcium channel activity in Tregs.
Table 1. Differential gene expression (DEG) analysis of gene sets that are significantly altered (p ≤ 0.05) in ZA-treated compared with untreated Treg and ranked by enrichment score.
ZA disrupts calcium dependent Treg signaling pathways and reduces intranuclear co-localization of NFAT and FOXP3
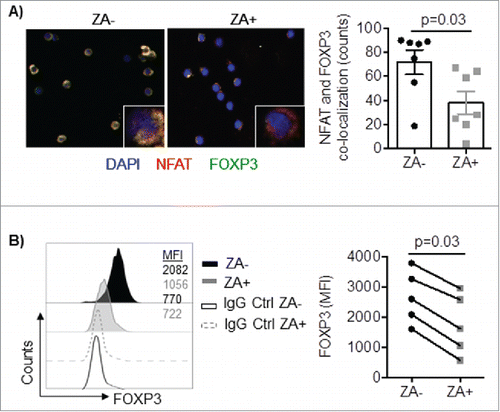
Given the alteration in genes involved in calciumsignaling, we sought to investigate the calcium dependent Ca2+/calcineurin/NFAT pathway that previously been shown to play critical role in Treg function.Citation27 Confocal microscopy of enriched Treg revealed that NFAT and FOXP3 were less co-localized in the nucleus on ZA treated cells compared to untreated cells (). To confirm this finding, intracellular flow cytometry staining for FOXP3 on Treg enriched cells was performed. Indeed, the expression levels of FOXP3 were significantly decreased in Treg following in vitro exposure to ZA (MFI: 2570 ± 820 vs. 1640 ± 940, p = 0.03, ). Together, these data show that ZA treatment alters downstream cooperation of the calcium-dependent Ca2+/calcineurin/NFAT and FOXP3 pathways.
Figure 3. A) Enriched Treg were pre-activated with IL-2 and OKT3 in the presence or absence of ZA overnight and stained for FOXP3 (green), NFAT (red) and the nuclear dye DAPI (blue). Cells were analyzed by confocal microscopy (20x) and images were analyzed using ImageJ 2.0. An enlarged image of one representative cell is shown in the bottom right corner. Representative images and accumulated data (n = 7) mean ± SEM are shown and statistical analyses were performed by the Student's t test. B) Enriched Treg were stimulated with IL-2 in the presence or absence of ZA for 3 days and analyzed for the expression of FOXP3 by flow cytometry. A representative histogram and pooled (n = 5 donors) data mean ± SEM are shown and statistical analyses were performed by Wilcoxon test.
ZA decreases expression of CD25, pSTAT5, and production of TGFβ in Treg
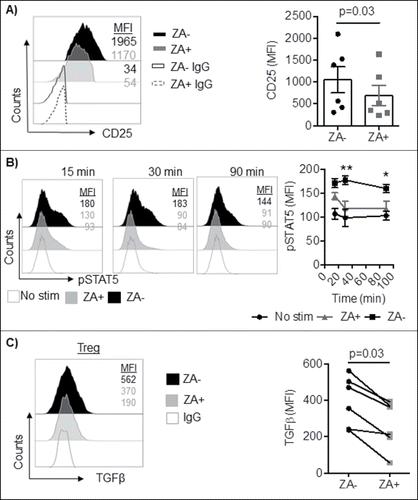
Principally, as a result of NFAT and FOXP3 intranuclear co-localization, CD25 expression is induced to maintain Treg function.Citation28,Citation29 Hence, we next sought to characterize CD25 and other central proteins for Treg function by comparison of ZA treated and untreated enriched Treg and CD4+ conventional T cells through flow cytometry. Indeed, exposure to ZA significantly decreased the expression of CD25 in Treg (MFI: 1050 ± 720 vs 690 ± 560, p = 0.03), but not in CD4+ conventional T cells (, Supplemental Figure 2B). Along with decreased expression of CD25, the addition of ZA resulted in decreased levels of STAT5 phosphorylation in Treg confirming that the IL-2 pathway is altered following treatment with ZA (p<0.01, ). Given the critical role of TGFβ production by Treg to suppress T and NK cells,Citation30 the expression of TGFβ in Treg following exposure to ZA was analyzed. A significant decrease in TGFβ-expression was observed in Tregs following ZA-treatment (p = 0.03, ). Thus, our results show that ZA affects the phenotype and function of Treg, but not of CD4+ conventional T cells.
Figure 4. A) Enriched Treg from healthy blood donors (n = 6) were stimulated with IL-2 in the presence or absence of ZA for 3 days and analyzed for the expression of CD25 by flow cytometry. A representative histogram and accumulated data mean ± SEM are shown and statistical analysis was performed by Wilcoxon test. Each symbol represents a distinct healthy individual. B) Enriched Treg from healthy blood donors (n = 3) were stimulated with and without IL-2 in the presence or absence of ZA for 15, 30, and 90 minutes and analyzed for the expression of phosphorylated STAT5 by flow cytometry. Representative histograms and accumulated data mean ± SEM are shown and statistical analysis was performed by Two-way ANOVA. **p = 0.004, *p = 0.01. C) Enriched or sorted Treg (n = 6) were overnight stimulated with IL-2 and OKT3 in the presence or absence of ZA and stained for total TGFβ. A representative histogram and accumulated data are shown and statistical analyses were performed by Wilcoxon test.
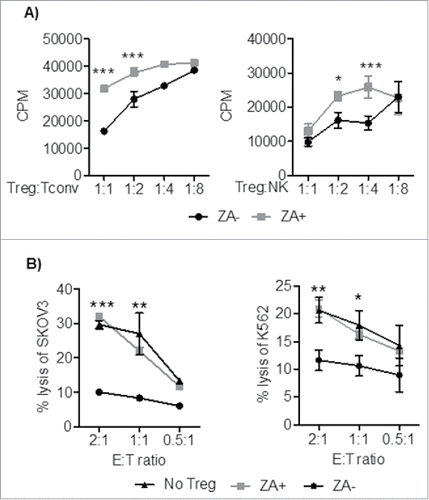
ZA-treated Treg exhibit reduced suppressive effect on NK and conventional T cell- proliferation and cytotoxicity in vitro and in patients with cancer
As ZA treatment altered pathways associated with Treg suppressive activity, the ability of ZA-treated Treg to suppress conventional T and NK cell responses was investigated in vitro, and in cancer patients. In vitro, ZA pre-treated or untreated Treg were co-cultured with CD4+ conventional T or NK cells and assessed for proliferation. Conventional CD4+ T cell and NK cell proliferation was significantly reduced in the presence of Treg. However, compared with untreated, ZA treated Treg were unable to suppress conventional T or NK cell proliferation (). Furthermore, ZA-treated Treg did not suppress tumor-specific T cell or NK cell cytotoxicity compared to untreated Treg ().
Figure 5. Treg were pretreated with OKT3, IL-2, +/− ZA, and co-cultured with CD4+ T cells and HLA-DR+ (1:1) or NK cells at different ratios (1:1-1:8) in the presence of OKT3 or IL-2 for 3 and 4 days respectively. A) Cell proliferation was measured by 3H-thymidine incorporation. Representative data are shown of three independent experiments mean ± SEM and statistical analyses were performed using Two-way ANOVA to analyze statistical differences between all groups. B) Following 3 days of preactivation with IL-2 and OKT3 in the presence or absence of ZA, Treg were co-cultured (1:2) with Her2-specific chimeric antigen receptor (CAR)-transduced T cells or NK cells and co-incubated with chromium 51Cr labeled Her2-expressing SKOV3 or K562 target cells respectively at different E:T ratio (2:1-0.5-1) for 18 hours. Representative data are shown from three independent experiments mean ± SEM and statistical analyses were performed by Two-way ANOVA to analyze statistical differences between all groups.
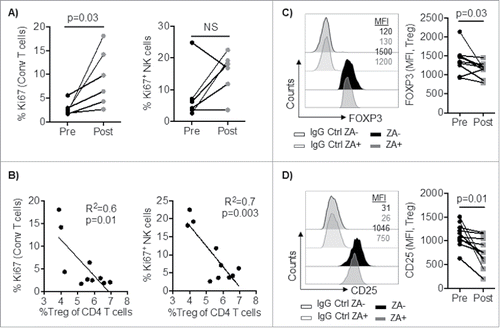
We next investigated whether these mechanisms were compelled in a physiologic setting in vivo. Although we did not observe any significant changes in the overall frequency of conventional T cells and NK cells in patients with metastatic cancer before and after treatment with ZA, the ability of conventional T and NK cells to proliferate was increased following ZA treatment. The frequency of Ki67 positive NK- and conventional T- cells increased by 1.9-fold and 3.3-fold (p = 0.03) respectively after treatment with ZA (). Reduced Treg frequency significantly correlated with increased proliferation of conventional T cells and NK cells (). Notably, similar to the signaling alteration that was found in Treg from healthy blood donors, the expression of FOXP3 and CD25 were significantly decreased in Treg from patients with cancer post treatment (, ). However, no difference in the expression of CD25 was observed in Conventional CD4+ T cell post treatment (Supplemental Figure 2B). Moreover, the expression of the NK cell activation receptors NKG2D and NKp30 significantly increased on CD56bright and CD56dim respectively following ZA-administration in cancer patients (p<0.05) (Supplemental Figure 2C). Overall, our data show that ZA-treatment significantly reduces the ability of Treg to suppress T and NK cell activity and the administration of ZA modulates innate and adaptive immune responses in patients with cancer.
Figure 6. A) PBMC from cancer patients (n = 6) were stained and analyzed by flow cytometry for conventional (CD3+FOXP3−) T cell and NK cell proliferation (Ki67-positive cells) pre and one week post ZA administration. B) Correlation between percent circulating Treg and NK and T cell proliferation (Ki67). Statistical analyses were performed on pooled data using A) Wilcoxon test, and B) Pearson's correlation. PBMC from cancer patients (n = 10) were stained and analyzed by flow cytometry for the expression of C) FOXP3 and D) CD25. Representative histograms and pooled data are shown and Statistical analyses were performed using Student's t test.
Discussion
This study reveals additional important immunomodulatory effects of ZA applied to Treg. Treatment with ZA selectively inhibits Ca2+/ calcineurin/ NFAT and IL-2 signaling pathways in Treg, resulting in reduced capacity to suppress T and NK cell responses in vitro. Furthermore, we found that cancer patients treated with ZA had reduced numbers of circulating Treg. Reduction of circulating Treg correlated with increased ability of FOXP3− T cells and NK cells to proliferate in matched samples. Altogether, our findings suggest a possible novel clinical application for ZA in cancer therapy.
In vitro, several studies have revealed a central role of Treg in suppression of NK and conventional T cells. One of the key suppression mechanisms applied by Treg is the production of TGFβ. Islas-Vazquez et.al. have shown that serum TGFβ levels as well as TGFβ-producing Treg are increased in patients with lung adenocarcinoma compared to healthy non-smoker subjects.Citation31 Furthermore, infiltration of Treg with high expression of FOXP3 and TGFβ predicts poor survival rate in patients with colorectal cancer.Citation32 In addition, Treg can also suppress innate and adaptive immunity by the deprivation of IL-2 through CD25.Citation33-35 Gasteiger et. al. found that the presence of Treg decreased NK cell killing of target cells missing MHC class I, an inhibition depended on the availability of IL-2.Citation36 In addition, TGFβ contributes to Treg suppression under IL-2 depriving condition.Citation34
Several efforts to selectively target Treg suppressive mechanisms have been explored. Recently, treatment with TGFβ inhibitors have shown reduced TGFβ signaling and reduction in the infiltration of intratumoral Treg in an in vivo mouse breast cancer model.Citation37 In addition, Fresolimumab, an anti-TGFβ monoclonal antibody, has now been tested in a phase I clinical trial in patients with metastatic melanoma and renal cell carcinoma. Results indicated increased infiltration of CD8+ T cells in the invasive margin, however the correlation between Treg- TGFβ and CD8+ T cell infiltration was not examined.Citation38 Other strategies to deplete circulating Treg were made by e.g. the IL-2-diphtheria fusion protein (IL2DT) to improve NK cell transfer in patients with acute myeloid leukemia (AML). Backanova et.al. found a strong correlation between Treg depletion and NK cell expansion, and response rate in AML patients. However, successful Treg depletion was achieved only in 40% of the patients receiving IL2DT.Citation39 Additional Treg-depletion strategy is the use of the FDA–approved CD25-blocking monoclonal antibody Daclizumab that show a selective depletion of CD25high -expressing Treg with no autoreactivation in patients with metastatic breast cancer.Citation40 Moreover, nonmyeloablative chemotherapies such as cyclophosphamide have been shown to reduce circulating Treg and enhance T and NK cell functions in cancer patients.Citation41 On the other hand, these treatments have unfavorable effects including reduction of antibody-dependent cell-mediated cytotoxicity caused by down-modulation of CD16 expression on NK cells.Citation42 Moreover, cyclophosphamide and Fresolimumab is associated with adverse events in patients with cancer including leukopenia, neutropenia, and hyperkeratosis.Citation38,Citation43 In addition, IL2DT and Daclizumab have only a transient effect and Treg counts are restored to baseline levels within three months after treatment.Citation39,Citation40 Thus, more efficient and selective methods to deplete Treg are needed.
Here we show that ZA reduces the frequency of Treg in patients with metastatic disease. The decrease in Treg frequency correlated with improved proliferation of conventional T cells and NK cells. However, we did not observe any changes in total T or NK cell frequency in peripheral blood one week after ZA treatment. It is possible that increased frequencies of effector cells are delayed and may increase during the course of ZA treatment. However, we did not analyze blood samples beyond one week of treatment. We did not detect any direct cytotoxic or cytostatic effect by ZA on Treg in vitro nor in patients with cancer, suggesting that other mechanisms involved in the observed evasion of Treg in ZA treated patients.
To gain deeper understanding of the gene-expression programs that are affected by ZA treatment, we performed transcriptome analysis of Treg after exposure to ZA in vitro. Among the top differentially regulated pathways were voltage gated calcium channel activity and complex. We then found that ZA treated Treg have a reduced NFAT co-localization with FOXP3 and subsequently reduced expression of CD25. Notably, we found that Treg express significantly less FOXP3 and CD25 following ZA administration in patients with cancer, indicating that ZA exhibit similar action on Treg derived form healthy blood donors and patients with metastatic disease. The calcium-dependent transcription factor NFAT is a key regulator of T cell function that forms complexes with the AP-1 family of the transcription factors and regulates T cell activation-associated genes. However, NFAT dimerizes with FOXP3 resulting in an increased expression of CTLA-4 and CD25 in Treg and support their suppressive function. Hence, by dimerizing with different transcription factors, NFAT converts the T cell activation program into the suppressor program of Treg.Citation28 Additional evidence of the Ca2+/calcineurin/NFAT pathway's critical role for Treg function has been observed in the context of mismatch bone marrow transplantation where mice were treated with the calcineurin inhibitor cyclosporine A. Cyclosporine A was shown to inhibit Treg function and reduces the level of FOXP3 expression which resulted in increased graft-vs.-host disease (GVHD).Citation44 This impact of cyclosporine A as a calcineurin inhibitor reflects our findings subsequent to impaired NFAT signaling and is consistent with our findings of reduced FOXP3 expression in Treg following ZA treatment.
As a result of reduced CD25 expression in ZA treated Treg as shown here and because Treg strongly depend on IL-2 signaling,Citation45 we also investigated the impact of ZA in IL-2 signaling. Thus, we found that downstream IL-2 signaling was affected in Treg by a decrease in STAT5 phosphorylation. Moreover, ZA treated Treg produce reduced amounts of TGF-β compared to control. Overall, our data suggest that ZA-treated Treg are less suppressive. Indeed, ZA-treated Treg had a reduced ability to suppress T and NK cell proliferation and cytotoxicity compared with untreated Treg.
In summary, we show that ZA alters activity in NFAT and IL-2 pathways in Treg and represses their suppressive function. These findings suggest that ZA may be used as a conditioning neoadjuvant treatment to immunotherapy to improve reconstitution of effector immune function and enhance the subsequent immune-therapeutic effects in patients with cancer.
Disclosure of potential conflicts of interest
No potential conflicts of interest were disclosed.
KONI_A_1338238_s02.docx
Download MS Word (831.3 KB)Acknowledgments
We would like to thank Karl-Johan Ekdahl at Oncology Clinic at Karolinska hospital, for coordinating patient samples collection and organizing patients’ records. We thank Dr. Anthony Griswald, at the John P. Hussman at the Institute for Human Genomics, University of Miami Miller School of Medicine, and Emily Blake at the Nova Southeastern University, and Cell Therapy Institute and Genomics Core Facility, for performing the RNA-sequencing bioinformatics data analyses.
Funding
This work was supported by a fellowship to DS from Karolinska Institutet, Sweden (Postdoctoral fellowship at the University of Minnesota, 2-1180/2014) and the following grants: The Swedish Cancer Society (CAN 2012/474 and CAN 2015/421 (AL), CAN 2016/785 (JA), CAN 2016/825 (CR)), Swedish Childhood Cancer Foundation (PR2014-0093 (AL), PR2016-0031 (JA)), The Cancer Research Foundations of Radiumhemmet (#141272), and Svenska Folkfonden.
References
- Mougiakakos D, Choudhury A, Lladser A, Kiessling R, Johansson CC. Regulatory T cells in cancer. Adv Cancer Res 2010; 107:57-117; PMID:20399961; https://doi.org/10.1016/S0065-230X(10)07003-X
- Marvel D, Gabrilovich DI. Myeloid-derived suppressor cells in the tumor microenvironment: Expect the unexpected. J Clin Invest 2015; 125:3356-64; PMID:26168215; https://doi.org/10.1172/JCI80005
- Beyer M, Schultze JL. Regulatory T cells in cancer. Blood 2006; 108:804-11; PMID:16861339; https://doi.org/10.1182/blood-2006-02-002774
- Sun S, Fei X, Mao Y, Wang X, Garfield DH, Huang O, Wang J, Yuan F, Sun L, Yu Q, et al. PD-1(+) immune cell infiltration inversely correlates with survival of operable breast cancer patients. Cancer Immunol Immunother 2014; 63:395-406; PMID:24514954; https://doi.org/10.1007/s00262-014-1519-x
- Idorn M, Kollgaard T, Kongsted P, Sengelov L, Thor Straten P. Correlation between frequencies of blood monocytic myeloid-derived suppressor cells, regulatory T cells and negative prognostic markers in patients with castration-resistant metastatic prostate cancer. Cancer Immunol Immunother 2014; 63:1177-87; PMID:25085000; https://doi.org/10.1007/s00262-014-1591-2
- Liotta F, Gacci M, Frosali F, Querci V, Vittori G, Lapini A, Santarlasci V, Serni S, Cosmi L, Maggi L, et al. Frequency of regulatory T cells in peripheral blood and in tumour-infiltrating lymphocytes correlates with poor prognosis in renal cell carcinoma. BJU Int 2011; 107:1500-6; PMID:20735382; https://doi.org/10.1111/j.1464-410X.2010.09555.x
- Jie HB, Schuler PJ, Lee SC, Srivastava RM, Argiris A, Ferrone S, Whiteside TL, Ferris RL. CTLA-4(+) Regulatory T cells increased in cetuximab-treated head and neck cancer patients suppress NK cell cytotoxicity and correlate with poor prognosis. Cancer Res 2015; 75:2200-10; PMID:25832655; https://doi.org/10.1158/0008-5472.CAN-14-2788
- Liu JY, Li F, Wang LP, Chen XF, Wang D, Cao L, Ping Y, Zhao S, Li B, Thorne SH, et al. CTL- vs Treg lymphocyte-attracting chemokines, CCL4 and CCL20, are strong reciprocal predictive markers for survival of patients with oesophageal squamous cell carcinoma. Br J Cancer 2015; 113:747-55; PMID:26284335; https://doi.org/10.1038/bjc.2015.290
- Gobel A, Thiele S, Browne AJ, Rauner M, Zinna VM, Hofbauer LC, Rachner TD. Combined inhibition of the mevalonate pathway with statins and zoledronic acid potentiates their anti-tumor effects in human breast cancer cells. Cancer Lett 2016; 375:162-71; PMID:26968247; https://doi.org/10.1016/j.canlet.2016.03.004
- Okegawa T, Higaki M, Matsumoto T, Kase H, Murata A, Noda K, Noda H, Asaoka H, Oshi M, Tomoishi J, et al. Zoledronic acid improves clinical outcomes in patients with bone metastatic hormone-naive prostate cancer in a multicenter clinical trial. Anticancer Res 2014; 34:4415-20; PMID:25075079.
- Saad F, Gleason DM, Murray R, Tchekmedyian S, Venner P, Lacombe L, Chin JL, Vinholes JJ, Goas JA, Zheng M, et al. Long-term efficacy of zoledronic acid for the prevention of skeletal complications in patients with metastatic hormone-refractory prostate cancer. J Natl Cancer Inst 2004; 96:879-82; PMID:15173273; https://doi.org/10.1093/jnci/djh141
- Aapro M, Abrahamsson PA, Body JJ, Coleman RE, Colomer R, Costa L, Crinò L, Dirix L, Gnant M, Gralow J, et al. Guidance on the use of bisphosphonates in solid tumours: Recommendations of an international expert panel. Ann Oncol 2008; 19:420-32; PMID:17906299; https://doi.org/10.1093/annonc/mdm442
- Uemura H, Yanagisawa M, Ikeda I, Fujinami K, Iwasaki A, Noguchi S, Noguchi K, Kubota Y; Yokohama Bone Metastasis Study Group. Possible anti-tumor activity of initial treatment with zoledronic acid with hormonal therapy for bone-metastatic prostate cancer in multicenter clinical trial. Int J Clin Oncol 2013; 18:472-7; PMID:22491982; https://doi.org/10.1007/s10147-012-0406-8
- Early Breast Cancer Trialists' Collaborative G, Coleman R, Powles T, Paterson A, Gnant M, Anderson S, Diel I, Gralow J, von Minckwitz G, Moebus V, et al. Adjuvant bisphosphonate treatment in early breast cancer: Meta-analyses of individual patient data from randomised trials. Lancet 2015; 386:1353-61; PMID:26211824; https://doi.org/10.1016/S0140-6736(15)60908-4
- Nussbaumer O, Gruenbacher G, Gander H, Komuczki J, Rahm A, Thurnher M. Essential requirements of zoledronate-induced cytokine and gammadelta T cell proliferative responses. J Immunol 2013; 191:1346-55; https://doi.org/10.4049/jimmunol.1300603
- Kondo M, Izumi T, Fujieda N, Kondo A, Morishita T, Matsushita H, Kakimi K. Expansion of human peripheral blood gammadelta T cells using zoledronate. J Vis Exp 2011; PMID:21931292; https://doi.org/10.3791/3182
- Kondo M, Sakuta K, Noguchi A, Ariyoshi N, Sato K, Sato S, Sato K, Hosoi A, Nakajima J, Yoshida Y, et al. Zoledronate facilitates large-scale ex vivo expansion of functional gammadelta T cells from cancer patients for use in adoptive immunotherapy. Cytotherapy 2008; 10:842-56; PMID:19016372; https://doi.org/10.1080/14653240802419328
- Mahtani R, Khan R, Jahanzeb M. The potential application of zoledronic acid as anticancer therapy in patients with non-small-cell lung cancer. Clin Lung Cancer 2011; 12:26-32; PMID:21273176; https://doi.org/10.3816/CLC.2011.n.003
- Muraro M, Mereuta OM, Carraro F, Madon E, Fagioli F. Osteosarcoma cell line growth inhibition by zoledronate-stimulated effector cells. Cell Immunol 2007; 249:63-72; PMID:18163982; https://doi.org/10.1016/j.cellimm.2007.11.005
- Sarhan D, D'Arcy P, Wennerberg E, Liden M, Hu J, Winqvist O, Rolny C, Lundqvist A. Activated monocytes augment TRAIL-mediated cytotoxicity by human NK cells through release of IFN-gamma. Eur J Immunol 2013; 43:249-57; PMID:22996291; https://doi.org/10.1002/eji.201242735
- Comito G, Segura CP, Taddei ML, Lanciotti M, Serni S, Morandi A, et al. Zoledronic acid impairs stromal reactivity by inhibiting M2-macrophages polarization and prostate cancer-associated fibroblasts. Oncotarget 2016; https://doi.org/10.18632/oncotarget.9497
- Castella B, Riganti C, Fiore F, Pantaleoni F, Canepari ME, Peola S, et al. Immune modulation by zoledronic acid in human myeloma: An advantageous cross-talk between Vgamma9Vdelta2 T cells, alphabeta CD8+ T cells, regulatory T cells, and dendritic cells. J Immunol 2011; 187:1578-90; https://doi.org/10.4049/jimmunol.1002514
- Liu H, Wang SH, Chen SC, Chen CY, Lo JL, Lin TM. Immune modulation of CD4+CD25+ regulatory T cells by zoledronic acid. BMC Immunol 2016; 17:45; PMID:27887569; https://doi.org/10.1186/s12865-016-0183-7
- Dobin A, Davis CA, Schlesinger F, Drenkow J, Zaleski C, Jha S, Batut P, Chaisson M, Gingeras TR. STAR: Ultrafast universal RNA-seq aligner. Bioinformatics 2013; 29:15-21; PMID:23104886; https://doi.org/10.1093/bioinformatics/bts635
- Robinson MD, McCarthy DJ, Smyth GK. edgeR: A Bioconductor package for differential expression analysis of digital gene expression data. Bioinformatics 2010; 26:139-40; PMID:19910308; https://doi.org/10.1093/bioinformatics/btp616
- Ligtenberg MA, Mougiakakos D, Mukhopadhyay M, Witt K, Lladser A, Chmielewski M, Riet T, Abken H, Kiessling R. Coexpressed catalase protects chimeric antigen receptor-redirected T cells as well as bystander cells from oxidative stress-induced loss of antitumor activity. J Immunol 2016; 196:759-66; PMID:26673145; https://doi.org/10.4049/jimmunol.1401710
- Oh-hora M, Rao A. The calcium/NFAT pathway: Role in development and function of regulatory T cells. Microbes Infect 2009; 11:612-9; PMID:19375514; https://doi.org/10.1016/j.micinf.2009.04.008
- Wu Y, Borde M, Heissmeyer V, Feuerer M, Lapan AD, Stroud JC, Bates DL, Guo L, Han A, Ziegler SF, et al. FOXP3 controls regulatory T cell function through cooperation with NFAT. Cell 2006; 126:375-87; PMID:16873067; https://doi.org/10.1016/j.cell.2006.05.042
- Hu H, Djuretic I, Sundrud MS, Rao A. Transcriptional partners in regulatory T cells: Foxp3, Runx and NFAT. Trends Immunol 2007; 28:329-32; PMID:17618833; https://doi.org/10.1016/j.it.2007.06.006
- Marie JC, Letterio JJ, Gavin M, Rudensky AY. TGF-beta1 maintains suppressor function and Foxp3 expression in CD4+CD25+ regulatory T cells. J Exp Med 2005; 201:1061-7; PMID:15809351; https://doi.org/10.1084/jem.20042276
- Islas-Vazquez L, Prado-Garcia H, Aguilar-Cazares D, Meneses-Flores M, Galicia-Velasco M, Romero-Garcia S, Camacho-Mendoza C, Lopez-Gonzalez JS. LAP TGF-Beta Subset of CD4(+)CD25(+)CD127(-) treg cells is increased and overexpresses LAP TGF-beta in lung adenocarcinoma patients. BioMed Res Int 2015; 2015:430943; PMID:26582240; https://doi.org/10.1155/2015/430943
- Saito T, Nishikawa H, Wada H, Nagano Y, Sugiyama D, Atarashi K, Maeda Y, Hamaguchi M, Ohkura N, Sato E, et al. Two FOXP3(+)CD4(+) T cell subpopulations distinctly control the prognosis of colorectal cancers. Nat Med 2016; 22:679-84; PMID:27111280; https://doi.org/10.1038/nm.4086
- Zhou H, Chen L, You Y, Zou L, Zou P. Foxp3-transduced polyclonal regulatory T cells suppress NK cell functions in a TGF-beta dependent manner. Autoimmunity 2010; 43:299-307; PMID:20166879; https://doi.org/10.3109/08916930903405875
- Wang G, Khattar M, Guo Z, Miyahara Y, Linkes SP, Sun Z, He X, Stepkowski SM, Chen W. IL-2-deprivation and TGF-beta are two non-redundant suppressor mechanisms of CD4+CD25+ regulatory T cell which jointly restrain CD4+CD25- cell activation. Immunol Lett 2010; 132:61-8; PMID:20570629; https://doi.org/10.1016/j.imlet.2010.06.001
- Sharma R, Zheng L, Deshmukh US, Jarjour WN, Sung SS, Fu SM, Ju ST. A regulatory T cell-dependent novel function of CD25 (IL-2Ralpha) controlling memory CD8(+) T cell homeostasis. J Immunol 2007; 178:1251-5; PMID:17237369; https://doi.org/10.4049/jimmunol.178.3.1251
- Gasteiger G, Hemmers S, Firth MA, Le Floc'h A, Huse M, Sun JC, Rudensky AY. IL-2-dependent tuning of NK cell sensitivity for target cells is controlled by regulatory T cells. J Exp Med 2013; 210:1167-78; PMID:23650441; https://doi.org/10.1084/jem.20122462
- Zhou J, You W, Sun G, Li Y, Chen B, Ai J, et al. The Marine-Derived oligosaccharide sulfate MS80, a novel TGF-beta1 inhibitor, reverses TGF-beta1-induced epithelial-mesenchymal transition and suppresses tumor metastasis. J Pharmacol Exp Ther 2016; https://doi.org/10.1124/jpet.116.234799
- Morris JC, Tan AR, Olencki TE, Shapiro GI, Dezube BJ, Reiss M, Hsu FJ, Berzofsky JA, Lawrence DP. Phase I study of GC1008 (fresolimumab): A human anti-transforming growth factor-beta (TGFbeta) monoclonal antibody in patients with advanced malignant melanoma or renal cell carcinoma. PloS One 2014; 9:e90353; PMID:24618589; https://doi.org/10.1371/journal.pone.0090353
- Bachanova V, Cooley S, Defor TE, Verneris MR, Zhang B, McKenna DH, Curtsinger J, Panoskaltsis-Mortari A, Lewis D, Hippen K, et al. Clearance of acute myeloid leukemia by haploidentical natural killer cells is improved using IL-2 diphtheria toxin fusion protein. Blood 2014; 123:3855-63; PMID:24719405; https://doi.org/10.1182/blood-2013-10-532531
- Rech AJ, Mick R, Martin S, Recio A, Aqui NA, Powell DJ, Jr, Colligon TA, Trosko JA, Leinbach LI, Pletcher CH, et al. CD25 blockade depletes and selectively reprograms regulatory T cells in concert with immunotherapy in cancer patients. Sci Transl Med 2012; 4:134ra62; PMID:22593175; https://doi.org/10.1126/scitranslmed.3003330
- Ghiringhelli F, Menard C, Puig PE, Ladoire S, Roux S, Martin F, Solary E, Le Cesne A, Zitvogel L, Chauffert B. Metronomic cyclophosphamide regimen selectively depletes CD4+CD25+ regulatory T cells and restores T and NK effector functions in end stage cancer patients. Cancer Immunol Immunother 2007; 56:641-8; PMID:16960692; https://doi.org/10.1007/s00262-006-0225-8
- Ganguly B, Balasa B, Efros L, Hinton PR, Hartman S, Thakur A, et al. The CD25-binding antibody daclizumab high-yield process has a distinct glycosylation pattern and reduced antibody-dependent cell-mediated cytotoxicity in comparison to Zenapax(R). mAbs 2016: 0.
- Colleoni M, Gray KP, Gelber S, Lang I, Thurlimann B, Gianni L, et al. Low-dose oral cyclophosphamide and methotrexate maintenance for hormone receptor-negative early breast cancer: International Breast Cancer Study Group Trial 22-00. J Clin Oncol 2016; https://doi.org/10.1200/JCO.2015.65.6595
- Zeiser R, Nguyen VH, Beilhack A, Buess M, Schulz S, Baker J, Contag CH, Negrin RS. Inhibition of CD4+CD25+ regulatory T-cell function by calcineurin-dependent interleukin-2 production. Blood 2006; 108:390-9; PMID:16522809; https://doi.org/10.1182/blood-2006-01-0329
- Fukushima K, Ikehara Y, Yamashita K. Functional role played by the glycosylphosphatidylinositol anchor glycan of CD48 in interleukin-18-induced interferon-gamma production. J Biol Chem 2005; 280:18056-62; PMID:15760905; https://doi.org/10.1074/jbc.M413297200