
ABSTRACT
Low fusion efficiency and nominal activity of fusion cells (FCs) restrict the clinical application of dendritic cell (DC)/tumor fusion cells. Collagen I (Col I) is an interstitial collagen with a closely-knit structure used to repair damaged cell membranes. This study evaluated whether Col I could improve the fusion efficiency of polyethylene glycol (PEG)-induction and enhance the immunogenicity of fusion vaccine. DC/B16 melanoma and controlled DC/H22 hepatoma cell fusions were induced by PEG with or without Col I. Col I/PEG treatment increased the levels of DC surface molecules and the secretion of lactate, pro- and anti-inflammatory cytokines in fusion cells. Col I/PEG-treated FCs enhanced T-cell proliferation and cytotoxic T lymphocyte activity. The Col I-prepared fusion vaccine obviously suppressed tumor growth and prolonged mice survival time. Thus Col I treatment could significantly improve the efficiency of PEG-induced DC/tumor fusion and enhance the anticancer activity of the fusion vaccine. This novel fusion strategy might promote the clinical application of DC/tumor fusion immunotherapy.
Introduction
Cancer is a major cause of morbidity and mortality worldwide.Citation1 Anticancer immunotherapy is a relatively new concept, which represents a promising option for treating cancer patients.Citation2 Dendritic cells (DCs) are powerful antigen-presenting cells (APCs) that play a critical role in inducing and regulating anti-tumor immune responses.Citation3 Thus, DCs are key targets in cancer vaccine design. To obtain tumor-specific vaccines, tumor antigens have been imported into DCs in the form of purified proteins or peptides, tumor cell lysates, and tumor-related genes or mRNAs.Citation4-6 However, these strategies are restricted by the limited number of known tumor genes or antigens.
An alternative strategy is based on fusion of DCs and whole cancer cells.Citation7 Upon fusion, the cytoplasm of DCs and cancer cells are integrated, whereas their nuclei remain separate.Citation8 Thus, fusion cells can perform the functions of both cell types without any functional damage. This strategy allows DCs to present the entire antigen profile of cancer cells. Fusion cells trigger a second signaling pathway to induced cytotoxic T lymphocytes (CTLs) to suppress tumor cell viability and growth.Citation9 Moreover, a DC/tumor fusion cell vaccine could promot DC maturation.Citation10 Compared with other DC-based vaccines, a DC-tumor fusion cell vaccine could induce greater T-cell activation and demonstrate more evident anti-tumor activity.Citation11,12
The application of DC/tumor fusion cell vaccines for the treatment of patients with advanced cancers could improve these patients' quality of life and prolong their survival.Citation13,14 However, activated T cells and their anti-tumor effects vary greatly among patients, which is related to low fusion efficiency and poor immunogenicity after fusion.Citation15 At present, 3 approaches are available for inducing DC-tumor fusion cells. These approaches include the biologic approach (i.e., virus-induced fusion), the chemical approach (i.e., polyethylene glycol [PEG]-induced fusion), and the physical approach (i.e., electroporation-induced fusion). However, these strategies can only achieve about 20–42% fusion of cells.Citation16,17 Developing new techniques to improve fusion efficiency and enhance the anti-tumor effect of DC/tumor fusion vaccines is extremely important. However, no strategy for improving fusion efficiency is yet available.
The collagens are a group of glycoproteins with various molecular weights that exhibit a certain viscosity in aqueous solution.Citation18 Collagen I (Col I) is an interstitial collagen that exhibits a closely-knit structure. It is adhesive and resistant to molecular tension on the cell surface and is used to repair damaged tissue. Col I delivers extracellular signals within the extracellular microenvironment and stabilizes the structure of the phospholipid bilayer of the cell membrane.Citation19,20 Moreover, Col I up-regulates the expression of CXCL−1 and CXCL−2 in DCs, which in turn stimulates neutrophil migration to the local tumor area, altering the tumor microenvironment and repairing damaged cell membranes.Citation21,22 Based on these known properties of Col I, we hypothesized that Col I might function in stabilizing the fusion membrane and improve fusion efficiency, thereby enhancing the anti-tumor effects of DC/tumor fusion cells. The present study was designed to test this hypothesis.
Results
Col I/PEG enhanced the fusion efficiency of DC/B16 cells and DC maturation
First, fusion efficiency was evaluated by flow cytometry and fluorescence microscopy. B16 melanoma cells were stained with carboxyfluorescein succinimidyl ester (CFSE; green) and DCs were stained with PKH26 (red). Upon fusion, the cytoplasm should appear orange under fluorescence microscopy. Data from flow cytometric analysis showed that the percentage of Col I/PEG-treated fusion cells was over 80%, whereas the percentage of PEG-treated fusion cells was around 22%. The fusion efficiency was significantly higher in the Col I/PEG-induced DC/B16 fusion cells compared with the fusion efficiency in PEG-only-induced fusion cells ( and ). Fluorescence microscopy indicated consistent and similar findings ().
Figure 1. Col I/PEG enhanced DC/B16 cell fusion efficiency and DC maturation. To determine fusion efficiency, B16 cells were stained with CFSE and immature DCs were stained with PKH26. PEG-DC/B16 and Col I/PEG-DC/B16 fusion cell vaccines were prepared with PEG in the presence or absence of Col I. (A) Fusion efficiency was assessed according to the percentage of double positive cells. The results of one representative experiment (n = 5) are shown. (B) Quantitative analysis of flow cytometric results. The percentage of Col I/PEG-treated fusion cells was over 80%, whereas the percentage of PEG-treated fusion cells was around 22%. (C) Fusion cells were observed under a fluorescence microscope. Green fluorescence indicated B16 cells, red fluorescence indicated DCs, and blue fluorescence showed nuclei. The arrows indicated fusion cells. Original magnification, × 400. (D) Flow cytometric analysis of the expression of CD80, CD86, MHC class I, and MHC class II on CD11c+ cells. (E) ELISA detection of cytokines TNF-α, IL-6, IL-1β, IFN-β, IL-12p70 and IL-10 secreted by mature DCs. The asterisks indicated significant differences between the Col I/PEG-DC/B16 group and other groups as follows: *p < 0.05, **p < 0.01, ***p < 0.001, ****p < 0.0001, N.S. (no significant).
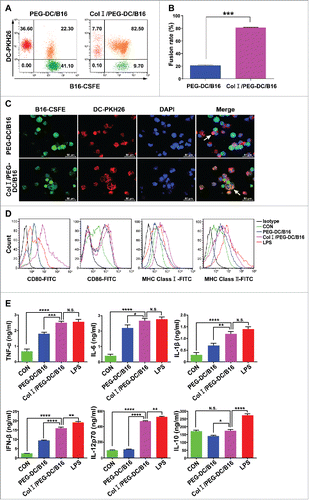
The expression of various surface molecules and cytokines was examined to determine whether Col I/PEG treatment affected the maturation of DCs. The levels of various surface molecules, including CD80, CD86, and major histocompatibility complex class I (MHC I) and major histocompatibility complex class II (MHC II) on Col I/PEG-induced DC/B16 fusion cells were higher than those on the PEG-induced DC/B16 fusion cells or immature DCs, but were comparable to those on lipopolysaccharide (LPS)-treated DCs (). Also, the levels of pro- and anti-inflammatory cytokines secreted by DCs were evaluated and the results were consistent with the findings for the surface molecules. Col I/PEG treatment significantly increased the expression levels of tumor necrosis factor (TNF)-α, interleukin (IL)-6, IL-1β, interferon (IFN)-β, and IL-12p70, but not IL-10 (), indicating the activation of T helper (Th) 1, but not the Th2 immune response.
Next, the effects of Col I/PEG treatment on antigen presentation and migration of DCs were evaluated. The results indicated that uptake of fluorescein isothiocyanate (FITC)-labeled dextran by mature DCs was attenuated in Col I/PEG-induced fusion cells. Col I/PEG-induced fusion cells showed a trend in endocytosis similar to that in LPS-treated DCs (Fig. S1A). The expression level of CCR7 was also significantly higher in the Col I/PEG-DC/B16 group compared with the PEG-DC/B16 group, whereas no statistically significant difference was observed between the Col I/PEG-DC/B16 group and the LPS group (Fig. S1, B and C). CCR7 is expressed in mature DC, which plays an important role in the migration of DC to lymphoid tissue. CCL21 and CCL19 are the ligands of CCR7, which are mainly expressed in lymphoid organs and mediate the migration of DC from the tissues to the draining lymph nodes. Therefore, the expression of DC on the surface of CCR7 increased, which indirectly reflected the enhancement of migration ability of DC.
Col I/PEG-treated DC/B16 fusion cells enhanced T-cell proliferation and function
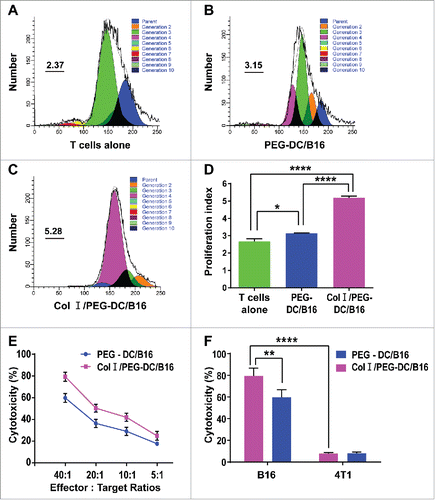
We also investigated the effect of Col I/PEG-treatment of DCs on fusion cell-induced T-cell proliferation. The proliferation index (PI) indicate cell proliferation activity index, the formula is: PI = (S+G2 / M) / (Go / G1+S+G2 / M). PI of the T cells in the Col I/PEG-DC/B16 group reached 5.28, and the greatest amount of differentiation occurred after the 4th passage. By comparison, the PI in the PEG-DC/B16 group was 3.15, with cell differentiation mainly occurring after the 3rd passage. The PI of the T cells alone (control group) was only 2.37, with cell differentiation occurring mainly after the 3rd passage ( to ). These data showed that T-cell proliferation was significantly greater in the Col I/PEG-DC/B16 group than in the other 2 groups.
Figure 2. Col I/PEG-treated DC/B16 fusion cells enhanced T-cell proliferation and cytotoxic T-cell killing function. T cells isolated from the lymphocytes of C57BL/6 mouse spleens were mixed with PEG-DC/B16 and Col I/PEG-DC/B16 fusion cells separately at a ratio of 10:1. (A-C) T cells were labeled with CFSE and co-cultured with PEG-DC/B16 or Col I/PEG-DC/B16 for 5 d and the proliferation index (PtdIns) in different groups was determined. A representative experiment (n = 3) is shown. (D) The PI of the Col I/PEG-DC/B16 group was compared with the PEG-DC/B16 group and T cells alone group. (E) Determination of the killing effect of CTLs induced separately by Col I/PEG-DC/B16 or PEG-DC/B16 on 51Cr-labeled B16 cells at an effector-target ratio of 40:1, 20:1, 10:1, or 5:1. (F) Determination of the killing effect of CTLs induced separately by Col I/PEG-DC/B16 or PEG-DC/B16 on 51Cr-labeled B16 cells and 4T1 cells (as a negative control) at an effector-target ratio of 40:1. The asterisks indicated significant differences between the Col I/PEG-DC/B16 group and other groups as follows: *p < 0.05, **p < 0.01, ****p < 0.0001.
The percentage of CD4+ T cells and CD8+ T cells that secreted IFN-γ in the Col I/PEG-DC/B16 group was significantly higher than that in the PEG-DC/B16 group (19.08 ± 2.23% vs. 9.03 ± 1.08% of CD4+ cells; and 19.22 ± 4.26% vs. 9.55 ± 2.02% of CD8+ cells; Fig. S2).
The killing rates of CTLs activated by either Col I/PEG-DC/B16 or PEG-DC/B16 cells were calculated and compared according to the formula defined in the Methods.The killing rates of CTLs activated by Col I/PEG-DC/B16 were about 80% and the killing rates of CTLs activated by Col I/PEG-DC/B16 were about 60% at an effector-target ratio of 40:1. CTLs specifically killed B16 cells, but T cells induced by Col I/PEG-DC/B16 fusion cells showed significantly greater cytotoxicity to B16 cells compared with T cells induced by PEG-DC/B16 ( and ).
Col I/PEG treatment increased the anti-tumor activity of DC/tumor fusion cell vaccines by inhibiting proliferation and promoting apoptosis of tumor cells
The anti-tumor activities of DC/B16 fusion cells were evaluated in vivo according to changes in tumor size and mouse survival. Tumor growth was suppressed in the Col I/PEG-DC/B16 group compared with the control groups after treatment (). The survival curves showed a median survival time of 47.5 d in the Col I/PEG-DC/B16 group, 38.5 d in the PEG-DC/B16 group, and 23.5 d in the phosphate-buffered saline (PBS) group, indicating that the tumor-bearing mice in the Col I/PEG-DC/B16 group survived longer than mice in the other 2 groups (). We also examined Col I/PEG-treated DC/H22 fusion cells and observed similar results for anti-hepatocellular carcinoma activity in mice. Tumor growth was suppressed in the Col I/PEG-DC/H22 group compared with the control groups (Fig. S3A). The survival curves showed a median survival time of 61.5 d in the Col I/PEG-DC/H22 group, 50.5 d in the PEG-DC/H22 group, and 30 d in the PBS group, indicating that tumor-bearing mice in the Col I/PEG-DC/H22 group survived longer than mice in the other 2 groups (Fig. S3B).
Figure 3. Anti-tumor activity of the Col I/PEG-treated DC/B16 fusion cell vaccine in vivo. Melanoma-bearing mice were treated with fusion cells (5 × 10⁶) induced by PEG with or without Col I, or PBS every 7 d (3 treatments) for a total of 21 d. (A) Tumor volume and (B) survival were determined. The asterisks indicated a significant difference between the Col I/PEG-DC/B16 group and the PEG-DC/B16 group (*p < 0.05). (C-E) Expression of PCNA was detected by immunohistochemistry. A representative experiment (n = 5) is shown. Original magnification, × 400. The arrows indicated the expression of PCNA. (F) Quantification of PCNA expression. (G-J) Apoptosis was analyzed by TUNEL assay and the arrows indicate apoptotic tumor cells. Original magnification, × 400. The asterisks indicated significant differences as follows: *p < 0.05, **p < 0.01, ***p < 0.001.
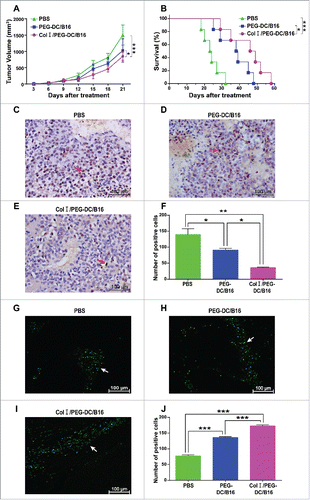
Proliferation and apoptosis were examined in tumor tissues. The average number of proliferating cell nuclear antigen (PCNA)-positive cells determined by microscopy was 36 in the Col I/PEG-DC /B16 group, 91 in the PEG-DC/B16 group, and 140 in the PEG-DC/B16 group, suggesting that tumor cell proliferation was significantly suppressed in the Col I/PEG-DC/B16 group compared with the PEG-DC/B16 group (). TUNEL assay results showed that the average number of apoptotic cells was 173 in the Col I/PEG-DC /B16 group, 136 in the PEG-DC/B16 group, and 77.7 in the PEG-DC/B16 group, indicating that tumor cell apoptosis occurred significantly more frequently in the Col I/PEG-DC/B16 group compared with the PEG-DC/B16 group ( to ).
Col I/PEG-treated DC/B16 fusion cell vaccines decreased the suppressive immune response of melanoma-bearing mice
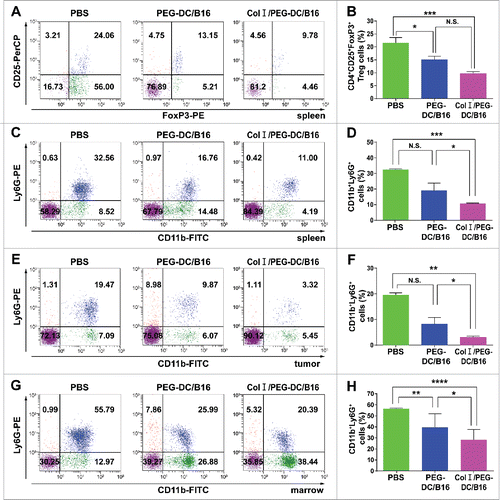
The cellular and humoral immune responses in mice treated with each of the 2 fusion cell vaccines were investigated. Flow cytometry was performed to determine the numbers of CD4+ CD25+ FoxP3+ regulatory T cells (Tregs) in the spleen of tumor-bearing mice and myeloid-derived suppressor cells (MDSCs) in the spleen, tumor, and bone marrow in the different treatment groups. The number of CD4+ CD25+ FoxP3+ Tregs was significantly lower in the Col I/PEG-DC/B16 group compared with the PEG-DC/B16 and PBS groups ( and ). The MDSC percentage in the spleen, tumor, and bone marrow also were significantly lower in the Col I/PEG-DC/B16 group compared with the other 2 groups ( to ). Enzyme-linked immunosorbent assay (ELISA) results showed that serum immunoglobulin G (IgG) levels were significantly higher in the Col I/PEG-DC/B16 group than in the PEG-DC/B16 or PBS groups (Fig. S4).
Figure 4. Col I/PEG-treated DC/B16 fusion cell vaccine decreased the suppressive immune response of melanoma-bearing mice. Melanoma-bearing mice were treated with fusion cells (5 × 10⁶) induced by PEG with or without Col I, or PBS every 7 d for a total of 21 day (3 treatments). Flow cytometric analysis was performed for CD4+ CD25+ FoxP3+ Tregs in the spleen (A, B) and MDSCs in spleen (C, D) tumor (E, F), bone marrow (G, H). A representative experiment (n = 3) is shown. The asterisks indicated significant differences between the Col I/PEG-DC/B16 group and the PEG-DC/B16 group as follows: *p < 0.05, **p < 0.01, ***p < 0.001, ****p < 0.0001, N.S. (no significant).
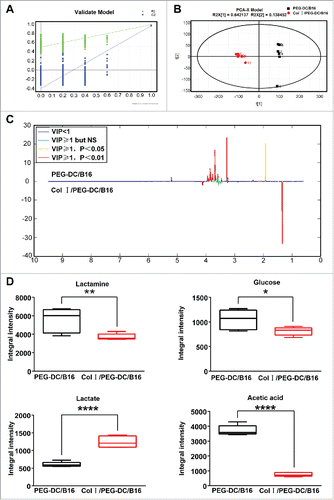
Differences in metabolites after treatment with 2 types of DC/B16 cells
We further analyzed the differentially expressed metabolites in the 2 groups of fusion cells to identify possible metabolites underlying the anti-tumor activities. Differentially expressed metabolites were first screened using principal component analysis (PCA) and partial least squares discriminant analysis (PLS-DA). Samples from the Col I/PEG-DC/B16 and PEG-DC/B16 groups could be differentiated using a score plot established with the PLS-DA model, the reliability of which was confirmed by 400 permutations using 2 main components (). A score plot was generated using an orthogonal PLS (OPLS)-DA model (). Differentially expressed metabolites in the 2 groups were further screened using variable importance projection (VIP), correlation coefficient γ, and load value (). Finally, the lactic acid level was increased and alanine, acetic acid, and glucose levels were decreased in the Col I/PEG-DC/B16 group compared with the PEG-DC/B16 group ().
Figure 5. 1H NMR spectra and differentially expressed metabolites in the Col I/PEG-DC/B16 and the PEG-DC/B16 groups. (A) Four hundred permutations using 2 main components in the PLS-DA model were shown. (B) The separation of 2 main components by OPLS-DA model was shown. A representative experiment (n = 3) is shown. (C, D) Differentially expressed metabolites in 2 groups. Compared with the PEG-DC/B16 group, the lactic acid level in CI/PEG-DC/B16 cells was increased and alanine, acetic acid and glucose decreased. The asterisks indicated significant differences as follow: *p < 0.05, **p < 0.01, ****p < 0.0001.
Discussion
Currently, the application of DC/tumor fusion cell vaccines is restricted by the unstable anti-tumor effect of activated T cells, which is associated with low fusion efficiency and poor immunogenicity after fusion.Citation15,23 The present study showed that Col I could dramatically improve the fusion efficiency (over 80%) of PEG-induced DC/tumor fusion cells and significantly enhance the anti-tumor effects of DC/tumor fusion cell vaccines.
To enhance the anti-tumor immune response, many adjuvants have been used together with DC/tumor fusion cell vaccines in murine models, and excellent responses have been achieved.Citation23 However, these approaches show limited effectiveness in early clinical trials.Citation24,25 Thus, a new technique is required to improve the anti-tumor immune response elicited by DC/tumor fusion cell vaccines. The present study results showed that Col I promoted the fusion of DCs and tumor cells, significantly improving the fusion efficiency. Moreover, Col I treatment increased the expression of DC surface molecules, including CD80, CD86, and MHC class I and II proteins, suggesting that Col I/PEG-DC/B16 can promote the maturation of DC/tumor fusion cells and improve the antigen-presenting ability of DC/tumor fusions. Col I treatment also increased the secretion of cytokines, including TNF-α, IL-6, IL-1β, IFN-β, and IL-12p70, but not IL-10, by Col I/PEG-DC/B16 fusion cells. These results indicated that Col I/PEG-DC/B16 activated the Th1 immune response, but not the Th2 immune response, thus increasing the Th1/Th2 ratio. Increased CCR7 expression by the Col I/PEG-DC/B16 fusion cells suggests that DCs in the Col I/PEG-DC/B16 group have a strong migratory ability.
Both in vivo and in vitro data indicated that the DC/tumor fusion cell vaccine prepared with Col I/PEG was more effective at promoting T-cell proliferation, activating CTLs, increasing effector cytokine IFN-γ secretion, and specifically killing melanoma cells. When the fusion cell vaccine was used for the treatment of melanoma and hepatocellular carcinoma in mice, it promoted tumor cell apoptosis and inhibited proliferation, thus attenuating tumor growth and prolonging the survival of tumor-bearing mice. These findings demonstrate that Col I/PEG treatment might be an ideal strategy for inducing effective DC/tumor fusion for use in fusion cell vaccines.
This study also investigated the anti-tumor immune response to the DC/tumor fusion cell vaccine prepared with induction by Col I/PEG. Tregs and MDSCs are immunoregulatory cells and they maintain the balance of the immune system by decreasing the number of activated CTLs to suppress an excessive immune response.Citation26,27 Our data showed that the high-efficiency DC/tumor fusion cell vaccine induced with Col I/PEG effectively reduced the number of CD4+ CD25+ FoxP3+ Tregs in tumor-bearing mice. The number of Tregs has been reported to be positively correlated with disease progression and negatively correlated with prognosis in patients with melanoma, non-small cell lung cancer, pancreatic cancer, and colorectal cancer.Citation28,29 In the present study, the decline in the number of CD4+ CD25+ FoxP3+ Tregs was positively correlated with tumor size. Previous studies have shown that the percentages of Tregs is elevated in the peripheral blood and spleen in cancer patients compared with the percentage in healthy controls, whereas the number of Th1 cells is reduced and the Th1/Th2 ratio is lower.Citation28,29 Thus, fewer naive T cells will differentiate into CTLs. Moreover, Tregs can inhibit B lymphocytes and natural killer cells, which is why the immune systems of cancer patients are unable to clear tumor cells alone. Combined with our in vitro data, our in vivo experiments demonstrated that the Col I/PEG-DC/B16 fusion cell vaccine might protect mice from melanoma by increasing the Th1/Th2 ratio and promoting CTL differentiation. This is consistent with the findings of previous studies showing that a decrease in the number of Tregs enhances the anti-tumor effect and effectively improves prognosis.Citation30,31
The effect of the fusion cell vaccine induced by Col I/PEG on humoral immunity was also investigated. Our data showed that fusion cells also stimulated IgG secretion by B lymphocytes, suggesting that Col I/PEG-DC/B16 can activate humoral immunity in mice. This is consistent with the finding of a previous study reporting that a DC/tumor fusion cell vaccine can activate both cellular immunity and humoral immunity in patients with multiple myeloma and thereby exhibit an anti-tumor effect.Citation32 In the presence of Tregs, although Th cells can help activate B cells, B cells reportedly cannot differentiate into antibody-producing plasma cells.Citation33 CD4+ CD25+ FoxP3+ Tregs directly inhibit the secretion of IgA and IgG by normal B lymphocytes.Citation34 In the present study, the number of CD4+ CD25+ FoxP3+ Tregs was significantly reduced, indicating that Col I/PEG-DC/B16 may alleviate the inhibition of B lymphocytes and thus promote IgG secretion by decreasing the number of CD4+ CD25+ FoxP3+ Tregs.
NMR metabolomics is a newly developed ‘omics' technology that offers a novel high-throughput method for analysis of endogenous metabolites. This technique uses NMR spectroscopy to detect small molecule metabolites in samples. Our study examined water-soluble metabolites in fusion cells and findings indicated that lactic acid levels were higher in fusion cells induced with Col I and PEG compared with those induced with PEG only. An acidic environment, such as that created by high lactic acid levels whether in or outside cells, can enhance antigen uptake by DCs and up-regulate the expression of MHC and co-stimulatory molecules.Citation35-37 Our data suggest that the enhanced DC functions of fusion cells prepared with Col I and PEG might be associated with the increased lactate level in these cells.
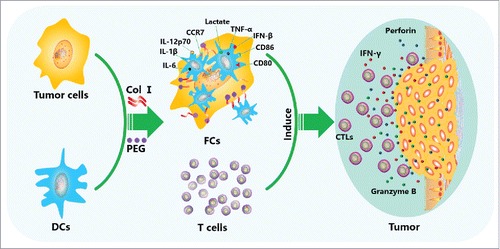
In conclusion, this study demonstrates that PEG can make the membrane lipid molecules of 2 adjacent cells evacuated and reorganized, relying on the bimolecular layer of membrane mutual affinity and the role of their surface tension, cells are fused. Collagen I can make the fusion cell membrane tighten, repair the cell membrane, thus forming a stable and efficient fusion cells.This highly stable DC/tumor fusion cell vaccine up-regulates the expression of DC surface molecules and promotes the secretion of lactate, IL-6, IL-β, TNF-α, IFN-β, and IL-12p70 in fusion cells. Thus, this vaccine offers more effective tumor antigen presentation by DCs to efficiently stimulate T-cell proliferation and activation, resulting in increased killing of tumor cells (). This novel technique provides a promising strategy for efficient preparation of a DC/tumor fusion cell vaccine and might promote the clinical application of DC/tumor fusion cell vaccine immunotherapy.
Figure 6. Anti-tumor mechanism of the DC/tumor fusion cell vaccine induced by Col I/PEG. Col I/PEG promotes the expression of DC surface molecules, including CD80, CD86, CCR7, and MHC class I and II proteins, and significantly increases the secretion of lactate and cytokines IL-6, IL-1β, TNF-α, IFN-β, and IL-12p70 in fusion cells, thus promoting the maturation of DC/tumor fusion cells, enhancing the antigen presentation ability of DCs and activating T cells more efficiently, which resulted in higher anti-tumor activity.
Materials and methods
Animals and cells
Female C57BL/6 mice (phenotype H-2Kb; age 4–6 weeks) were purchased from Beijing Charles River Company. Female BLBA/c mice (age 4–6 weeks) were purchased from the Experimental Animal Center of Guangxi Medical University. All experimental procedures complied with the requirements of the National Animal Guidelines and all protocols were approved by the Ethics Committee of Guangxi Medical University. The C57BL/6 B16 mouse melanoma cell line was preserved in our laboratory. Mouse 4T1 breast cancer cells and the mouse hepatoma cell line were purchased from the Cell Bank of Committee for Type Culture Collection of the Chinese Academy of Sciences.
Preparation of DCs and DC/B16 fusion cells
Bone marrow cells were isolated from the femur and tibia of C57BL/6 mice and cultured in the growth medium which RPMI 1640 medium (HyClone, Thermo Fisher Scientific, Waltham, MA, USA) containing 10% fetal bovine serum (FBS, HyClone), 10 ng/mL IL-4, 10 ng/mL of granulocyte macrophage colony-stimulating factor (GM-CSF; PeproTech Inc. Rocky Hill, NJ, USA), 100 U/mL streptomycin, and 100 U/mL penicillin (culture medium). Non-adherent and loosely adherent cells after culturing for 5 d were designated as immature DCs.
Immature DCs and B16 cells or hepatocellular carcinoma cells were mixed at a ratio of 2:1 and incubated in the presence of 300 μL PEG at 37°C for 5 minutes, and then rinsed with slowly added 30 mL RPMI 1640 medium for washing 2 times. The fusion cells were resuspended in the growth medium and cultured for 5 d to obtain the Col I/PEG-DC/B16 fusion cell vaccine.
Immature DCs and B16 cells or hepatocellular carcinoma cells were mixed at a ratio of 2:1 and incubated in the presence of 300 μL PEG (MW 3000; Sigma, St. Louis, MO, USA) at 37°C for 5 minutes, and then rinsed with slowly added 30 mL RPMI 1640 medium for twice, further resuspended in 500 μL PBS and incubated with 5 ng/mL (final concerntration) of Col I (Sigma, Louis, MO, USA) at 37°C for another 30 minutes. After washing with RPMI 1640 medium for twice. The fusion cells were resuspended in growth medium and cultured for 5 d to obtain the Col I/PEG-DC/B16 fusion cell vaccine.
When evaluating the fusion efficiency, B16 cells were stained with 5 μM (final concerntration) of CFSE (Invitrogen Life Technologies, Carlsbad, CA, USA) for 20 minutes at 37 ℃, added 10 mL complete culture medium to the cells and incubated for 5 minutes. Centrifugated to removes any free dye and washed the cells 2 times with 10 mL complete culture medium. Immature DCs were stained with 2 μM (final concerntration) of PKH26 (Sigma, Louis, MO, USA) for 5 minutes at 37℃, stoped the staining by adding 2 mL FBS and incubated for 1 minute, washed the cells 3 times with 10 mL complete culture medium. Fusion efficiency was evaluated using flow cytometry (Beckman Coulter Epics XL; Beckman, Brea, CA, USA) and fluorescence microscopy (Nikon ECLIPSE 80i; Nikon, Tokyo, Japan).
Surface molecule expression and cytokine secretion by DCs
DC/B16 fusion cells induced by PEG with or without Col I were cultured for 10 days, and the supernatant fractions and cells were collected separately. DCs without treatment were set as a negative control, and DCs treated with 50 ng/mL LPS were set as a positive control. Fusion cells were incubated with FITC-labeled monoclonal anti-mouse CD80, CD86, MHC class I, and MHC class II antibodies (all from eBiosciences, San Diego, CA, USA) and then subjected to flow cytometry. The supernatant fractions were subjected to ELISA to detect the levels of IL-1β, IL-6, IL-10, IL-12p70, TNF-α, IFN-β and other cytokines using commercial kits (Dakewe Co. Shenzhen, China).
Antigen uptake and migration of fusion cells
Antigen uptake and migration of DCs were analyzed as described previously.Citation38 DC/B16 fusion cells induced by PEG with or without Col I were cultured for 10 d and incubated with FITC-labeled Dextran (1 μg/μL; eBiosciences, San Diego, CA, USA) for 45 mimutes at 4°C and 37°C, respectively. Then the cells were subjected to flow cytometry to detect antigen uptake. The migration of fusion DCs was analyzed by incubating the collected cells with a PE-labeled monoclonal anti-mouse CCR7 antibody and PE-Cyanine5-labeled monoclonal anti-mouse CD11c antibody (eBiosciences, San Diego, CA, USA) and then detected with flow cytometry. DCs that were not treated were set as a negative control and DCs treated with 50 ng/ml LPS were set as a positive control.
Assay for T-cell activation and IFN-γ release
T cells isolated from the lymphocytes of C57BL/6 mouse spleens were labeled with CFSE and mixed with PEG-DC/B16 and Col I/PEG-DC/B16 fusion cells separately at a ratio of 10:1. The mixtures were maintained with culture medium for 5 d. T cells not exposed to fusion cells served as a control. Decay of CFSE fluorescence was determined by flow cytometry.
To measure IFN-γ release, mixed cells (fusion cells: T cells at1:10 ratio) were cultured for 7 days, and T cells were collected. Brefeldin A (MultiSciences Biotech Co,. Ltd. Hangzhou, China) was applied 6 hours before the collection of T cells. The collected T cells were incubated with monoclonal anti-mouse CD4-PE-Cy5 and CD8-PE antibodies (eBiosciences, San Diego, CA, USA) at 4°C for 30 minutes and then fixed at 4°C for 30 minutes according to the manufacturer's instructions. Finally, the cells were stained with an anti-mouse IFN-γ–FITC monoclonal antibody (eBiosciences, San Diego, CA, USA) at 4°C for 30 minutes and analyzed by flow cytometry.
Cytotoxic T-cell killing assay
T cells were mixed with Col I/PEG-DC/B16 or PEG-DC/B16 and cultured for 7 d in the presence of 20 U/mL of mouse IL-2. Effector cells were collected using nylon wool chromatography. B16 cells and 4T1 control cells were labeled with 51Cr (China-isotope Co,. Ltd. Beijing, China) and incubated with effector cells at 37°C for 1 hour at an effector-target ratio of 40:1, 20: 1, 10:1, or 5:1. Then the cells were washed 3 times with RPMI 1640 medium, and 2 × 10⁴ target cells were co-cultured with effector cells at 37°C for 5 hours. The supernatant fraction was collected for analysis of 51Cr release with a γ counter. A spontaneous release group without effector cells was set as a blank and a maximum release group with target cells treated with 0.1% Triton X-100 was also set. The percent specific release was determined as [(experimental-spontaneous)/ (maximum-spontaneous)].
Tumor-bearing mouse model
A melanoma mouse model was established by inoculating B16 cells (5 × 10⁶ cells/100 μL) in logarithmic growth phase into the left lower quadrant of individual C57BL/6 mice. A hepatoma mouse model was established by inoculating H22 cells (2 × 10⁶ cells/100 μL) in logarithmic growth phase into the left lower quadrant of individual BABL/c mice. Seven days after inoculation, 50 mice were randomized into 5 groups (n = 10 mice per group) as follows: Col I/PEG-DC/B16, PEG-DC/B16, Col I/PEG-DC/H22, PEG-DC/H22, and PBS control. Mice were injected with 5 × 10⁶ fusion cells induced by PEG with or without Col I or PBS for 21 d every 7 d (3 treatments) through tail vein. The long diameter (dl) and short diameter (d2) of tumors were measured with Vernier calipers a total of 7 times measured every 3 d. Tumor size was calculated as d1 × (d2)Citation2 × 0.5. The survival rate of mice was recorded.
Quantification of Tregs and MDSCs
T cells from the spleens of mice were incubated with CD4-FITC and CD25-PE-Cy5 monoclonal antibodies (eBiosciences, San Diego, CA, USA) at 4°C for 30 min. Then the cells were stained at 4°C for 30 min for intracellular FoxP3 using a FoxP3 test kit (eBiosciences, San Diego, CA, USA) according to the manufacturer's protocol and analyzed by flow cytometry. Cells isolated from the spleen, tumor tissue, and bone marrow of mice were stained with CD11b-FITC and Ly6G-PE monoclonal antibodies (eBiosciences, San Diego, CA, USA), and flow cytometry was performed to determine the number of myeloid-derived suppressor cells (MDSCs) in different tissues.
Secreted IgG levels in tumor-bearing mice
Five days after the third administration of fusion cells, blood was collected from the eyes of the mice. After coagulation, the blood samples were centrifuged at 4000 rpm for 20 minutes and the supernatant fraction was collected and stored at −20°C until analysis. IgG levels in the supernatant fractions were determined using ELISA (Dakewe Co., Shenzhen, China) according to the manufacturer's instructions.
Immunohistochemistry and apoptosis assay
After fusion cell administration, tumor tissues were collected from each group and fixed, dehydrated, and embedded in paraffin using conventional methods. Paraffin-embedded sections were incubated at 4°C for 16 hours with a PCNA monoclonal antibody (1: 200 dilution, Boster Bio-Technology Co., Wuhan, China). Apoptotic cells were quantified using a TUNEL kit (Roche Diagnostics, Hoffmann-La Roche, Basel, Switzerland) according to the manufacturer's instructions and results were observed under a fluorescence microscope (Nikon ECLIPSE 80i).
NMR metabolomics
DC/B16 fusion cells were cultured for 5 d and collected by centrifugation at 1000 rpm for 5 minutes. The cells were then resuspended in 10 mL of pre-cooled quenching solution (60% methanol + 0.85% ammonium bicarbonate) at -40°C and centrifuged at 1000 rpm for 1 minute .39,40 The cells were resuspended in 2 mL cold methanol, and then 2 mL chloroform and 1.4 mL pure water were added. The mixture was mixed violently for 5 minutes, allowed to stand for 15 minutes, and then centrifuged at 14000 rpm at 4°C for 30 mimutes. The aqueous extracts were used for further analysis.Citation41 Samples were freeze-dried before 1H NMR detection. Freeze dried samples were dissolved in 450 μL D2O and 50 μl buffer (1.5 M dipotassium hydrogen phosphate + 0.375 M sodium dihydrogen phosphate, pH 7.4, containing 0.1% trisodium phosphate (TSP) and 0.2% sodium azide).Citation42 After mixing by vortex, the solution was centrifuged at 14000 rpm at 4°C for 5 minutes to remove insoluble substances, and the supernatant fraction was moved to a 5-mm NMR tube for subsequent analysis.
Statistical analysis
Statistical analysis was performed using analysis of variance (ANOVA) and paired t test. Survival was analyzed using the Kaplan–Meier test and a p < 0.05 was considered statistically significant. All flow cytometric analyses were performed on a Beckman Coulter flow cytometer, and data were analyzed using the EXPO32 software program (Beckman Coulter, USA).
The phases and baselines of all NMR spectra were adjusted using MestReNova software (Ver. 6.0.2–5475, Mestrelab Research SL, Santiago de Compostela, Spain). Data were pre-processed using MATLAB 2014a (Ver. 8.2.0.701, The MathWorks, Inc., MA, USA) and normalized using the probability quotient normalization (PQN) method. Following piecewise integration and pre-processing, data were imported to SIMCA-P + software (Ver. 12.0, Umetrics, Umeå, Sweden) for multivariate analysis and pattern recognition analysis. Non-parametric statistical tests (one-way ANOVA and Fisher's LSD multiple test) were performed with GraphPad Prism 6 (Ver. 6.01, GraphPad Software, Inc., CA, USA) to analyze the differential molecules. A metabolic network of differential molecules was obtained through enrichment analysis using the database PATHWAY of KEGG (Kyoto Encyclopedia of Genes and Genomes). A relevant metabolic network diagram was generated with MetScape to show the connections of differentially expressed molecules.
Disclosure of potential conflicts of interest
No potential conflicts of interest were disclosed
Supplementary_materials.docx
Download MS Word (1.6 MB)Funding
This work was supported, in part, by grants from Programs for Changjiang Scholars and Innovative Research Team in University (No. IRT_15R13); Key Project of National Natural Scientific Foundation of China (No. 81430055); International Cooperation Project of the Ministry of Science and Technology of China (No. 2015DFA31320); the Project for Innovative Research Team in Guangxi Natural Science Foundation (2015GXNSFFA139001); the Project of Science and Technology of Guangxi (Nos. 14125008–2–12 and 1599005–2–10); Guangxi Natural Science Foundation (2015GXNSFAA139217 and 2016GXNSFAA380231); The Scientific Research Fund of Guangxi Education Department (No. YB2014057) and Guangxi Education Department Grant entitled “Innovation Project of Guangxi Graduate Education.”
References
- Meyskens FJ, Mukhtar H, Rock CL, Cuzick J, Kensler TW, Yang CS, Ramsey SD, Lippman SM, Alberts DS. Cancer prevention: Obstacles, challenges and the road ahead. J Natl Cancer Inst. 2016;108(2):17-24. doi:10.1093/jnci/djv309. PMID:26547931
- Romero P, Banchereau J, Bhardwaj N, Cockett M, Disis ML, Dranoff G, Gilboa E, Hammond SA, Hershberg R, Korman AJ, et al. The human vaccines project: A roadmap for cancer vaccine development. Sci Transl Med. 2016;8(334):334p-39p. doi:10.1126/scitranslmed.aaf0685. PMID:27075624
- Sabado RL, Bhardwaj N. Cancer immunotherapy: Dendritic-cell vaccines on the move. Nature. 2015;519(7543):300-01. doi:10.1038/nature14211. PMID:25762139
- Nestle FO, Alijagic S, Gilliet M, Sun Y, Grabbe S, Dummer R, Burg G, Schadendorf D. Vaccination of melanoma patients with peptide- or tumor lysate-pulsed dendritic cells. Nat Med. 1988;4(3):328-32. doi:10.1038/nm0398-328. PMID:9500607
- Kranz LM, Diken M, Haas H, Kreiter S, Loquai C, Reuter KC, Meng M, Fritz D, Vascotto F, Hefesha H, et al. Systemic RNA delivery to dendritic cells exploits antiviral defence for cancer immunotherapy. Nature. 2016;534(7607):396-01. doi:10.1038/nature18300. PMID:27281205
- Garg AD, Vandenberk L, Koks C, Verschuere T, Boon L, Van Gool SW, Agostinis P. Dendritic cell vaccines based on immunogenic cell death elicit danger signals and T cell-driven rejection of high-grade glioma. Sci Transl Med. 2016;8(328):327r-28r. doi:10.1126/scitranslmed.aae0105. PMID:26936504
- Gong J, Chen D, Kashiwaba M, Kufe D. Induction of antitumor activity by immunization with fusions of dendritic and carcinoma cells. Nat Med. 1997;3(5):558-61. doi:10.1038/nm0597-558. PMID:9142127
- Koido S, Gong J. Characterization of structure and direct antigen presentation by dendritic/tumor-fused cells as cancer vaccines. Anticancer Res. 2013;33(2):347-54. PMID:23393323
- Melief CJ. Cancer immunotherapy by dendritic cells. Immunity. 2008;29(3):372-83. doi:10.1016/j.immuni.2008.08.004. PMID:18799145
- Koido S, Nikrui N, Ohana M, Xia J, Tanaka Y, Liu C, Durfee JK, Lerner A, Gong J. Assessment of fusion cells from patient-derived ovarian carcinoma cells and dendritic cells as a vaccine for clinical use. Gynecol Oncol. 2005;99(2):462-71. doi:10.1016/j.ygyno.2005.07.019. PMID:16137749
- Koido S. Dendritic-tumor fusion cell-based cancer vaccines. Int J Mol Sci. 2016;17(6):828-43. https://doi.org/10.3390/ijms17060828. PMID:27240347
- Guo W, Guo Y, Tang S, Qu H, Zhao H. Dendritic cell-Ewing's sarcoma cell hybrids enhance antitumor immunity. Clin Orthop Relat Res. 2008;466(9):2176-83. doi:10.1007/s11999-008-0348-7. PMID:18563501
- Haenssle HA, Krause SW, Emmert S, Zutt M, Kretschmer L, Schmidberger H, Andreesen R, Soruri A. Hybrid cell vaccination in metastatic melanoma: Clinical and immunologic results of a phase I/II study. J Immunother. 2004;27(2):147-55. doi:10.1097/00002371-200403000-00008. PMID:14770086
- Trefzer U, Herberth G, Wohlan K, Milling A, Thiemann M, Sherev T, Sparbier K, Sterry W, Walden P. Vaccination with hybrids of tumor and dendritic cells induces tumor-specific T-cell and clinical responses in melanoma stage III and IV patients. Int J Cancer. 2004;110(5):730-40. doi:10.1002/ijc.20191. PMID:15146563
- Shu S, Cohen P. Tumor-dendritic cell fusion technology and immunotherapy strategies. J Immunother. 2001; 24(2):99-00. doi:10.1097/00002371-200103000-00001. PMID:11265778
- Tanaka Y, Koido S, Ohana M, Liu C, Gong J. Induction of impaired antitumor immunity by fusion of MHC class II-deficient dendritic cells with tumor cells. J Immunol. 2005;174(3):1274-80. doi:10.4049/jimmunol.174.3.1274. PMID:15661883
- Gong J, Nikrui N, Chen D, Koido S, Wu Z, Tanaka Y, Cannistra S, Avigan D, Kufe D. Fusions of human ovarian carcinoma cells with autologous or allogeneic dendritic cells induce antitumor immunity. J Immunol. 2000;165(3):1705-11. doi:10.4049/jimmunol.165.3.1705. PMID:10903782
- Gelse K, Poschl E, Aigner T. Collagens–structure, function, and biosynthesis. Adv Drug Deliv Rev. 2003;55(12):1531-46. doi:10.1016/j.addr.2003.08.002. PMID:14623400
- Medici D, Nawshad A. Type I collagen promotes epithelial-mesenchymal transition through ILK-dependent activation of NF-kappaB and LEF-1. Matrix Biol. 2010;29(3):161-65. doi:10.1016/j.matbio.2009.12.003. PMID:20018240
- Vogel WF. Collagen-receptor signaling in health and disease. Eur J Dermatol. 2001;11(6):506-14. PMID:11701397
- Schultz HS, Nitze LM, Zeuthen LH, Keller P, Gruhler A, Pass J, Chen J, Guo L, Fleetwood AJ, Hamilton JA, et al. Collagen induces maturation of human monocyte-derived dendritic cells by signaling through osteoclast-associated receptor. J Immunol. 2015;194(7):3169-79; PMID:25725106. doi:10.4049/jimmunol.1402800
- Sprague L, Muccioli M, Pate M, Singh M, Xiong C, Ostermann A, Niese B, Li Y, Li Y, Courreges MC, et al. Dendritic cells: In vitro culture in two- and three-dimensional collagen systems and expression of collagen receptors in tumors and atherosclerotic microenvironments. Exp Cell Res. 2014;323(1):7-27. doi:10.1016/j.yexcr.2014.01.031. PMID:24569142
- Koido S, Homma S, Okamoto M, Namiki Y, Takakura K, Uchiyama K, Kajihara M, Arihiro S, Imazu H, Arakawa H, et al. Strategies to improve the immunogenicity of anticancer vaccines based on dendritic cell/malignant cell fusions. OncoImmunology. 2013;2(9):e25994. doi:10.4161/onci.25994. PMID:24228229
- Koido S, Hara E, Homma S, Ohkusa T, Gong J, Tajiri H. Cancer immunotherapy by fusions of dendritic cells and tumor cells. Immunotherapy. 2009;1(1):49-62. doi:10.2217/1750743X.1.1.49. PMID:20635973
- Koido S, Hara E, Homma S, Namiki Y, Ohkusa T, Gong J, Tajiri H. Cancer vaccine by fusions of dendritic and cancer cells. Clin Dev Immunol. 2009;2009:657369. doi:10.1155/2009/657369. PMID:20182533
- Sakaguchi S, Yamaguchi T, Nomura T, Ono M. Regulatory T cells and immune tolerance. Cell. 2008;133(5):775-87. doi:10.1016/j.cell.2008.05.009. PMID:18510923
- Marvel D, Gabrilovich DI. Myeloid-derived suppressor cells in the tumor microenvironment: Expect the unexpected. J Clin Invest. 2015;125(9):3356-64. doi:10.1172/JCI80005. PMID:26168215
- Yin Y, Cai X, Chen X, Liang H, Zhang Y, Li J, Wang Z, Chen X, Zhang W, Yokoyama S, et al. Tumor-secreted miR-214 induces regulatory T cells: A major link between immune evasion and tumor growth. Cell Res. 2014;24(10):1164-80. doi:10.1038/cr.2014.121. PMID:25223704
- Jacobs JF, Nierkens S, Figdor CG, de Vries IJ, Adema GJ. Regulatory T cells in melanoma: The final hurdle towards effective immunotherapy? Lancet Oncol. 2012;13(1):e32-2. doi:10.1016/S1470-2045(11)70155-3. PMID:22225723
- Keenan BP, Saenger Y, Kafrouni MI, Leubner A, Lauer P, Maitra A, Rucki AA, Gunderson AJ, Coussens LM, Brockstedt DG, et al. A Listeria vaccine and depletion of T-regulatory cells activate immunity against early stage pancreatic intraepithelial neoplasms and prolong survival of mice. Gastroenterology. 2014;146(7):1784-94. doi:10.1053/j.gastro.2014.02.055. PMID:24607504
- Saito T, Nishikawa H, Wada H, Nagano Y, Sugiyama D, Atarashi K, Maeda Y, Hamaguchi M, Ohkura N, Sato E, et al. Two FOXP3(+)CD4(+) T cell subpopulations distinctly control the prognosis of colorectal cancers. Nat Med. 2016;22(6):679-84. doi:10.1038/nm.4086. PMID:27111280
- Rosenblatt J, Vasir B, Uhl L, Blotta S, Macnamara C, Somaiya P, Wu Z, Joyce R, Levine JD, Dombagoda D, et al. Vaccination with dendritic cell/tumor fusion cells results in cellular and humoral antitumor immune responses in patients with multiple myeloma. Blood. 2011;117(2):393-02. doi:10.1182/blood-2010-04-277137. PMID:21030562
- Seo SJ, Fields ML, Buckler JL, Reed AJ, Mandik-Nayak L, Nish SA, Noelle RJ, Turka LA, Finkelman FD, Caton AJ, et al. The impact of T helper and T regulatory cells on the regulation of anti-double-stranded DNA B cells. Immunity. 2002;16(4):535-46. doi:10.1016/S1074-7613(02)00298-4. PMID:11970877
- Lim HW, Hillsamer P, Banham AH, Kim CH. Cutting edge: Direct suppression of B cells by CD4+ CD25+ regulatory T cells. J Immunol. 2005;175(7):4180-83. doi:10.4049/jimmunol.175.7.4180. PMID:16177055
- Vermeulen M, Giordano M, Trevani AS, Sedlik C, Gamberale R, Fernandez-Calotti P, Salamone G, Raiden S, Sanjurjo J, et al. Acidosis improves uptake of antigens and MHC class I-restricted presentation by dendritic cells. J Immunol 2004;172(5):3196-04. doi:10.4049/jimmunol.172.5.3196. PMID:14978127
- Dong H, Bullock TN. Metabolic influences that regulate dendritic cell function in tumors. Front Immunol 2014;5:24. doi:10.3389/fimmu.2014.00024. PMID:24523723
- Tong J, Wu WN, Kong X, Wu PF, Tian L, Du W, Fang M, Zheng F, Chen JG, Tan Z, et al. Acid-sensing ion channels contribute to the effect of acidosis on the function of dendritic cells. J Immunol. 2011;186(6):3686-92. doi:10.4049/jimmunol.1001346. PMID:21321108
- Jung ID, Jeong SK, Lee CM, Noh KT, Heo DR, Shin YK, Yun CH, Koh WJ, Akira S, Whang J, et al. Enhanced efficacy of therapeutic cancer vaccines produced by co-treatment with Mycobacterium tuberculosis heparin-binding hemagglutinin, a novel TLR4 agonist. Cancer Res. 2011;71(8):2858-70. doi:10.1158/0008-5472.CAN-10-3487. PMID:21368092
- Sellick CA, Hansen R, Maqsood AR, Dunn WB, Stephens GM, Goodacre R, Dickson AJ. Effective quenching processes for physiologically valid metabolite profiling of suspension cultured Mammalian cells. Anal Chem. 2009;81(1):174-83. doi:10.1021/ac8016899. PMID:19061395
- Sellick CA, Hansen R, Stephens GM, Goodacre R, Dickson AJ. Metabolite extraction from suspension-cultured mammalian cells for global metabolite profiling. Nat Protoc. 2011;6(8):1241-49. doi:10.1038/nprot.2011.366. PMID:21799492
- Teng Q, Huang W, Collette TW, Ekman DR, Tan C. A direct cell quenching method for cell-culture based metabolomics. Metabolomics. 2009;5(2):199-08. doi:10.1007/s11306-008-0137-z
- Xiao C, Hao F, Qin X, Wang Y, Tang H. An optimized buffer system for NMR-based urinary metabonomics with effective pH control, chemical shift consistency and dilution minimization. Analyst. 2009;134(5):916-25. doi:10.1039/b818802e. PMID:19381385