
ABSTRACT
High-grade gliomas are malignant aggressive primary brain tumors with limited therapeutic options, and dismal prognosis for patients. Microglia, the resident immune cells of the brain, are recruited and reprogrammed into tumor-supporting cells by glioma cells, which in turn positively influence tumor expansion and infiltration into surrounding brain tissues. Here, we report that glioma-induced microglia conversion is coupled to an increase of histone H4 lysine 16 (H4K16) acetylation level in microglia, through increased nuclear localization of the deacetylase SIRT1, which in turn results in deacetylation of the H4K16 acetyltransferase hMOF and its recruitment to the chromatin at promoter regions of microglial target genes. Furthermore, we demonstrate that manipulation of the microglial H4K16 acetylation level, taking advantage of the intrinsic H4K16 deacetylase or acetyltransferase activities of SIRT1 and hMOF, respectively, modulated the tumor-supporting function of microglia. This study provides evidence that post-translational modifications of histones and the histone-modifying enzymes controlling them, such as H4K16 acetylation regulated by hMOF and SIRT1, are part of the microglial pro-tumoral activation pathway initiated by glioma cancer cells and represent potentially novel therapeutic targets.
Introduction
Although high-grade gliomas exhibit a low incidence, they are the most common primary brain tumors and cause significant mortality and morbidity therefore representing one of the biggest challenges of today's oncology. Indeed, despite multimodal therapy with the concomitant use of radiation and adjuvant temozolomide, the median survival for patients with high-grade gliomas is limited to ∼3.5 years for the anaplastic astrocytoma (WHO grade III) and ∼15 months for glioblastoma multiforme (WHO grade IV). The extensive infiltration of tumor cells into the surrounding normal brain tissue is a pathologic hallmark of high-grade gliomas and contributes significantly to the failure of current therapeutic treatments as surgical resection is always incomplete.Citation1 Glioma tumors are heterogeneous with respect to the composition of bona fide tumors cells and with respect to a range of intermingling non-neoplastic cells which also play vital role in controlling the course of pathology. Actually, microglia, the resident immune cells of the central nervous system (CNS), make up the largest population of glioma tumor infiltrating cells.Citation2-4
Adequate microglial functions are crucial for a healthy brain, but microglia activation can also contribute to brain diseases.Citation5 In fact, glioma tumor cells exploit microglia for their expansion.Citation6 Soluble factors released from glioma stimulate microglial receptors, resulting in microglia activation and recruitment in large numbers at the tumor site. Subsequently, tumor cells stimulate the microglia to exert tumor-trophic functions. Microglia release many factors, including cytokines and extracellular matrix proteases, which may influence tumor invasiveness and growth. As further evidence of their essential role in glioma biology, removal of microglia, both in brain organotypic slices and genetic mouse models, inhibit glioma invasiveness.Citation3,7 Therefore, deciphering the molecular mechanisms that provide control of microglia activation toward a tumor-supporting phenotype in response to cues from glioma cells has gained considerable interest.
Accumulating evidence indicates that the polarization of microglia toward selective activation states, including a tumor-supporting phenotype, is associated with specific gene expression patterns.Citation6,8 Transcriptional activation and repression are strongly influenced by and associated with changes in chromatin structure, including histone post-translational modifications. The efficiency of an external signal, such as the one provided by glioma cells, in activating or repressing gene expression in microglia could strongly depend on such chromatin modifications. Although studies have hinted towards the regulation of the microglial pro-inflammatory phenotype by histone modifications, their possible contribution to the regulation of the microglial tumor-supporting phenotype remains to be explored.Citation9
Our attention was drawn to the acetylation of histone 4 at lysine 16 (H4K16ac), since this particular histone post-translational modification has been demonstrated to play an important role in the regulation of transcription.Citation10 The acetylation level of H4K16 is regulated by the opposing effects of the histone acetyltransferase hMOF and the histone deacetylase sirtuin1 (SIRT1).Citation11,12 SIRT1 and hMOF share common substrates like H4K16ac and p53, suggesting their joint participation in different cellular processes. Further, hMOF and SIRT1 are highly evolutionarily conserved enzymes.Citation13,14 Both enzymes are of particular interest as they display quite diverse roles in various cellular processes. hMOF enzymatic activity has an extraordinary specificity for H4K16,Citation15 suggesting that any process mediated through H4K16ac can potentially be influenced by hMOF. Previous observations suggest that hMOF and H4K16ac may be involved in tumorigenesis.Citation16 Notably, recent studies identified that hMOF autoacetylation changes the surface charge of the protein and alters its binding to the nucleosome.Citation17,18 Thereby, SIRT1 deacetylates hMOF and promotes its recruitment on the chromatin which highlights the dynamic interplay between both enzymes in regulating H4K16 acetylation.Citation18
Here, we demonstrate that the glioma-induced tumor-supporting microglia phenotype is coupled to the nuclear accumulation of SIRT1, with SIRT1-mediated deacetylation of hMOF, leading to the recruitment of this H4K16 histone acetyltranferase to the promoter of genes associated with the microglia tumor-supportive phenotype. We also report that manipulating H4K16 acetylation level in microglia, through interference with either hMOF or SIRT1, impacts microglia activation.
Results
The glioma-induced tumor-supporting microglia phenotype is associated with increased H4K16 acetylation
Transcriptional activation and repression are strongly influenced by and associated with changes in chromatin structure, including histone modifications. Acetylation of Lys16 of histone 4 (H4K16) is thought to play an important role in active transcription, presumably by facilitating chromatin accessibility.Citation19-21 To explore whether glioma stimuli could alter microglia gene expression pattern through changes in this histone modification, and thereby microglia activation towards a tumor-supporting phenotype, a segregated coculture transwell set-up was used, and the effect of soluble factors originating from C6 glioma cells on BV2 microglia cells was examined. Induction of a tumor-supporting phenotype in BV2 microglia cells upon segregated coculture with C6 glioma cells was demonstrated by expression or repression of genes previously linked to glioma-induced microglia activation,Citation22,23 as well as by the ability of these activated microglia to promote C6 glioma cell migration capacity (). Indeed, quantitative PCR (qPCR) analysis revealed the induction of interleukin-1β (Il1β) and interleukin-6 (Il6) mRNA expression in microglia, as well as three other makers associated with the microglial tumor-supportive phenotype, namely the chemokine Ccl22, the chitinase-like molecule Chil3 (also known as Ym1) and the matrix metalloproteinase-14 (membrane-inserted) Mmp14. Expression of the nitric oxide synthase-2 (Nos2) mRNA, whose induction is strongly associated with the microglial pro-inflammatory phenotype was found to be substantially decreased following segregated coculture with glioma cells (). Increased Mmp14 gene expression in the microglia cells upon stimulation by glioma cells was further confirmed at the protein level using immunoblotting analysis for MMP14 (). Using a transwell migration assay, when placing C6 glioma cells in the upper compartment and BV2 cells in the lower compartment, a positive impact of microglia on glioma migration was observed (). Of note, the use of C6-cocultured BV2 cells, instead of BV2 cells alone, in the lower compartment of the transwell, did not provide significant differences for the C6 glioma cells migration capability.
Figure 1. Glioma‐induced microglia tumor‐supporting phenotype is associated with increased H4K16 acetylation. (A) qPCR analysis of Il1β, Il6, Mmp14, Ccl22, Chil3 and Nos2 mRNA expression in BV2 microglia grown as monocultures or with C6 glioma cells as segregated cocultures (key); results are presented relative to those of each monoculture, set as 1. (B) Immunoblot analysis of MMP14 and β-actin (right margin, molecular size, in kilodaltons (kDa)) with quantification (C) in BV2 microglia cultured for 4 h as a monoculture or with C6 glioma cells as segregated coculture; results are presented to relative to those of BV2 microglia monoculture, set as 1. (D) Quantification of the migration of C6 glioma cells in Transwells with BV2 microglia or C6-cocultured BV2 microglia in the lower compartment; results are presented relative to those of C6 cells alone, set as 1. (E and F) Immunoblot analysis of H4K16ac and β-actin (right margin, molecular size, in kilodaltons (kDa)) (E) with quantification (F) in BV2 microglia control (0 h) or cultured for 2 h, 4 h or 6 h as monoculture or with C6 glioma cells as segregated coculture; results are presented to relative to those of BV2 microglia control (0 h), set as 1. (G) Confocal microscopy of BV2 microglia cultured for 4 h as a monoculture or with C6 glioma cells as segregated coculture, with immunostaining for H4K16ac and Hoechst nuclear counterstain. Scale bar, 10 μm. ns, non-significant, #P < 0.05, ##P < 0.01, ###P < 0.001 and ####P < 0.0001 (two-tailed Student's t-test). Data are from three independent experiments (A to D) or five independent experiments (E and F) (mean and s.d.).
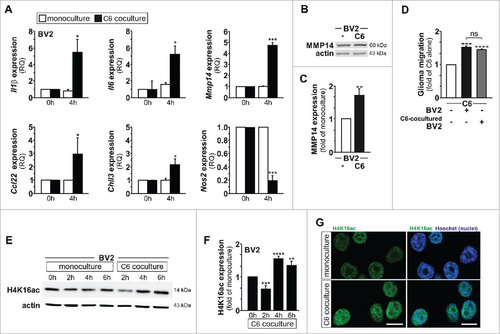
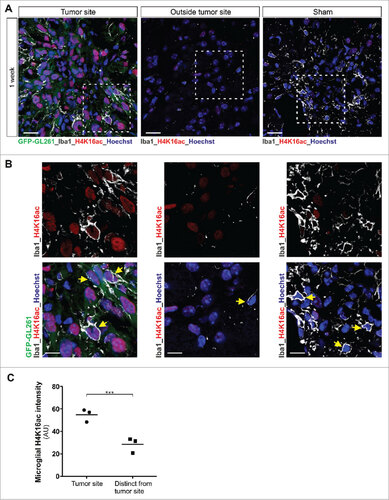
Interestingly, we observed in immunoblot analyses that glioma-induced microglia activation is associated with significant changes in the microglial global amount of H4K16ac. In fact, a transient decrease (observed at 2 hours) followed by a robust and sustained increase (noted at 4, 6 and 24 hours) in H4K16ac level was observed in BV2 microglia upon coculture with C6 glioma cells ( and Supplementary Figure 1A–B). The coculture condition did not affect total histone H4 levels in the microglia cells (Supplementary Figure 1A-B). The increase in microglial H4K16ac expression upon glioma-microglia coculture at 4 hours was confirmed by immunofluorescence in BV2 microglia (). An increase in H4K16ac expression level in BV2 microglia could also be observed upon their segregated coculture with the GL261 glioma cells or coculture with murine primary glioma tumorspheres (Supplementary Figure 1C–F). To determine the physiological relevance of the findings reported above, we performed in vivo experiments and injected green fluorescent protein-expressing GL261 glioblastoma cells (GFP-GL261 cells) into the brains of postnatal day 16–17 C57/BL6/J mice.Citation24 This syngeneic transplant tumor model in immunocompetent mice has been shown, at the time points used, to exhibit limited infiltration by peripheral monocytes or macrophages.Citation4 Immunohistochemical analysis of brain tissue surrounding the gliomas at 1 week and 2 weeks after transplantation revealed a massive recruitment of microglia cells expressing the microglial marker Iba1, and high abundance of H4K16ac in microglia cells located inside the tumor mass as compared to cells residing at distance from the tumor ( and Supplementary Figure 2). Collectively, these data demonstrate that glioma-induced microglia tumor-supportive activation state is associated with an increased acetylation of H4K16.
Figure 2. Increased H4K16 acetylation expression levels are observed in microglia in mouse glioblastoma tumor model. (A and B) Confocal microscopy of tumors formed in mouse brain 1 week after injection of GFP-GL261 cells, with immunostaining for H4K16ac and Iba1 (microglia marker, depicted in white) and Hoechst nuclear counterstain. Scale bars, 20 µm (A), 10 µm (B). Picture for depicted microglia outside the tumor site was taken 2 mm from tumor border. In the depicted images, some microglia cells are pointed out with a yellow arrow head. Data are representative of one independent experiment with three mice. (C) Quantification of the signal intensity of microglial H4K16ac at tumor site or distinct from tumor site at 1 week after injection of cells as in A. ###P < 0.001 (two-tailed Student's t-test). Data are pooled from over 100 microglia cells from each mouse. Each dot represents the mean value of microglia cells from one mouse and the line indicates the median value of each group.
The microglial tumor-supportive activation state is associated with nuclear localization of SIRT1
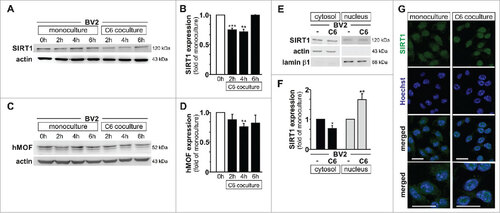
Thereafter, we aimed at uncovering the histone modifying enzyme(s) involved in the regulation of H4K16 acetylation observed in microglia upon their activation by glioma cells. The activities of the histone acetyltransferase hMOF (also called KAT8 or MYST1) and the histone deacetylase SIRT1 have been reported to play a central role in the regulation of H4K16 acetylation levels in various model systems.Citation12,25-28 Indeed, the histone acetyltransferase hMOF is required for the bulk of H4K16 acetylation in mammalian cells.Citation28 The deacetylase SIRT1 has a wide range of non-histone targets (including hMOF), but H4K16 is its primary histone target and can thereby antagonize the enzymatic activity of hMOF.Citation26 Protein expression levels for these two histone-modifying enzymes were investigated by immunoblotting in BV2 microglia upon monoculture or segregated coculture with C6 glioma cells up to 6 hours. SIRT1 expression was found to be transiently downregulated at 2 and 4 hours in BV2 microglia upon coculture with C6 glioma (). In contrast, with exception of a decrease observed at 4 hours, microglial hMOF expression was mostly found to be unaffected in the same conditions ().
Figure 3. Nuclear relocalisation of microglial SIRT1 is observed upon glioma coculture. (A to D) Immunoblot analysis of SIRT1 (A) or hMOF (C) and β-actin (A and C) with quantification (B and D) in BV2 microglia control (0 h) or cultured for 2 h, 4 h or 6 h as monoculture or with C6 glioma cells as segregated coculture; results are presented relative to those of BV2 microglia control (0 h), set as 1. (E) Immunoblot analysis of SIRT1, actin and lamin β1 lysate in subcellular fractions of BV2 microglia grown for 4 h as monocultures or with C6 cells as segregated cocultures. (F) Quantification of SIRT1 in subcellular fractions of e; results are presented relative to those of BV2 monocultures, set as 1. (G) Confocal microscopy of BV2 microglia grown for 4 h as monocultures or with C6 cells as segregated cocultures, with immunostaining for SIRT1 and Hoechst nuclear counterstain. Last row of the depicted pictures are higher magnification of the merged confocal images. Scale bar, 20 µm. #P < 0.05, ##P < 0.01, ###P < 0.001 (two-tailed Student's t-test). Data are from three independent experiments (A, B, C, D and G) or four independent experiments (E and F) (mean and s.d.).
Microglial SIRT1 mRNA expression was not found to be altered upon glioma coculture condition suggesting that the observed decrease in SIRT1 protein is not due to transcriptional regulation (Supplementary Figure 3A). In order to address whether downregulation of SIRT1 protein level in microglia upon segregated coculture with C6 glioma could be the result of proteasomal degradation, a set of experiments using the proteasome inhibitor MG132 was performed (Supplementary Figure 3B–C). SIRT1 immunoprecipitation followed by immunoblotting for ubiquitin indicated that polyubiquitination of microglial SIRT1 is increased upon coculture with C6 glioma, as illustrated by increased intensity for the ubiquitined smear upon MG132 treatment (Supplementary Figure 3B). In BV2 microglia, treatment with the proteasome inhibitor MG132 was also found to rescue SIRT1 protein from degradation upon glioma stimulation (Supplementary Figure 3C). These data indicate that some of the microglial SIRT1 protein pool is degraded through proteasomal degradation in response to glioma stimuli.
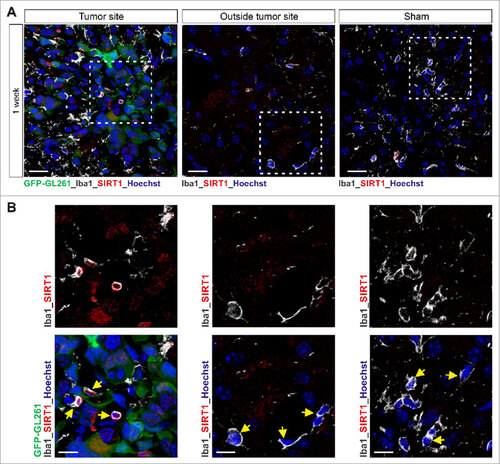
It is worth noting that SIRT1 protein exhibits two nuclear localization signals and two nuclear export signals that can influence its subcellular location, and thereby functions, in response to biological stimuli.Citation29 Therefore, the subcellular localization of SIRT1 was investigated by immunoblotting in the context of glioma-induced microglia activation. SIRT1 was found to be localized in both cytosolic and nuclear fractions of BV2 microglia when grown as monoculture. However, upon coculture condition with C6 glioma cells, microglial SIRT1 was reduced in the cytosolic, while increased in the nuclear subcellular fractions (). Predominant nuclear localization for SIRT1 in BV2 microglia upon exposure to C6 glioma cells was also confirmed by immunofluorescence and confocal imaging (). Furthermore, using the GL261 glioma mouse model described above, we found in vivo that SIRT1 was highly expressed in microglia nuclei inside the tumor as compared to the non-tumor area ( and Supplementary Figure 4).
Figure 4. Increased SIRT1 expression is observed in microglia in mouse glioblastoma tumor model. (A and B) Confocal microscopy of tumors formed in mouse brain 1 week after injection of GFP-GL261 cells, with immunostaining for SIRT1 and Iba1 (microglia marker, depicted in white) and Hoechst nuclear counterstain. Scale bars, 20 µm (A), 10 µm (B). Picture for depicted microglia outside the tumor site was taken 6 mm from tumor border. In the depicted images, some microglia cells are pointed out with a yellow arrow head. Data are representative of one independent experiment with three mice.
SIRT1 interacts with and deacetylates hMOF, promoting its recruitment and H4K16 acetylation at microglial gene targets
The observed increased nuclear localization for SIRT1 in microglia in response to glioma stimulation might appear contradictory to its reported deacetylase activity on H4K16ac, as this histone mark was found to be up-regulated in those conditions. Therefore, we placed our attention on the reported function of SIRT1 as a regulator of hMOF H4K16 acetyltransferase activity. Indeed, previous studies suggest that auto-acetylation of hMOF down-regulates its recruitment and enzymatic activity against H4K16.Citation17,18 Moreover, deacetylation of hMOF by SIRT1 has been proposed to increase its recruitment to chromatin.Citation18 Based on these observations, we hypothesized that during glioma-induced microglia activation SIRT1 could deacetylate hMOF and thereby promote its recruitment to chromatin which would lead as a result to increase H4K16 acetylation. First, increased protein-protein interaction between SIRT1 and hMOF was confirmed in microglia upon glioma coculture as demonstrated by co-immunoprecipitation of hMOF with SIRT1 (). In addition, increased SIRT1-hMOF protein-protein interaction was further validated by in situ proximity ligation assays (PLA) (). Second, reduced acetylation of hMOF in microglia under segregated coculture condition with glioma cells was illustrated by the reduced presence of hMOF in anti-acetylated lysine immunoprecipitated protein complexes (). This finding was further confirmed by in situ proximity ligation assays (PLA) using anti-hMOF and anti-acetylated lysine antibodies (). We then performed chromatin immunoprecipitation (ChIP) to assess whether the deacetylation of hMOF by SIRT1 was accompanying its recruitment to chromatin and the subsequent acetylation of H4K16 at promoter regions of Il1β (), Il6 (), Mmp14 (), Ccl22 (), and Chil3 (). For the Il6, Mmp14, Ccl22 and Chil3 promoter regions, significant hMOF recruitment was found (,,,) and coupled with higher H4K16ac content (,,,) in C6 glioma-stimulated BV2 microglia. Of note, no enrichment was observed for SIRT1 at these promoter regions in microglia cells upon glioma stimulation (Supplementary Figure 5).
Figure 5. SIRT1 interacts with and deacetylates hMOF. (A) Immunoblot analysis of SIRT1 and hMOF in BV2 microglia cultured for 4 h as monoculture or with C6 glioma cells as segregated coculture assessed after immunoprecipitation with antibody to SIRT1 or immunoglobulin G (IgG; control). IgG bands are indicated with an asterisk, whereas proteins of interest are indicated with an arrow head. (B) In situ proximity-ligation assay (PLA) with quantifications (C) of SIRT1-hMOF interactions in BV2 microglia grown for 4 h as monocultures or with C6 cells as segregated cocultures; results are presented relative to those of BV2 monocultures, set as 1. (D) Immunoblot analysis of hMOF in BV2 microglia cultured for 4 h as monoculture or with C6 glioma cells as segregated coculture assessed after immunoprecipitation with antibody to acetyl lysine (acK) or immunoglobulin G (IgG; control). (E) In situ proximity-ligation assay (PLA) with quantification (F) of acK-hMOF interactions in BV2 microglia grown for 4 h as monocultures or with C6 cells as segregated cocultures; results are presented relative to those of BV2 monocultures, set as 1. ##P < 0.01and ###P < 0.001 (two-tailed Student's t-test). Data are from three independent experiments (mean and s.d.).
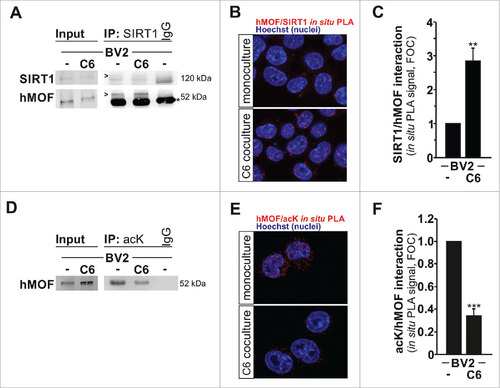
Figure 6. The H4K16 HAT hMOF is recruited to microglial upregulated genes. BV2 microglia are cultured for 4 h as monocultures or with C6 glioma cells as segregated cocultures and immunoprecipitated with hMOF (A, C, E, G and I) or H4K16ac (B, D, F, H and J) antibodies. hMOF and H4K16ac ChIP signals in 1 kb region downstream of the transcription start sites for the genes Il1β, Il6, Mmp14, Ccl22 and Chil3 were analyzed using qPCR and normalized to the levels of input DNA. BV2 microglia grown as monocultures serves as a control, set as 1. #P < 0.05 and ##P < 0.01 (two-tailed Student's t-test). Data are from three (Ccl22 and Chil3) or five (Il1β, Il6 and Mmp14) independent experiments (mean and s.d.).
H4K16 acetylation status impacts on microglia tumor supporting phenotype
Thus, collectively the data provide compelling evidence that the observed increased acetylation of H4K16 in microglia, through the activation of histone acetyltransferase hMOF upon its deacetylation by SIRT1, is associated with the glioma-induced tumor supporting phenotype. This finding prompted us to examine whether manipulation of the H4K16 acetylation status in microglia per se could affect their activation towards the tumor supporting phenotype. To explore this possibility, we took advantage of the fact that despite that SIRT1 was not directly involved in the observed changes in microglial H4K16 acetylation upon glioma stimulation, SIRT1 remained an H4K16 histone deacetylase and its manipulation can be used to modulate the H4K16 acetylation status in these cells. In fact, a decrease in the acetylation level of H4K16 was observed in BV2 microglia cultured alone or upon coculture with C6 glioma cells upon pre-treatment with the specific SIRT1 activator SRT1720 (). Furthermore, SRT1720-induced activation of SIRT1 in BV2 microglia was found to be associated with a significant decrease in their ability to promote C6 glioma migration (). In contrast, treatment of BV2 microglia with the SIRT1-specific inhibitor EX527 led to an increased level of acetylated H4K16 (), which was associated with an enhanced ability for these microglia to promote C6 glioma migration (). In agreement, similar contrasting effects on the H4K16 acetylation expression level and consequently on the microglia-enhancing effect on glioma migration ability were observed when SIRT1 or hMOF gene expression were subjected to silencing using small-interfering RNA pools (). Indeed, whereas both microglial H4K16 acetylation expression level and the ability of microglia to promote glioma cell migration were found to be enhanced upon microglial SIRT1 gene silencing (), they were found to be inhibited upon microglial hMOF gene silencing (). Thus, collectively these data advocate that inhibition of the glioma-induced increase in H4K16 acetylation level in microglia could counteract the acquisition of a tumor supporting phenotype.
Figure 7. Modulation of H4K16ac status impacts on microglia tumor supporting phenotype. (A and C) Immunoblot analysis of H4K16ac and H3 in BV2 microglia pre-treated with EX527 (SIRT1 activity inhibitor) or SRT1720 (SIRT1 activity activator) cultured for 4 h as monoculture or with C6 glioma cells as segregated coculture. (B and D) Quantification of the migration of C6 glioma cells in Transwells with BV2 microglia pre-treated with EX527 or SRT1720 in the lower compartment; results are presented relative to those of C6 cells exposed to BV2 microglia control (ctrl), set as 1. (E and G) Immunoblot analysis of H4K16ac and H3 as well as SIRT1 (E) and hMOF (G) in BV2 microglia transfected with SIRT1-specific siRNA (siRNA SIRT1) or hMOF-specific siRNA (siRNA hMOF) or control siRNA (siRNA Ctrl) cultured for 4 h as monoculture or with C6 glioma cells as segregated coculture. (F and H) Quantification of the migration of C6 glioma cells in Transwells with BV2 microglia transfected with siRNA SIRT1, siRNA hMOF or siRNA Ctrl in the lower compartment; results are presented relative to those of C6 cells exposed to BV2 microglia transfected with siRNA Ctrl, set as 1. #P < 0.05, ##P < 0.01, ###P < 0.001 and ####P < 0.0001 (two-tailed Student's t-test). Data are from three independent experiments (D and G) and six independent experiments (B and F) (mean and s.d.).
Discussion
High-grade gliomas are highly aggressive primary brain tumors with limited therapeutic options and a dismal prognosis for the patients.Citation30 Malignant glioma tumors are characterized by the accumulation of myeloid cells, which are composed of microglia, the resident immune cells of the central nervous system, and peripheral macrophages. The respective contribution of the brain resident microglia versus the macrophages originating from peripheral sources on tumor progression has been subject to intense debate.Citation6 Nevertheless, recent studies, taking advantage of head-protected irradiation chimera glioma mouse model, revealed that resident microglia represent the main and early source of myeloid cells within gliomas, whereas peripheral macrophages were only found to infiltrate at the late stage of tumor growth.Citation4,31 During the course of disease, microglia undergo reprogramming towards a tumor-supportive phenotype. Compelling evidence demonstrates that tumor-associated microglia promote tumor growth and invasion in glioma.Citation6 In fact, exacerbating the tumor-supporting phenotype of microglia in vivo has been shown to enhance glioma tumor growth.Citation23 In contrast, interventions aiming at the depletion of these myeloid infiltrating cells have been reported to reduce, at least transiently, glioma expansion.Citation32,33 Thus, the further understanding of potential reprograming programs used by glioma cells to transform the microglial cell population is hence of evident interest.
Here, we report that glioma-induced microglia activation is coupled to an increase in acetylation level of lysine 16 on histone H4, i.e. H4K16ac, a histone post-translational modification regulating chromatin accessibility, nucleosome assembly and associated with transcriptional activation.Citation19,21,34,35 In addition, we show that the increase in microglial H4K16ac expression level was found to be linked to the nuclear accumulation of the deacetylase SIRT1, its interaction with the selective H4K16 histone acetyltransferase hMOF, leading to the deacetylation of hMOF and its recruitment to promoter regions of genes associated with the microglial activation ().
Figure 8. Proposed pathway. Schematic representation illustrating that in microglia upon exposure to glioma cells, SIRT1 can relocate to the nucleus where it interacts with and deacetylates hMOF, thereby promoting the chromatin recruitment of this H4K16 histone acetyltranferase at promoter regions of glioma-induced microglial regulated genes.
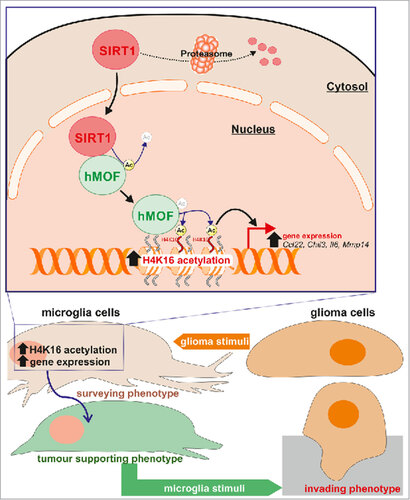
It is of importance to note that SIRT1 can exert both negative direct and positive indirect effects on H4K16ac expression level. Indeed, SIRT1 acting as a H4K16 histone deacetylase can decrease the expression level for this histone H4 post-translational modification at lysine 16.Citation11,12 At the same time, deacetylation of hMOF, an H4K16 histone acetyltransferase, by SIRT1 leads to its activation, and in turn promotes acetylation at H4K16.Citation17,18 In fact, our data reveal that upon glioma stimulation, in the microglia cells, there is not displacement of SIRT1 from the promoter regions of the investigated genes that could account for the observed increase in H4K16 acetylation at those sites. In addition, SIRT1 was found to interact with hMOF and promote its deacetylation. Collectively, these results advocate that in the context of glioma-induced microglia activation, in microglia cells SIRT1 is primarily mediating its effect via the activation of the hMOF H4K16 histone acetyltransferase.
The SIRT1 protein exhibits two nuclear localization signals and two nuclear export signals, which control its nucleo-cytoplasmic shuttling and allow SIRT1 functions in both sub-cellular compartments.Citation29,36,37 SIRT1 functions can be influenced by various post-translational modifications including phosphorylation, ubiquitination, nitrosylation and SUMOylation.Citation36,38 For example, under oxidative stress conditions, cJUN N-terminal kinase1 (JNK1) phosphorylates SIRT1 and increases its nuclear localization and enzymatic activity.Citation39 Whether such post-translational modifications of SIRT1 could be responsible for the nuclear relocalization of SIRT1 observed in microglia upon exposure to glioma, including the oxidative stress generated, remained to be explored.Citation39 There is convincing evidence that hMOF can be autoacetylated at its lysine residue Lys274 and that the deacetylase SIRT1 has hMOF as one of its substrates; however, whether SIRT1-mediated hMOF deacetylation leads to activation or repression of its H4K16 acetyltransferase activity appears controversial. Indeed, reports suggest that deacetylation of hMOF promotes its acetyltransferase activity against H4K16ac,Citation17,18 whereas other studies suggest that the deacetylation of this enzyme reduces its recruitment to the chromatin and thereby inhibits its HAT activity.Citation40-42 In the context of glioma-induced microglia activation, our experimental work provided support of the view that SIRT1-mediated hMOF deacetylation enhances the recruitment of this H4K16 histone acetyltransferase to the chromatin. In fact, functional interaction between SIRT1 and hMOF, deacetylation of hMOF and increased H4K16 acetylation were observed. Interestingly, our ChIP data reveal that hMOF and H4K16ac were robustly enriched in the promoter region of the Il6 gene whose expression has previously been shown to be strongly associated with the microglial tumor-supporting phenotype.Citation23 Notably, IL6 signaling has been suggested to contribute to glioma malignancy through the promotion of glioma stem cell growth and survival,Citation43 as well as the maintenance of microglial tumor-supportive phenotype per se.Citation44
In the second part of these investigations, having uncovered that glioma-induced microglia conversion toward a tumor-supporting phenotype is coupled to an increase of H4K16 acetylation level in microglia, it was assessed whether affecting the expression level of this histone mark per se could affect the activation status of the microglia. Direct inhibition of SIRT1, using small interfering RNA or Ex527 treatment, impacted positively on the H4K16 acetylation level, whereas its activation, using SRT1720 treatment, impacted negatively on this histone mark. Increase in H4K16 acetylation level was found to promote the tumor-supporting phenotype of microglia, whereas a decrease in the expression level of this histone mark was found to be associated with reduced microglial tumor-supporting function. Thus, under these experimental conditions, that affect the H4K16 deacetylase activity of SIRT1, the modulation of the direct effect of SIRT1 on H4K16 appeared to be predominant over its effect on hMOF. In summary, manipulation of the microglial H4K16 acetylation level, taking advantage of the intrinsic H4K16 deacetylase or acetyltransferase activities of SIRT1 and hMOF, respectively, can be used to modulate the tumor-supporting function of microglia.
To summarize, we uncovered a completely novel role for a SIRT1-induced hMOF deacetylation/hMOF-mediated H4K16 acetylation axis in the induction of microglia activation in the context of glioma expansion and invasion. We also report that the intrinsic SIRT1 H4K16 deacetylase activity can counteract this effect. Therefore, considering these dual and opposing effects of SIRT1 on H4K16 acetylation status, and thereby possibly different regulation of the microglial tumor-supporting phenotype, we recommend caution in the interpretations of attempts to manipulate SIRT1 functions in the context of glioma tumors. Overall, this study provides new insights into the epigenetic mechanisms that control microglia polarization toward tumor associated phenotype. Elucidating in further detail these microglial epigenetic and transcriptional programs will be an important endeavor for finding of novel drug candidates to combat microglia associated brain diseases.
Materials and methods
Cell culture, treatments and transfection
Microglia BV2 (gift from G. Brown, University of Cambridge), glioma C6 (ATCC® CCL-107™) and glioma GL261 (DSMZ ACC 802, gift from R. Glass, University hospital of Munich) rodent cell lines have been used in this study. Cells were regularly tested with Venor™GeM mycoplasma detection kit (Minerva Biolabs) and maintained in DMEM medium supplemented with penicillin (100 μg/ml), streptomycin (100 μg/ml) and 10% fetal calf serum (FCS) (all from Gibco™ ThermoFisher Scientific). Segregated cocultures were performed using a transwell system using the above mentioned medium with FCS reduced to 5%. Transfection of BV2 cells was carried out with Lipofectamine® 3000 (Invitrogen, ThermoFisher Scientific) following the manufacturer's recommendation. Predesigned ON-TARGETplus SMARTpool siRNA against mouse SIRT1 (L-048962-09) and mouse MOF (L-049440-05) as well as non-targeting control (D-001810) were purchased from Dharmacon. BV2 cells were treated with 50 µM EX527 (Tocris Bioscience) for 4 h, 5 µM SRT1720 (Santa Cruz Biotechnology) for 17 hours, or 250 nM MG132 (Sigma Aldrich) for 4 hours.
Subcellular fractionation, immunoprecipitation and immunoblotting
Total protein extracts were made directly in Laemmli buffer. Cytoplasmic and nuclear protein fractions were collected using the NE-PER™ Nuclear and Cytoplasmic Extraction Reagents (ThermoFisher Scientific). For co-immunoprecipitation, BV2 cells were fixed with 1% formaldehyde and lysed with Pierce® IP lysis Buffer (Thermo Fisher Scientific) supplemented with protease inhibitor cocktail and additional 2 mM NAM and 10 µM sodium butyrate for acetyl lysine detection.Citation45 Pull down was performed according to the protocol of the Immunoprecipitation Kit Dynabeads® Protein G from novex™ (10007D, ThermoFisher Scientific) using rabbit anti-SIRT1 (ab12193, Abcam) and mouse anti-acetyl lysine [1C6] (ab22550, Abcam) antibodies. Protein extracts from cells or subcellular fractionations, and immunoprecipitated proteins were analyzed by western blot. Proteins were detected using the following antibodies: anti-SIRT1 (1:1000; ab28170, Abcam), anti-KAT8/MYST1/MOF [EPR15803] (ab200660, Abcam), anti-Acetyl-Histone H4 (Lys16) (1:1000; #07–329, EMD Millipore), anti-acetyl lysine (1:1000, #9441, Cell Signaling Technology), anti-H3 C-terminal (1:2000; 39163, Active Motif), anti-H3 (1:5000; 61199, Active Motif) anti-MMP14 (1:1000; ab53712, Abcam) and anti-Lamin B1 (1:1000; ab16048, Abcam). Immunoblot with anti-β-actin antibody (1:3000; A-3853, Sigma Aldrich) was used for standardization of protein loading. Clean-Blot IP detection reagent (HRP) (21230, Thermo Fisher Scientific) was used for the detection of hMOF protein without interference from denatured IgG upon acetyl lysine immunoprecipitation. Quantification of protein bands by densitometry was done using the ImageJ software. For quantification of protein expression, ratio of target- to housekeeping-gene expression was used; Results are presented relative to a reference as indicated in the figure legends, mostly untreated microglia monoculture, set as 1.
Transwell migration assays
8 µm-pore width transparent PET membrane inserts (Transwell, Corning) were used to measure cell migration capability. C6 glioma cells were seeded on top of the insert and BV2 microglia were seeded in the lower compartment. After 4 hours, the membranes from the inserts were washed with PBS and carefully cut out with a blade. Later on, the membranes were mounted with ProLong Gold antifade reagent with DAPI (Life technologies) and the nuclei of the migrated cells were counted under fluorescent microscopy.
Quantitative RT-PCR
Total RNA was isolated from BV2 cells using the total RNA extraction kit (RNeasy, Qiagen). cDNA was synthesized from 1 μg RNA using Oligo dT, dNTPs and Superscript III (Invitrogen). qPCR was performed using Syber Green reagents (Applied Biosystems) and the following primers (forward; reverse) for mouse: Nos2 (5′-gtggtgacaagcacatttgg-3′; 5′-aaggccaaacacagcatacc-3′), Il-1β (5′-gctgcttccaaacctttgac-3′; 5′-ttctccacagccacaatgag-3′), II-6 (5′-ggaccaagaccatccaattc-3′; 5′-ggcataacgcactaggtttg-3′), Mmp14 (5′-tccggataagtttgggactg-3′; 5′-cattatgctgccacttgagg-3′), Ccl22 (5′-ctgatgcaggtccctatggt-3′; 5′-gcaggattttgaggtccaga-3′), Chil3 (5′-cagggtaatgagtgggttgg-3′; 5′-cacggcacctcctaaattgt-3′), Sirt1 (5′-aaacagtga gaaaatgctgg-3′; 5′-ggtattgattaccctcaagc-3′), Mof (5′-tgacagaagtagataggcaag-3′; 5′-agcttagagagctcataactg-3′) and β-actin (5′-ttgctgacaggatgcagaag-3′; 5′-tgatccacatctgctggaag-3′). QPCR was run on ABI 7500 and β-actin was used as housekeeping gene for normalization.
Primary murine tumorspheres
Primary murine tumorspheres were isolated and cultured as described previously.Citation46,47 Briefly, neural progenitor cells were isolated from the SVZ of 11-week-old male Ink4 a/Arf−/− mice. Following in vitro expansion, EGFRvIII was constitutively expressed by retroviral transduction. Following transduction, tumorspheres were cultured in puromycin (2 μg/ml) for seven days. Cells were cultured on non-adherent plates (Ultralow Attachment Plates; Corning Inc.) in DMEM/F12 K medium plus B27 with 20 ng/ml EGF and 20 ng/ml FGF2.
Syngeneic transplant glioma mouse model
Experiments were performed in accordance with the Guidelines of the European Union Council, following Swedish regulations for the use of laboratory animals and approved by the Regional Animal Research Ethical Board, Stockholm, Sweden (Ethical permits N248/13). Male C57/BL6/J mice (Charles River) were housed in a 12/12-h light/dark cycle with access to food and water ad libitum. Postnatal day 16–17 male pups were anesthetized with isoflurane (5% for induction and 1.5% for maintenance). An incision was made on the scalp and the skin flaps were retracted to expose the skull. Animals received an intrastriatal injection of 5 × 10⁴ syngeneic GL261 glioblastoma cells expressing GFP suspended in 1 μl culture medium in the left hemisphere and vehicle in the right hemisphere (used as sham), using a 5 μl ILS microsyringe. The following coordinates relative to bregma anterior/posterior: + 0.7 mm, lateral: ± 2.5 mm, ventral: − 3 mm have been used. The injection was performed over 1 min and the syringe remained in the injection site for 5 min to reduce back flow, and slowly retracted over 1 min thereafter. The skin was sutured and animals were allowed to recover before they were returned to their dams. Animals were sacrificed 1 or 2 weeks after glioma transplantation. Animals were deeply anesthetized with sodium pentobarbital and transcardially perfused with 0.9% sodium chloride followed by fixation with 4% paraformaldehyde in 0.1 M phosphate buffer (pH 7.4). Brains were then transferred to 30% sucrose in 0.1 M phosphate buffer and left until they sank. 25-μm-thick horizontal free-floating sections were prepared using a microtome (Leica SM2010R) and stored in cryoprotection solution at 4 °C (25% glycerol, 25% ethylene glycol in 0.1 M phosphate buffer) for further histological analysis.
Immunofluorescence and confocal microscopy
BV2 cells were grown on coverslips. Paraformaldehyde-fixed cells were permeabilized and blocked in HEPES, 3% Bovine serum albumin and 0.3% Triton X-100, and incubated with primary antibodies at 4 °C overnight and secondary antibodies Alexa Fluor 488 conjugated anti-IgGs (1:1000; Invitrogen). Rabbit anti-SIRT1 (1:500; ab28170, Abcam) and rabbit anti-acetyl-Histone H4 (Lys16) (1:1000; #07–329, Millipore) were used in immunodetection for confocal microscope analysis. Sections from the GL261 glioma mouse model were incubated in sodium citrate (pH 6.0) for 30 min at 80 °C for antigen retrieval for H4K16ac staining and without sodium citrate treatment for SIRT1 staining. After incubation for 1 h in a blocking solution containing 3% normal donkey serum (Jackson ImmunoResearch Lab) and 0.1% Triton X-100 to prevent non-specific binding, the sections were incubated for 48 h with the following primary antibodies: rabbit anti-SIRT1 (1:50; ab28170, Abcam), or rabbit anti-acetyl-Histone H4 (Lys16) (1:100; #07–329, Millipore) and goat anti-Iba-1(1:500; Abcam ab107159). Sections were then incubated for 2 h with the appropriate secondary antibodies: Alexa555-conjugated donkey anti-rabbit IgG (1:1000; Invitrogen), or CF-633-conjugated donkey anti-goat (1:1000; Biotium). For both cells grown on coverslips and tissue sections, Hoechst 33342 (Invitrogen) was used as a nuclear counterstain (10-min incubation). Samples were analyzed under Zeiss LSM700 confocal laser scanning microscopy equipped with ZEN Zeiss software.
In situ proximity ligation assay (PLA)
BV2 cells were grown on coverslips and fixed with 4% paraformaldehyde in PBS. The In-situ PLA (Duolink II Detection Reagents Red Kit, Olink Bioscience) was performed according to manufacturer's instruction. After incubation with the blocking buffer, cells were incubated overnight at 4 °C with the following primary antibodies mouse anti-SIRT1 (1:500, #04–1557, EMD Millipore) or anti-acetyled lysine (1:500, ab22550, Abcam) and rabbit anti-MOF/MYST1 (1:1000, A300–992 A, Bethyl Laboratories). Cells were washed with supplied buffer A and incubated for 1 h at 37 °C with two PLA secondary probes (anti-mouse MINUS and anti-rabbit PLUS diluted 1:5 in the antibody diluent). Coverslips were washed in buffer A, followed by the ligation reaction for 30 min at 37 °C, in which PLA ligation stock was diluted 1:5 in dH2 O and 1:40 ligase was added and incubated. Protein-Protein interaction was amplified and detected by the PLA amplification reaction (1:5 amplification stock and 1:80 polymerase in dH2 O) for 100 min at 37 °C. After washing with wash buffer B, coverslips were mounted onto slides using mounting medium containing DAPI and samples were observed using confocal microscopy. Protein–protein interaction was measured as the number of fluorescent dots/cell analyzed with Duolink Image tool.
Chromatin immunoprecipitation (ChIP)
ChIP was performed following the HighCell# ChIP Kit protocol from Diagenode (C01010063 (kch-mahigh-G48)). 6 µg of the anti-acetyl-Histone H4 (Lys16) (#07–329, EMD Millipore), anti-KAT8/MYST1/MOF (ab200660, Abcam), or anti-H3 C-terminal (Active Motif, 39163) were used in each immunoprecipitation. Predesigned primers focusing on the 1 kb genomic regions in gene promoters for mouse IL-1β (NM_008361.3 (+) 01 kb) and IL6 (NM_031168.1 (+) 01 kb) and Mmp14 (NM_008608.2 (+) 01 kb) and Ccl22 (NM_009137.1 (+) 01 kb) and Chil3 (NM_009892.1 (+) 01 kb) used for ChIP were purchased from Qiagen (EpiTect ChIP qPCR Primer Assay for mouse). They were used at 5 µM/well and they target 1-kb region downstream of the transcription start sites (TSS).
Statistical analysis
Statistical analysis was performed using student's t-test. P < 0.05 was considered as statistically significant.
Disclosure of potential conflicts of interest
The authors declare no conflict of interest.
downloadFromZipFile.pdf
Download PDF (8.2 MB)Funding
D.S. is supported by a doctoral fellowship from the Karolinska Institutet Foundations. V.S. has been supported by postdoctoral fellowships from the Svenska Kulturfonden and the Sigrid Juselius Foundation. O.R.L. is supported by postdoctoral fellowships from the Swedish Childhood Cancer Foundation. This work has been supported by grants from the Swedish Research Council, Swedish Childhood Cancer Foundation, ERA-NET TracInflam, Strategic Research Programme in Cancer (StratCan), Swedish Cancer Foundation, Swedish Cancer Society, Swedish Brain Foundation and Karolinska Institutet Foundations. We thank Drs G. Brown, R. Glass, and JJ. Philips for providing us with reagents.
References
- Batchelor T. Patient information: High-grade glioma in adults (Beyond the Basics). UpToDate: Wolters Kluwer; 2015; https://www.uptodate.com/contents/high-grade-glioma-inadults-beyond-the-basics#
- Hambardzumyan D, Gutmann DH, Kettenmann H. The role of microglia and macrophages in glioma maintenance and progression. Nat Neurosci. 2015;19:20-27. doi:10.1038/nn.4185.
- Markovic DS, Vinnakota K, Chirasani S, Synowitz M, Raguet H, Stock K, Sliwa M, Lehmann S, Kälin R, van Rooijen N, et al. Gliomas induce and exploit microglial MT1-MMP expression for tumor expansion. Proc Natl Acad Sci U S A. 2009; 106:12530-35. doi:10.1073/pnas.0804273106. PMID:19617536.
- Muller A, Brandenburg S, Turkowski K, Muller S, Vajkoczy P. Resident microglia, and not peripheral macrophages, are the main source of brain tumor mononuclear cells. Int J Cancer. 2015; 137:278-88. doi:10.1002/ijc.29379. PMID:25477239.
- Saijo K, Glass CK. Microglial cell origin and phenotypes in health and disease. Nat Rev Immunol. 2011;11:775-87. doi:10.1038/nri3086. PMID:22025055.
- Hambardzumyan D, Gutmann DH, Kettenmann H. The role of microglia and macrophages in glioma maintenance and progression. Nat Neurosci. 2016;19:20-27. doi:10.1038/nn.4185. PMID:26713745.
- Markovic DS, Glass R, Synowitz M, Rooijen N, Kettenmann H. Microglia stimulate the invasiveness of glioma cells by increasing the activity of metalloprotease-2. Jf Neuropathol Exp Neurol. 2005;64:754-62. doi:10.1097/01.jnen.0000178445.33972.a9. PMID:16141784.
- Szulzewsky F, Pelz A, Feng X, Synowitz M, Markovic D, Langmann T, Holtman IR, Wang X, Eggen BJ, Boddeke HW, et al. Glioma-associated microglia/macrophages display an expression profile different from M1 and M2 polarization and highly express Gpnmb and Spp1. PloS One. 2015;10:e0116644. doi:10.1371/journal.pone.0116644. PMID:25658639.
- Garden GA. Epigenetics and the modulation of neuroinflammation. Neurotherapeutics: the journal of the American Society for Experimental NeuroTherapeutics. 2013;10:782-88. doi:10.1007/s13311-013-0207-4. PMID:23963788.
- Schones DE, Cui K, Cuddapah S, Roh TY, Barski A, Wang Z, Wei G, Zhao K. Dynamic regulation of nucleosome positioning in the human genome. Cell. 2008;132:887-98. doi:10.1016/j.cell.2008.02.022. PMID:18329373.
- Horikoshi N, Kumar P, Sharma GG, Chen M, Hunt CR, Westover K, Chowdhury S, Pandita TK. Genome-wide distribution of histone H4 Lysine 16 acetylation sites and their relationship to gene expression. Genome Integr. 2013;4:3. doi:10.1186/2041-9414-4-3. PMID:23587301.
- Hajji N, Wallenborg K, Vlachos P, Fullgrabe J, Hermanson O, Joseph B. Opposing effects of hMOF and SIRT1 on H4K16 acetylation and the sensitivity to the topoisomerase II inhibitor etoposide. Oncogene. 2010;29:2192-204. doi:10.1038/onc.2009.505. PMID:20118981.
- Rea S, Xouri G, Akhtar A. Males absent on the first (MOF): from flies to humans. Oncogene. 2007;26:5385-94. doi:10.1038/sj.onc.1210607. PMID:17694080.
- Donmez G. The neurobiology of sirtuins and their role in neurodegeneration. Trends Pharmacol Sci. 2012;33:494-501. doi:10.1016/j.tips.2012.05.007. PMID:22749331.
- Mellert HS, McMahon SB. hMOF, a KAT(8) with many lives. Mol Cell. 2009;36:174-5. doi:10.1016/j.molcel.2009.10.005. PMID:19854127.
- Zhao L, Wang DL, Liu Y, Chen S, Sun FL. Histone acetyltransferase hMOF promotes S phase entry and tumorigenesis in lung cancer. Cell Signal. 2013;25:1689-98. doi:10.1016/j.cellsig.2013.04.006. PMID:23628702.
- Zhong J, Li X, Cai W, Wang Y, Dong S, Yang J, Zhang J, Wu N, Li Y, Mao F, et al. TET1 modulates H4K16 acetylation by controlling auto-acetylation of hMOF to affect gene regulation and DNA repair function. Nucleic Acids Res. 2017;45:672-84. doi:10.1093/nar/gkw919. PMID:27733505.
- Lu L, Li L, Lv X, Wu XS, Liu DP, Liang CC. Modulations of hMOF autoacetylation by SIRT1 regulate hMOF recruitment and activities on the chromatin. Cell Res. 2011;21:1182-95. doi:10.1038/cr.2011.71. PMID:21502975.
- Zhang R, Erler J, Langowski J. Histone Acetylation Regulates Chromatin Accessibility: Role of H4K16 in Inter-nucleosome Interaction. Biophys J. 2017;112:450-9. doi:10.1016/j.bpj.2016.11.015. PMID:27931745.
- Taylor GC, Eskeland R, Hekimoglu-Balkan B, Pradeepa MM, Bickmore WA. H4K16 acetylation marks active genes and enhancers of embryonic stem cells, but does not alter chromatin compaction. Genome Res. 2013;23:2053-65. doi:10.1101/gr.155028.113. PMID:23990607.
- Shogren-Knaak M, Ishii H, Sun JM, Pazin MJ, Davie JR, Peterson CL. Histone H4-K16 acetylation controls chromatin structure and protein interactions. Science (New York, NY). 2006;311:844-7. doi:10.1126/science.1124000.
- Burguillos MA, Deierborg T, Kavanagh E, Persson A, Hajji N, Garcia-Quintanilla A, Cano J, Brundin P, Englund E, Venero JL, et al. Caspase signalling controls microglia activation and neurotoxicity. Nature. 2011;472:319-24. doi:10.1038/nature09788. PMID:21389984.
- Shen X, Burguillos MA, Osman AM, Frijhoff J, Carrillo-Jimenez A, Kanatani S, Augsten M, Saidi D, Rodhe J, Kavanagh E, et al. Glioma-induced inhibition of caspase-3 in microglia promotes a tumor-supportive phenotype. Nat Immunol. 2016;17:1282-90. doi:10.1038/ni.3545. PMID:27618552.
- Maes W, Van Gool SW. Experimental immunotherapy for malignant glioma: lessons from two decades of research in the GL261 model. Cancer immunology, immunotherapy: CII. 2011;60:153-60. doi:10.1007/s00262-010-0946-6. PMID:21120655.
- Fullgrabe J, Lynch-Day MA, Heldring N, Li W, Struijk RB, Ma Q, Hermanson O, Rosenfeld MG, Klionsky DJ, Joseph B. et al. The histone H4 lysine 16 acetyltransferase hMOF regulates the outcome of autophagy. Nature. 2013;500:468-71.
- Vaquero A, Sternglanz R, Reinberg D. NAD+-dependent deacetylation of H4 lysine 16 by class III HDACs. Oncogene. 2007;26:5505-20. doi:10.1038/sj.onc.1210617. PMID:17694090.
- Kapoor-Vazirani P, Kagey JD, Powell DR, Vertino PM. Role of hMOF-dependent histone H4 lysine 16 acetylation in the maintenance of TMS1/ASC gene activity. Cancer Res. 2008;68:6810-21. doi:10.1158/0008-5472.CAN-08-0141. PMID:18701507.
- Taipale M, Rea S, Richter K, Vilar A, Lichter P, Imhof A, Akhtar A. hMOF histone acetyltransferase is required for histone H4 lysine 16 acetylation in mammalian cells. Mol Cell Biol. 2005;25:6798-10. doi:10.1128/MCB.25.15.6798-6810.2005. PMID:16024812.
- Tanno M, Sakamoto J, Miura T, Shimamoto K, Horio Y. Nucleocytoplasmic shuttling of the NAD+-dependent histone deacetylase SIRT1. J Biol Chem. 2007;282:6823-32. doi:10.1074/jbc.M609554200. PMID:17197703.
- Ostrom QT, Gittleman H, Stetson L, Virk SM, Barnholtz-Sloan JS. Epidemiology of gliomas. Cancer Treat Res. 2015;163:1-14. doi:10.1007/978-3-319-12048-5_1. PMID:25468222.
- Brandenburg S, Muller A, Turkowski K, Radev YT, Rot S, Schmidt C, Bungert AD, Acker G, Schorr A, Hippe A, et al. Resident microglia rather than peripheral macrophages promote vascularization in brain tumors and are source of alternative pro-angiogenic factors. Acta Neuropathol. 2016;131:365-78. doi:10.1007/s00401-015-1529-6. PMID:26718201.
- Pyonteck SM, Akkari L, Schuhmacher AJ, Bowman RL, Sevenich L, Quail DF, Olson OC, Quick ML, Huse JT, Teijeiro V, et al. CSF-1R inhibition alters macrophage polarization and blocks glioma progression. Nat Med. 2013;19:1264-72. doi:10.1038/nm.3337. PMID:24056773.
- Quail DF, Bowman RL, Akkari L, Quick ML, Schuhmacher AJ, Huse JT, Holland EC, Sutton JC, Joyce JA. The tumor microenvironment underlies acquired resistance to CSF-1R inhibition in gliomas. Science. 2016;352:aad3018. doi:10.1126/science.aad3018. PMID:27199435.
- Dion MF, Altschuler SJ, Wu LF, Rando OJ. Genomic characterization reveals a simple histone H4 acetylation code. Proceedings of the National Academy of Sciences of the United States of America. 2005;102:5501-06. doi:10.1073/pnas.0500136102. PMID:15795371.
- Oppikofer M, Kueng S, Martino F, Soeroes S, Hancock SM, Chin JW, Fischle W, Gasser SM. A dual role of H4K16 acetylation in the establishment of yeast silent chromatin. EMBO J. 2011;30:2610-21. doi:10.1038/emboj.2011.170. PMID:21666601.
- Kwon HS, Ott M. The ups and downs of SIRT1. Trends Biochem Sci. 2008;33:517-25. doi:10.1016/j.tibs.2008.08.001. PMID:18805010.
- Hisahara S, Chiba S, Matsumoto H, Tanno M, Yagi H, Shimohama S, Sato M, Horio Y. Histone deacetylase SIRT1 modulates neuronal differentiation by its nuclear translocation. Proc Natl Acad Sci U S A. 2008;105:15599-604. doi:10.1073/pnas.0800612105. PMID:18829436.
- Yang Y, Fu W, Chen J, Olashaw N, Zhang X, Nicosia SV, Bhalla K, Bai W. SIRT1 sumoylation regulates its deacetylase activity and cellular response to genotoxic stress. Nat Cell Biol. 2007;9:1253-62. doi:10.1038/ncb1645. PMID:17934453.
- Nasrin N, Kaushik VK, Fortier E, Wall D, Pearson KJ, de Cabo R, Bordone L. JNK1 phosphorylates SIRT1 and promotes its enzymatic activity. PLoS One. 2009;4:e8414. doi:10.1371/journal.pone.0008414. PMID:20027304.
- Peng L, Ling H, Yuan Z, Fang B, Bloom G, Fukasawa K, Koomen J, Chen J, Lane WS, Seto E. SIRT1 negatively regulates the activities, functions, and protein levels of hMOF and TIP60. Mol Cell Biol. 2012;32:2823-36. doi:10.1128/MCB.00496-12. PMID:22586264.
- Yuan H, Rossetto D, Mellert H, Dang W, Srinivasan M, Johnson J, Hodawadekar S, Ding EC, Speicher K, Abshiru N, et al. MYST protein acetyltransferase activity requires active site lysine autoacetylation. The EMBO journal. 2012;31:58-70. doi:10.1038/emboj.2011.382. PMID:22020126.
- McCullough CE, Song S, Shin MH, Johnson FB, Marmorstein R. Structural and Functional Role of Acetyltransferase hMOF K274 Autoacetylation. J Biol Chem. 2016;291:18190-98. doi:10.1074/jbc.M116.736264. PMID:27382063.
- Wang H, Lathia JD, Wu Q, Wang J, Li Z, Heddleston JM, Eyler CE, Elderbroom J, Gallagher J, Schuschu J, et al. Targeting interleukin 6 signaling suppresses glioma stem cell survival and tumor growth. Stem Cells. 2009;27:2393-404. doi:10.1002/stem.188. PMID:19658188.
- Zhang J, Sarkar S, Cua R, Zhou Y, Hader W, Yong VW. A dialog between glioma and microglia that promotes tumor invasiveness through the CCL2/CCR2/interleukin-6 axis. Carcinogenesis. 2012;33:312-9. doi:10.1093/carcin/bgr289. PMID:22159219.
- Hoffman EA, Frey BL, Smith LM, Auble DT. Formaldehyde crosslinking: a tool for the study of chromatin complexes. J Biol Chem. 2015;290:26404-11. doi:10.1074/jbc.R115.651679. PMID:26354429.
- Phillips JJ, Huillard E, Robinson AE, Ward A, Lum DH, Polley MY, Rosen SD, Rowitch DH, Werb Z. Heparan sulfate sulfatase SULF2 regulates PDGFRalpha signaling and growth in human and mouse malignant glioma. J Clin Invest. 2012;122:911-22. doi:10.1172/JCI58215. PMID:22293178.
- Ligon KL, Huillard E, Mehta S, Kesari S, Liu H, Alberta JA, Bachoo RM, Kane M, Louis DN, Depinho RA, et al. Olig2-regulated lineage-restricted pathway controls replication competence in neural stem cells and malignant glioma. Neuron. 2007;53:503-17. doi:10.1016/j.neuron.2007.01.009. PMID:17296553.