
ABSTRACT
Natural Killer (NK) cells control metastatic dissemination of murine tumors and are an important prognostic factor in several human malignancies. However, tumor cells hijack many of the NK cell functional features compromising their tumoricidal activity. Here, we show a deleterious role of the TNFα/TNFR2/BIRC3/TRAF1 signaling cascade in NK cells from the tumor microenvironment (TME). TNFα induces BIRC3/cIAP2 transcripts and reduces NKp46/NCR1 transcription and surface expression on NK cells, promoting metastases dissemination in mice and poor prognosis in GIST patients. NKp30 engagement, by promoting the release of TNFα, also contributes to BIRC3 upregulation, and more so in patients expressing predominantly NKp30C isoforms. These findings reveal that in the absence of IL-12 or a Th1-geared TME, TNFα can be considered as a negative regulatory cytokine for innate effectors.
Abbreviations
| 4-1BB/CD137/TNFRSF9 | = | Tumor Necrosis Factor Receptor Superfamily Member 9 |
| BIRC3 | = | Baculoviral IAP Repeat Containing 3 |
| Cbl-b | = | Casitas B-lineage lymphoma-b |
| CD94/NKG2A | = | Cluster of Differentiation 94/Killer cell lectin-like receptor subfamily C, member 1 |
| CDK8 | = | Cyclin-dependent kinase 8 |
| cIAP2 | = | Cellular Inhibitor of Apoptosis 2 |
| CIS | = | Cytokine-Inducible SH2-containing protein |
| CTLA-4 | = | Cytotoxic T-Lymphocyte-Associated protein 4 |
| FADD | = | Fas-Associated protein with Death Domain |
| Fas | = | Tumor Necrosis Factor Receptor Superfamily Member 6 |
| GIST | = | Gastrointestinal Stromal Tumor |
| GrzA | = | Granzyme A |
| GSK3 | = | Glycogen synthase kinase 3 |
| HCV | = | Hepatitis C Virus |
| HV | = | Healthy Volunteer |
| IFNγ | = | Interferon γ |
| IL-10 | = | Interleukin-10 |
| IL-12 | = | Interleukin-12 |
| IL-33 | = | Interleukin-33 |
| ILC1 | = | Innate Lymphoid Cell 1 |
| KIR | = | Killer-cell immunoglobulin-like receptor |
| mAb | = | monoclonal Antibody |
| MM | = | Metastatic Melanoma patient |
| NF-κB | = | Nuclear Factor-kappa B |
| NK | = | Natural Killer |
| NKp30/NCR3 | = | Natural Killer Cell P30-Related Protein/Natural Cytotoxicity Triggering Receptor 3 |
| NKp46/NCR1 | = | Natural Killer Cell P46-Related Protein/Natural Cytotoxicity Triggering Receptor 1 |
| PBMC | = | Peripheral Blood Mononuclear Cell |
| PD-1 | = | Programmed cell death protein 1 |
| PD-L1 | = | Programmed death-ligand 1 |
| TGFβ | = | Transforming growth factor β |
| Th1 | = | T helper cells 1 |
| TIGIT | = | T cell immunoreceptor with Ig and ITIM domains |
| TIL | = | Tumor Infiltrating Lymphocyte |
| TIM3 | = | T-cell immunoglobulin and mucin-domain containing-3 |
| TME | = | Tumor Microenvironment |
| TNFα | = | Tumor Necrosis Factor α |
| TNFR2 | = | TNF Receptor 2 |
| TRAD | = | Tumor necrosis factor receptor type 1-associated DEATH domain protein |
| TRAF1 | = | TNF Receptor Associated Factor 1 |
| TRAIL | = | Tumor-necrosis-factor Related Apoptosis Inducing Ligand |
Introduction
The interactions between the immune system and cancer cells are governed by a complex network of biological pathways, resulting in an overriding tolerance. Tolerance is maintained by multiple mechanisms, including regulatory immune cells, immunosuppressive cytokines and chemokines, and “immune checkpoint” receptors that down-modulate antitumor immune functions. The CTLA-4/B7.2 and PD-1/PD-L1 receptor/ligand pairs are dominant immune checkpoint axis operative in the tumor microenvironment (TME), co-opted by cancers to evade immune attack.Citation1 Monoclonal antibodies (mAbs) blocking these pathways have emerged as powerful weapons in the oncologic armamentarium to harness T cell effectors and/or decrease regulatory T cell functions.Citation2–4 However, sequenced therapy targeting first NK cells and then T cells might be considered, given that tumor cell attack and IFNγ release by NK cells foster the TME conducive/contributing to the development of antigen-specific T cell- based immune responses.Citation5,Citation6
Despite the discovery of the ‘natural killing’ capacity of NK cells 40 years ago, NK cell function has not yet been successfully exploited in the clinic. NK cells are a heterogeneous population comprising cytotoxic, immunoregulatory, memory and unlicensed-licensed subsets. Substantial interspecies differences, relative lack of proliferative capacity in vivo, evidence that early cross-talk with myeloid suppressor cells facilitates the metastatic niche, limited homing capacities to tumor beds and dysfunction at tumor sites represent crucial hindrances for their clinical implementation.Citation7
The balance between activating and inhibitory receptors on NK cells determines the activation status of NK cells. Abolishing the inhibitory signals of NK cells by means of blocking monoclonal antibodies (mAbs) supposedly restore full-blown NK cell activity. Hence, blocking mAbs directed against CTLA-4, PD-1, PDL-1, Tim3 and KIR not only unleash T cell functions but also NK cell activity to various degrees.Citation8–13
More importantly, apart from the killer inhibitory receptors and the CD94/NKG2A pathway which are currently targeted in clinical trials,Citation14 only a few other NK cell specific (or non-specific) immune checkpoints have been described, mostly in the context of mouse tumor immunosurveillance (such as CD96,Citation15 TIGIT,Citation16 and the Cbl-b,Citation17 CDK8,Citation18 GSK3,Citation19 CISCitation20,Citation21 signaling cascades). In addition, these immune checkpoints do not alone explain all dysfunctional capacities of NK tumor infiltrating lymphocytes (TILs), suggesting that additional inhibitory molecules may be in play in dampening NK cell functions.
Therefore, there is a need for a deeper understanding of the most relevant immune checkpoints operating in human solid malignancies. The TME offers several complementary mechanisms accounting for NK cell dysfunctions (among which TGFβ, adenosine, IL-10 and metalloproteinases shedding ligands for activating receptorsCitation7). We and others have reported in frequent and paradigmatic adult and pediatric malignancies (lung cancers, melanoma, neuroblastoma and gastrointestinal sarcomas) that NK cell functional deficiencies dictate poor prognosis.Citation22–29
Our group unraveled the important role of the activating receptor NKp30 and more importantly, NKp30 isoforms in the regulation of NK cell functions, in B7-H6 (NKp30 ligand) expressing neuroblastomaCitation24,Citation30 and GIST.Citation25–28,Citation31 We described the immunosuppressive NCR3/NKp30C isoform expressed by less than 50% individuals, unleashing IL-10 production by NK cells (in contact with dendritic cells) and defects in TNFα release,Citation27 whilst other patients present a dominant NKp30AB phenotype associated with Th1 and lytic functions. GIST patients with dominant NKp30C transcription were endowed with poor prognosis.Citation27 We took advantage of the GIST model system in which both NK cells and NKp30 isoforms display a pathophysiological relevance in patients to scrutinize which inhibitory pathways could be associated with TIL NK cell dysfunctions. Surprisingly, we unraveled a deleterious role of the TNFα/TNFR2/BIRC3/TRAF1 signaling pathway, inducing the downregulation of Ncr1 gene transcription and NKp46 surface expression correlating with NKp30C patient’ profiling. These findings could be validated across species since TNFα also induced a marked increase and reduction of Birc3 and Ncr1 genes transcription respectively and tended to facilitate metastases dissemination in the B16F10 mouse melanoma model.
Results
Regulation of Birc3/cIAP2 and Traf1 gene transcripts in NK TILs in GIST patients
We performed flow cytometry based-cell sorting of the CD3−CD56bright NK cell subset in peripheral blood as well as paired GIST tumors at diagnosis of 12 patients, for whom the NKp30 isoform profiling (AB versus C26) and clinical prognosis (time to progression after imatinib mesylate) were characterized and monitored (Suppl. Table 1). The transcriptional landscape of these NK cell subsets was analyzed by Agilent-based DNA microarrays and statistical analyses were performed, attempting to select gene products mostly overexpressed in tumor beds (rather than blood), in cases of poor (rather than favorable) prognosis as well as in NKp30C (rather than AB) isoform profiles (, Suppl. Fig. 1). Twenty one gene candidates were statistically significant but after specific probe-based qPCR analyses, only 6 gene products overexpressed in tumors and in poor prognosis patients (early relapse and NKp30C profiling) were retained in this model (). Among these candidates, baculoviral IAP repeat containing 3 (BIRC3, also called cIAP2) and tumor necrosis factor receptor (TNFR)-associated factor 1 (TRAF1) were the strongest hallmarks of NK TILs associated with NKp30C unfavorable profile (). Of note, these two parameters were positively correlated (). Traf1 was also under expressed in GIST presenting with a mutation in the exon 11 of c-kit (known to be of better prognosis) (Suppl. Fig. 1).
Figure 1. Comprehensive transcriptomics analyses revealing TRAF1 and cIAP2/BIRC3 in NK TILs from GIST. (A-B) Heat map representation of microarray analyses of CD3-CD56bright NK cells from paired blood and tumors (A) in NKp30 AB versus C profiles (B) on about 20,000 gene products, the most significant hits contrasting the two groups according to the median of the whole cohort being depicted. Of note, for the genes products identified by several distinct probe sets, the most variant was retained in the model. p-values (one-sided differential test) are indicated on the right side for each significant gene product. (C-D) RT-PCR evaluation of the transcription of each gene product pre-selected from the microarray analyses, comparing blood versus tumor expression in at least 3 GIST bearing patients (C) or NKp30AB versus NKp30C profiles (D). (E) Scatter plot, Pearson correlations coefficient and p-value between TRAF1 and BIRC3 transcript abundancy in tumors. Each dot represents one HV or patient. Wilcoxon matched pairs test: * p < 0.05, ** p < 0.01, *** p < 0.001.
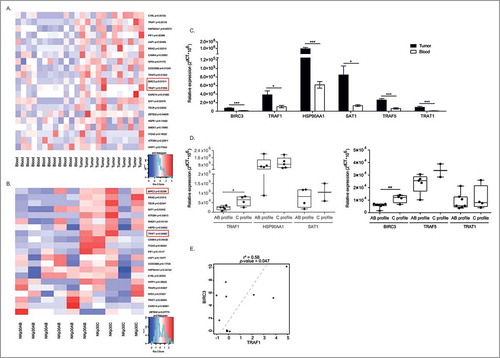
Altogether, these microarray analyses point to a potential regulatory role of the cIAP2/BIRC3 – TRAF1 signaling pathway in NK GIST TILs.
Regulation of Birc3/Traf1 gene expression in NK cells
TRAF1/2 and cIAP1/2 are members of the TNF receptor associated factor (TRAF) and the inhibitor of apoptosis (IAP) families, respectively. They are critical for both the TNFα-induced canonical and the non-canonical NF-κB signaling pathways.Citation32,Citation33 We investigated which of the TNFR family members could lead to the coordinated transcription of both Birc3/cIAP2 and Traf1 gene products in human circulating NK cells of healthy volunteers (HV) (, Suppl. Fig. 2A), in NK cell lines (Suppl. Fig. 2B) and in NK cells from melanoma patients (MM) (). We found that TNFα (but not engagement of CD137/4-1BB or CD95/Fas, other receptors of the TNF receptors superfamily expressed by the NK cells) selectively induced an increased transcription of Birc3/cIAP2 and Traf1 gene products, in all conditions (except in NKL, Suppl. Fig. 2B). Moreover, triggering of NKp30 or CD16 NK cell activating receptors increased the levels of mRNA encoding BIRC3 and TRAF1 in NK from HV and MM (). Given that engagement of NK cell activating receptors releases TNFα, it is not surprising to observe that blockade of binding and signaling through TNFR2 using neutralizing antibodies anti-TNFR2 tend to reduce the NKp30-mediated upregulation of Birc3 and Traf1 transcripts (). Of note, both NK cells subsets differing for CD56 expression levels (CD56dim vs CD56bright) responded equally to TNFα stimulation via upregulation of Birc3 and Traf1 mRNA (Suppl. Fig. 2C). Finally, both Birc3 and Traf1 gene products induced by TNFα () or NKp30 cross-linking () were highly correlated in circulating NK cells from HV and MM patients.
Figure 2. NK cell stimulation by TNFα or NCR3 triggering leads to markedly increased transcription of Traf1 and Birc3. (A-C) Regulation of expression of TRAF1 and BIRC3 in HV and melanoma patients. RT-PCR of both transcripts in blood-derived-NK cells, performed 12 h post-stimulation with 50 ng/mL of TNFα or after cross-linking of NCR3/NKp30 and CD16 (or IgG2a and IgG, respectively, isotype control Abs). Graphs show the relative expression normalized to β2 microglobulin expression in HV (A, left panel for TRAF1 and right panel for BIRC3) and melanoma patients (C), with or without blockade of the TNFR2 by specific neutralizing Abs or IgG1 isotype controls (B) in HV (upper panel) and MM (lower panel). (D-E) Spearman correlations between TRAF1 and BIRC3 transcript abundancy in blood NK cells post-TNFα stimulation (D) or NKp30 engagement (E). Each dot represents one HV or patient. Student paired t-test for A, Wilcoxon matched pairs test for (B-E): * p < 0.05, ** p < 0.01, *** p < 0.001.
TNFα induced downregulation of NCR1/NKp46 in NK cells
Interestingly, stimulation of human NK cells with TNFα or engagement of NK cell activating receptors (such as NKp30 or CD16) not only upregulated the transcription of Birc3 and Traf1 gene products but concomitantly downregulated the activating receptor NKp46 in HV () and MM () in a TNFα/TNFR2-dependent manner (Suppl. Fig. 3A-B). This was observed regardless of CD56 expression (Suppl. Fig. 3C) and with NK92 cell line (Suppl. Fig. 3D). In contrast to TNFα, TGFβ failed to downregulate the levels of mRNA encoding NCR1/NKp46 (, right panel) and did not boost the TNFα-mediated effects. We failed to observe any TNFα-dependent NK cell death or anti-proliferative effects (Suppl. Fig. 4), or inhibition of IFNγ secretion (). Moreover, at the protein level, TNFα tended to induce a slight but significant decrease in surface expression of NKp46, on the whole NK cell population (, upper panel) and on CD56dim but more markedly on CD56bright NK cells (, Suppl. Fig. 3E), as also observed with TGFβ on CD56dim NK cells (p = 0.03; Suppl. Fig. 3E). Also, overlay of one representative HV shows that TNFα-induced down regulation of NCR1 is dose dependent (, lower panel). Of note, TNFα failed to regulate other important activating receptors (such as NKG2D, Suppl. Fig. 2D) or immune checkpoints (such as PD-1, not shown).
Figure 3. TNFα markedly and selectively downregulates NCR1 expression. (A-C) Regulation of expression of NCR1 in purified blood NK cells from HV (A) and melanoma patients (B) following 12 h-stimulation with rTNFα at 50 ng/mL or NKp30 engagement or rTGFβ at 5 ng/mL (C). Each dot represents one HV or patient. (D-E) NKp46 protein expression on the cell surface of NK cells as assessed in flow cytometry at 48 h post-stimulation at increasing dosing of rTNFα (5 or 50 ng/mL) or rTGFβ (5 ng/mL) in concatenated data from at least 6 HV (left panel) and 6 metastatic melanoma (MM, right panel) (D) and in two representative individuals in overlayed mean fluorescence intensities (E), one treated with rTNFα and TGFβ (upper panel) and another with different concentration of rTNFα (lower panel). Of note, neutralizing anti-TNFR2 Ab inhibits the down regulation of NKp46 at the surface of MM. MFI were superimposable using an isotype control staining in all conditions of stimulation (not shown). Student paired t-test for A, Wilcoxon matched pairs test (B-D): * p < 0.05, ** p < 0.01, *** p < 0.001.
We next investigated the impact of the NKp30 isoform profiling in the TNFα-dependent regulation of BIRC3/TRAF1 and NCR1/NKp46 in circulating NK cells from HV. While NKp30-dependent stimulation of NK cells from NKp30C individuals led to lower Th1 cytokine secretion compared with NKp30AB profiles () as already reported,Citation27 we obtained the opposite result using TNFα stimulation of NK cells (). Next, we observed that both NKp30 isoform profiles did respond to TNFα stimulation for Birc3/Traf1 genes upregulation as well as Ncr1 gene downregulation (). Of note, there was a strong inverse correlation between BIRC3 and NCR1/NKp46 encoding transcripts (p = 0.00012; not shown), but this is attributable to individuals harboring a NKp30C isoform profile ().
Figure 4. Anti-correlations between BIRC3 and NCR1 in NKp30C individuals. (A-B) Th1 cytokine release from NK cells stimulated through NKp30 engagement (A) or rTNFα (B) in AB versus C NKp30 profile as determined by ELISA at 12 h (A) and 24 h (B). (C) RT-PCR of all three transcripts (TRAF1, BIRC3, NCR1) in blood –derived-NK cells, performed 12 h post-stimulation with 50 ng/mL of TNFα according to the NKp30 isotype profiles. (D) Spearman correlations between NCR1 and BIRC3 transcript abundancy in blood NK cells post-TNFα stimulation in all patients, separating NKp30 AB from NKp30C individuals. Wilcoxon matched pairs test (A-B) Student paired t-test (C): * p < 0.05, ** p < 0.01, *** p < 0.001.
Subsequently, we studied the effects of TNFα on tumor infiltrating lymphocytes (TILs) from GIST patients. In three independent cases, this cytokine could also induce Traf1 transcripts but less consistently Birc3 counterparts (). NKp30 engagement of those TIL NK cells appeared to mimic the effects of TNFα in the one available GIST case (). In parallel, we observed a downregulation of Ncr1 gene transcription () and protein expression on these TIL NK cells ().
Figure 5. TNFα-mediated downregulation of NCR1 in intratumor GIST NK cells. Same experimental settings as in , after sorting of NK cells from fresh GIST tumors. RT-qPCR expression of TRAF1, BIRC3, as well as NCR1 after stimulation with rTNFα at 12 h of ex vivo stimulation in 3 GIST tumors. (B) Membrane expression of NKp46/NCR1 after 48 h incubation of NK TIL with rTGFβ or TNFα in mean fluorescence intensity. MFI were superimposable using an isotype control staining in all conditions of stimulation (not shown).
The TNFα/TNFR2 pathway promotes aggressiveness of NK cell-dependent tumors
We investigated the capacity of TNFα to regulate the expression of Birc3 and Traf1 genes in murine splenic NK cells. Here again, as in human cells, the exposure of mouse NK cells to TNFα enhanced the levels of both transcripts and decreased that of Ncr1 (), only in WT mice but not in TNFR2−/− counterparts (). To address the relevance of these findings, we treated RMA-S, a TAP2-deficient β2 microglobulin negative lymphoma under the control of NK cells,Citation34 with TNFα or a neutralizing anti-mouse TNFR2 Ab. None of these manoeuvers could interfere with the growth of this s.c. lymphoma which fails to express NCR1 ligands (Suppl. Fig. 5). In sharp contrast, Etanercept, a TNFR2-Fc fusion protein (but not Anakinra, blocking IL-1R1, not shown) reduced the number of metastases from B16F10 melanoma known to be controlled through NCR1/NKp46 receptors in C57BL/6 mice ().Citation35 Conversely, while administrations of the cytokine TNFα twice a week did not have any prometastatic effects (not shown), daily doses of recombinant TNFα accelerated metastases dissemination ().
Figure 6. Regulation of metastases dissemination by interfering with the TNFα/TNFR2 interaction. (A) Transcription of Traf1, Birc3 and Ncr1 gene products in mouse splenic NK cells post-stimulation with rTNFα as assessed by RT-PCR at 12 h. Similar experimental settings as with human blood or tumor NK cells. (B) Same settings as Fig. 6A but in TNFR2 KO mice. (C-D) B16F10 melanoma lung metastases dissemination post i.v. injection at 3 weeks without treatment (PBS injection) or with daily inoculation of 1 µg of mouse rTNFα for 3 weeks (D, left) or with an inhibitor of TNFα (Etanercept) twice a week for 3 weeks starting at day 1 post-tumor inoculation (D, right). Representative micrograph pictures of metastatic lungs in each group (C) and concatenated data from 2 experiments yielding similar results (C) at mouse sacrifice. Wilcoxon matched pairs test (A), Mann Whitney test (C, D): * p < 0.05.
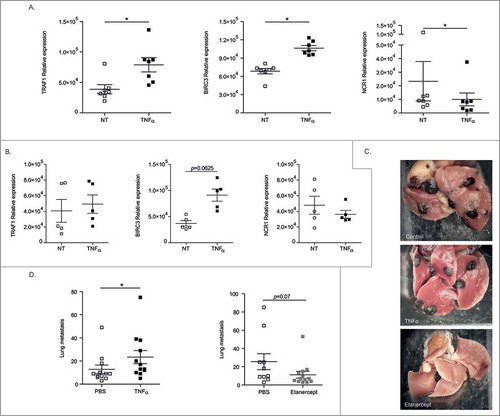
These findings suggest that TNFα may act as a protumorigenic cytokine in NCR1-dependent tumor models.
Discussion
The bottom-up strategy consisting of transcriptomic analyses of TIL NK cells from poor prognosis patients (relative to good prognosis counterparts), and selecting for gene products overexpressed in TIL compared with paired blood specimen revealed two molecular components belonging to the TNFR signaling pathway, i.e. BIRC3/cIAP2 and TRAF1. This finding culminated in the demonstration that TNFα is the main regulator of the expression of both molecules, and leads in turn in the downregulation of the main NK cell activating receptor NCR1/NKp46 expected to keep in check tumor progression.
Tumor necrosis factor (TNF) receptor-associated factor (TRAF) 1 was originally identified based on its ability to interact with the cytosolic domain of TNF receptor type 2 (TNFR2).Citation36 TRAF1 in fact associates with multiple TNFR family members and can also bind several protein kinases and adaptor proteins suggesting that TRAF1 likely possesses multiple functions in cytokine signaling networks. TRAF1 is unique among TRAF proteins for two reasons. First, it lacks a RING finger domain present in TRAF2-6 that has been shown to be required for TRAF2- and TRAF6-mediated activities. Second, TRAF1 has the most restricted expression among TRAFs, and is found almost exclusively in activated lymphocytes, dendritic cells, and certain epithelia.
The biology of TRAF1 is complex, TRAF1 exhibiting multifaceted functions.Citation37 Notably, TRAF1 associates with TRAF2 to interact with TNFR2, the TRAF1-TRAF2 heterodimers inactivating TNFR2 activities. TRAF1 expression is induced after NF-κB activation, and therefore could participate in the negative feedback loop to suppress TNFR2-induced NF-κB activity. Recent evidence obtained from TRAF1−/− mice show that TRAF1-deficient T cells are hyper-responsive to TNFα, exhibiting increased T cell receptor (TCR)-dependent T cell proliferation in vitro. Also, these TRAF1−/− mice had increased sensitivity to TNFα-induced skin necrosis in vivo. This initial report supported a role for TRAF1 as a negative regulator of signaling by certain TNF-family receptors.
Additional complexity in TRAF1 biology came from compelling evidence of its pro-and anti-apoptotic functions. The caspase inhibitors cIAP2/BIRC3 and FLIP (which are NF-κB dependent) also bind to TRAF1 and TRAF2, and can be recruited to the TNFR1 receptors through interaction with FADD, FADD/TRADD complexes leading to caspase 8-dependent apoptosis. Hence, TRAF1 can be converted into a pro-apoptotic protein after cleavage of caspase 8, after cell stimulation with FasL or TNFα.Citation38,Citation39 However, results obtained in TRAF1 transgenic mice showed that TRAF1 suppress TCR (or Fas and TNFR1)-mediated apoptosis.Citation40 The balance between pro-apoptotic (FADD/casp8) and anti-apoptotic (TRAF1/TRAF2/cIAP1/cIAP2) complexes that are recruited to TNFR1 induce either gene expression or apoptosis. This flip-flop phenotype of TRAF1 might depend upon i) which protein TRAF1 binds to, ii) status of TRAF1 (cleaved or not by casp-8), iii) member of TNF-family receptors that TRAF1 interact with at a given time point, knowing that some are stimulatoryCitation41 and some are inhibitory.Citation42,Citation43
Here we show that TNFR2/TRAF1/c-IAP2 signaling is associated with an NK cell suppressive phenotype. It is not related to the pro-or anti-apoptotic effects of TRAF1 but may be related to its interference on cytokine signaling. Several mechanisms pertaining to the intrinsic role of TNFα or to NF-κB activation could be in play.
NK cell activation, notably through NKp30 engagement or exposure to TNFα, leads to rapid activation of the canonical pathway explaining the congenital NK cell immunodeficiency related to mutations of the NF-κB essential modulator (NEMO) gene.Citation44 However, NF-κB nuclear translocation in NK cells is not always associated with Th1-like NK cell activating pathways. Indeed, IL-33 produced by decidual stromal cells, by transducing a ST2-specific triggering of decidual NK cells induced a Th2-like polarization (IL-4, IL-13, IL-10) associated with a loss of perforin/GrzA and imbalanced expression of activating (NCR)/inhibitory (KIR) NK receptors, all culminating in an immunosuppressive cross-talk.Citation45 This is reminiscent of the differential signaling pathways involved in NF-κB nuclear translocation contrasting NKp30C versus NKp30AB NK cell profiles, which might explain stronger association of cIAP2/BIRC3 with NKp30C phenotypes. It appears indeed from our data that TNFα-exposed NK cells from NKp30C individuals produce more IFNγ (and perhaps more TNFα) in a positive feedback loop than those from NKp30AB individuals, leading to chronic TNFα production (instead of a ‘desirable’ short term apoptosis), maintaining the immunosuppressive NK cells.
On one hand, we identified the TNFa/TNFR2/TRAF1/BIRC3 pathway contrasting profile A/B versus C tumors (), and could show () that TNFa-induced upregulation of BIRC3 was anticorrelated with NCR1 levels in profile C (but not in profile A/B). On the other hand, we failed to observe significant functional differences between NK cells derived from patients harboring dominant A/B versus C isoforms after NKp30 engagement (). It may be due to the saturated amounts of anti-NKp30 Ab antibodies used ex vivo in the cross-linking assays constrating with the expected low densities of NKp30 ligands expressed in the TME.
The prevailing conundrum is that TNFα augments cytokine-induced NK cell IFNγ production through TNFR2Citation46 which is supported by the decreased activation of NK cells observed in patients exposed to anti-TNF Abs.Citation47 This TNFα-induced NK cell activation can culminate in apoptotic NK cell death as reported in pioneering reports exposing NK cells to IL-2/IL-12.Citation48 However, in the setting of chronic inflammation such as Crohn disease,Citation49 or HCV –induced liver fibrosis, a high TNFα production by activated NK cells or innate lymphoid cells contrasted with low IFNγ release and was associated with tissue destruction. Hence, TNFα production by NKp44+ liver NK cells in HCV induced-hepatitis markedly correlated with fibrosis activity and viral load.Citation50 This NKp44/NKp44L-mediated, TNFα-dependent profibrotic phenotype contrasted with the NKG2D-mediated, IFNγ/TRAIL-dependent antifibrotic activity of NKp46high NK cells described during chronic HCV infection.Citation51,Citation52 So, it is conceivable that NK cell TNFα production may participate in chronic inflammation during oncogenetic processes, such as those described in GIST.
Moreover, recent findings from Smyth's group indicated that TGFβ favors the dedifferentiation of conventional effector NK cells into TNFα producing ILC-1 which display an immature phenotype associated with a poor tumoricidal activity (Gao Y, Smyth MJ, Nat Immunol, in press).
Lastly, the reduced surface expression of NKp46 expression resulting from direct or indirect exposure to TNFα could also mitigate NK cell effector functions. The NKp46 receptor was demonstrated to be essential for the in vitro functionality of NK cellsCitation53 and, consequently, was suggested to be crucial to the in vivo immunity conferred by NK cells against tumors and viruses.Citation35,Citation54 The level of NKp46 expressed on the NK cell surface is associated with the magnitude of the response elicited upon ligation.Citation53 Most of the receptor downregulation has been associated with the NKp46 engagement by NKp46 ligands expressed on tumor cells or virus- infected targets.Citation35,Citation55 Additionally, decreased NKp46 expression independent of NKp46 engagement have been described in the setting of HIV infection and CD16 triggering in a process involving metalloproteinase activation,Citation56 also culminating into impaired NK cell functions.
While high dosing of local TNFα can promote necrosis, chronic exposure to low dosing could blunt the innate arm of anticancer immune responses and favor fibrosis. While anti-TNFα antibodies were associated with occurrence of cancers (melanoma or lymphomaCitation57), the results of meta-analyses were never clear, maybe in relation with the complexity of the TNFR2/TRAF1 signaling pathways. We can postulate that genomic differences in this pathway may also explain the variegated functional outcome observed post-TNFα stimulation or TNFR2 blockade. Recent genome-wide association studies disclosed that several single nucleotide polymorphisms (SNPs), including tumor necrosis factor (TNF) alpha -308G/A polymorphismCitation58 and TNF receptor-associated factor 1 (TRAF1) (+16860A/G), are associated with the pathophysiology of rheumatoid arthritis (RA) or non-hodgkin lymphoma.Citation59–61 Recently, Abdul-Sater et al. unveiled an unexpected role for TRAF1 in negatively regulating Toll-like receptor signaling, providing a mechanistic explanation for the increased inflammation seen with a disease-associated TRAF1 SNP. The TRAF1 MATH domain binds directly to three components of the linear ubiquitination (LUBAC) complex, SHARPIN, HOIP and HOIL-1, to interfere with the recruitment and linear ubiquitination of NEMO in monocytes. This results in decreased NF-κB activation and cytokine production, independently of TNFα.Citation62 Hence, Traf1−/− mice show increased susceptibility to LPS-induced septic shock. The decreased TRAF1 protein in subjects with the RA-associated SNP (GG) in the 5′ intron is explained by decreased pre-mRNA levels of the G allele compared to the A allele. Monocytes and T cells from healthy human subjects harboring an RA-associated SNP in TRAF1 express less TRAF1 pre-mRNA and protein following activation. Regardless of this effect on monocytes which was TLR4-dependent but TNFα-independent, TRAF1 genotyping was assessed as a potential genetic predictor of the response to anti-TNF Abs in Japanese RA patients. TRAF1 (+16860A/G) SNP and more specifically the risk allele GG of rs3761847 (found in 25% of Caucasians) appeared to be a good predictor of resistance to TNFα blockers in RA patients.Citation63
In conclusion, this manuscript highlights for the first time the immunosuppressive functions of TNFα-mediated signaling in NK cells in tumor beds, maintained as an autocrine loop in NKp30C profiled individuals, culminating in chronic TNFα release, NKp46 downmodulation and perhaps, dedifferentiation in ILC1 cells. This work also highlights the potential relevance of TRAF1 proteins, not only in T cell and monocyte biology but also in NK cell functions. The genetic patterns of TRAF1 deserve to be studied prospectively to better evaluate the potential of TNFα blockade in restoring cancer immunosurveillance.
Material and methods
Patients and specimens
GIST samples were provided by Gustave Roussy Cancer Campus (Villejuif, France), European Hospital Georges Pompidou (Paris, France) and Hospital Jean Minjoz (Besançon, France). Patients’ characteristics are depicted in Suppl. Table 1. The study was approved by the local ethical committee (2007-A00923-50) and informed written consent was obtained from patients. Blood samples of melanoma patients were collected during the MAGE3-protein vaccination trial. The details about patient characteristics, protocol description, and survival have been previously reported by Kruit and colleagues.Citation64 PBMCs of healthy volunteer (HV) were obtained from buffy coat provided by the Etablissement Français du Sang (EFS, Créteil, France).
NK cell lines
Human NK leukaemia cell line NKL was a gift of Pr I. Cremer (Centre de Recherche des Cordeliers, Paris, France). NK92 cell line was obtained from ATCC. YTS was kindly provided by Dr A. Caignard (Institut Universitaire d'Hématologie, Paris, France) and MEC04 was a gift from Dr P. Coppo (Hôpital Saint-Antoine, Paris, France).
Tumor infiltrated lymphocyte (TIL) preparations
Resected GIST specimens were dissociated with the gentle MACs Dissociator protocol (Miltenyi Biotec) as previously described.Citation26 Briefly, tissue samples were cut and placed in dissociation medium, which consisted of RPMI1640 (GIBCO, Invitrogen), 1% penicillin/streptomycin, collagenase IV (100 IU/mL), hyaluronidase (280 IU/mL), and DNAse I (30 IU/mL) (all from Sigma-Aldrich), and run on a gentle MACS Dissociator (Miltenyi Biotec). The tumor cell suspension was filtered through a 70 μm cell strainer (BD Biosciences), centrifuged for 5 minutes at 1500 rpm and TILS was estimated in Malassez cell by Hayem Blue staining.
Flow cytometry analyses and NK cell isolation
GIST tumor cell suspensions were stained with conjugated antibodies CD45-APC-750 (clone J33), CD56-PC7 (clone N901, both from Beckman Coulter), CD3-VB (clone BW264/56, Miltenyi Biotec), and the dead cell exclusion 7-AAD (BD Pharmingen) for 20 minutes at 4 °C, then washed with PBS. Next, NK cells defined as CD45−CD3−CD56bright were sorted by a FACS ARIA III (BD Biosciences). PBMC were stained with the same CD56-PC7 and CD3-VB, NKp46-APC (clone 9E2, Miltenyi) or the corresponding isotype control mouse IgG1 (clone IS5-21F5, Miltenyi Biotec). Cells were then washed, fixed, and acquired by flow cytometry using a Cyan ADP9, (Beckman Coulter Inc.) within 24 h. Data were analyzed with Kaluza software (Beckman Coulter Inc.).
PBMC of Healthy Volunteer (HV) were obtained from buffy coat provided by the Etablissement Français du Sang (EFS, Créteil, France) using lymphocytes separation medium (Eurobio, AbCys), washed three times in PBS 1X. NK cells were then isolated using magnetic negative selection kits following the manufacturer's instructions (EasySep, Stemcell Technologies).
NK cells from mice were obtained after sampling of the spleen which was crushed on the 100 µm cell strainer, red blood cells were eliminated using ACK solution (Ammonium-Chlorure-Potassium) and NK cells were then negatively selected using magnetic separation kit according to the manufacturer's instructions (mouse NK Cell isolation kit, Miltenyi Biotec).
Microarray analysis
250 ng of cDNAs of CD3−CD56bright NK cells from each GIST patient were used as template for Cy3 labeling which was performed according to Miltenyi Biotec's undisclosed protocol. The Cy3- labeled cDNAs were hybridized overnight (17 h, 65 °C) to an Agilent Whole Human Genome Oligo Microarrays 8 × 60 K V2 using Agilent's recommended hybridization chamber and oven. Fluorescence signals of the hybridized Agilent Microarrays were detected using Agilent's Microarray Scanner System (Agilent Technologies). The Agilent Feature Extraction Software (FES) was used to read out and process the microarray image files. Expression is normalized by row (reduced and centered). Genes are selected according to overexpression (p-value and Fold-Change of differential tests according to different annotation, computed from “ebayes” function applied to “lmFit” of limma package.Citation65
In vitro stimulation
NK cells were seeded in 96-well plates at 1 × 10⁵ cells/well in 200 µL of complete RPMI1640 (GIBCO Invitrogen) +10% human AB serum (Institut de biotechnologies Jacques Boy). For NKp30 cross-linking, flat bottom plates (Maxisorp, Nunc) were pre-coated with 2.5 µg/mL of either anti-human NKp30 antibody (Clone 210847, R&D Systems) or the corresponding IgG2A isotype control (Clone 20102, R&D Systems) in 50 µL of Dulbecco's phosphate-buffered saline (PBS, GIBCO Invitrogen). For TNFα (Miltenyi Biotec) and TGFβ (R&D Systems) stimulation, NK cells were seeded in 96-round bottom plates and cytokines were added in the medium at indicated concentration. Blocking of the TNFR2 was obtained using the anti-human TNFR2 antibody (Clone 22210, R&D Systems) or the corresponding IgG1 isotype control (Clone 11711, R&D Systems). Fas agonist antibody (Clone UT-1) and its mouse isotype control IgM (Clone PFR-03) were obtained from Invitrogen. 4-1BB agonist antibody was kindly provided by Pr. Byoung S. Kwon (Tulane University Health Sciences Center, LA, USA) and its isotype control IgG1 was obtained from R&D Systems. For RNA analysis, cells were harvested 12 h after stimulation, washed with PBS and re-suspended in RLT buffer containing β-2 mercaptoethanol (Quiagen) to preserve the RNA quality and stored at
-80 °C. For cytometry analysis, cells were harvested after 48 h of stimulation, washed with PBS 1X and stained as described above. Cytokines were measured from 24 h in vitro culture supernatants by ELISA kit according to the manufacturers’ instructions: TNFα (BD OptEIA 555212, BD Biosciences), IFNγ (ELISA MAX 430103, Biolegend), TGFβ1 (BD OptEIA, 559119, BD Biosciences).
Quantitative reverse-transcription PCR (qRT-PCR)
Total cellular RNA was isolated from samples with the RNeasy kit (Qiagen) following the manufacturer's recommendations. For NKp30 detection, first strand cDNA was synthesized from 1 µg of total RNA using SuperScript™ III Reverse Transcriptase (Invitrogen) and random primers (Promega) according to the manufacturer's recommendations. For qRT-PCR, 5 μL of first-strand cDNA was mixed with 12.5 μL of TaqMan Gene Expression Master Mix (2X) (Applied Biosystems). For NKp30 isoforms (A, B, and C): 0.75 μL primers (10 μM) and probe (5 μM); and for the β-2-microglobulin housekeeping gene (β2M): 0.5 μL of primers (10 μM) and probe (5 μM), were used in a final volume of 25 μL. The PCR conditions were as follows: initial incubation at 50 °C for 2 min, denaturation at 95 °C for 10 min, followed by 45 cycles at 95 °C for 15 sec, and 60 °C for 1 min. Costumed PCR primers and TaqMan probes are listed in Suppl. Table 2 (Sigma-Aldrich). For all the other genes, a 1-step RT qPCR was performed (TaqMan® RNA-to-Ct™ 1-Step Kit, Applied Biosystems) using 1 µg of RNA with 1 µL of Taqman RT-Enzyme Mix 40X (Applied Biosystems), 20 µL of Taqman RT-PCR Mix (2X) (Applied Biosystems) and 2 µL of Taqman Gene Expression Assay (20X) for a final volume of 40 µL. The 1-step RT-qPCR conditions were as follows: initial incubation at 48 °C for 15 min, enzyme activation at 95 °C for 10 min followed by 45 cycles at 95 °C for 15 sec and 60 °C for 1 min. A StepOnePlus System (Applied Biosystems) was used for temperature cycling and real time fluorescence measurement. PCR primers were obtained from Applied Biosystems and are listed in Suppl. Table 2. The relative expression of the gene of interest was calculated with the 2−ΔCt methodCitation66 normalized to the expression level of β2M, with the following formula: 2−ΔCt = (2−(Ct (gene of interest) – Ct (housekeeping gene))) × 106. The level of expression of the distinct NKp30 isoforms compared with each other (delta, Δ) was determined using the following formula: NKp30x NKp30y = CtNKp30y – CtNKp30x, with Ct = Cycle threshold. The median of each NKp30 isoform pair delta (Δ) was used for the survival curve analysis.
Mice experiments
Female C57Bl/6 mice were obtained from Harlan (France). C57Bl/6 TNFR2 KO mice (ref: Jax 2620: Tnfrsf1btm1Mwm/J) were obtained from Jackson Laboratory. All animals were maintained in Gustave Roussy Cancer Campus (Villejuif, France) animal facilities according to the Animal Experimental Ethics Committee Guidelines. B16F10 lung metastases. B16F10 tumor cells were obtained from MT Lotze's laboratory. Briefly, 100 µL of B16F10 cells were injected intravenously at a concentration of 2 × 10⁶ cells/mL in PBS. Treatment of the mice began the next day with intraperitoneal injection of either PBS (100 µL) every day, 100 µL of mouse recombinant TNFα (Miltenyi Biotec) at 10 µg/mL every day or 100 µL of Etanercept (Pfizer) at 5 mg/mL three times per week. Mice were sacrificed 3 weeks after tumor cells injection and the lungs were sampled. Lungs were dehydrated and fixed by immersing them in paraformaldehyde 4% for 24 h. Lungs were then kept in ethanol 100% until the metastases were counted using a binocular magnifier. RMA/S. Female C57Bl/6 mice obtained from Harlan (France) were injected subcutaneously in the right flank with 2 × 10⁶ cells in 100 µL of PBS 1X. Three days after injection, mice were treated with intra-peritoneal injections of either PBS every day, 100 µL of mouse recombinant TNFα at 10 µg/mL every day, 100 µL of anti-mouse TNFR2 (Clone TR75-54.7) or isotype control hamster IgG (both from BioXCell) at 5 mg/mL for 3 weeks. Seven days after injection, tumor growth was measured every 2 days using calipers.
Apoptosis assays
For Annexin V/DAPI staining, cells were incubated for 15 min in dark at room temperature with Annexin V APC (BD Pharmingen), wash with Annexin V buffer and stained with DAPI (BD Pharmingen) 5 min at RT before FACS acquisition.
Statistical analysis
Results are expressed as Mean ± SEM. Data were analyzed with Prism 5 software (GraphPad, San Diego, CA, USA). The paired t-test, unpaired t-test and the non-parametric Wilcoxon matched pairs test were used for comparison of the different groups as indicated in the Figure Legends. Two-way ANOVA test was used for tumor growth analysis. Spearman test was used for correlations analysis. p-values <0.05 were considered as significant.
Conflicts of interests
LZ is on the administrative board of Transgene and GK and LZ are co-founders of EverImmune.
supp_data.zip
Download Zip (2.5 MB)Acknowledgments
GK and LZ were supported by the Ligue Nationale contre le Cancer (Equipes labellisées), Agence Nationale pour la Recherche (ANR AUTOPH, ANR Emergence), European Commission (ArtForce), European Research Council Advanced Investigator Grant (to GK), Fondation pour la Recherche Médicale (FRM), Institut National du Cancer (INCa), Fondation de France, Cancéropôle Ile-de-France, Fondation Bettencourt-Schueller, Swiss Bridge Foundation, the LabEx Immuno-Oncology, the SIRIC Stratified Oncology Cell DNA Repair and Tumor Immune Elimination (SOCRATE); the SIRIC Cancer Research and Personalized Medicine (CARPEM), and the Paris Alliance of Cancer Research Institutes (PACRI). LZ, GK are all sponsored by Association pour la Recherche contre le Cancer (PGA120140200851) and ISREC Foundation. MJS was supported by a National Health and Medical Research Council of Australia Research Fellowship (1078671).
References
- Pardoll D. Cancer and the immune system: Basic concepts and targets for intervention. Semin. Oncol. 2015;42(4):523–538. doi:10.1053/j.seminoncol.2015.05.003. PMID:26320058.
- Robert C, Schachter J, Long GV, Arance A, Grob JJ, Mortier L, Daud A, Carlino MS, McNeil C, Lotem M, et al. Pembrolizumab versus ipilimumab in advanced melanoma. N. Engl. J. Med. 2015;372(26):2521–2532. doi:10.1056/NEJMoa1503093. PMID:25891173.
- Robert C, Long GV, Brady B, Dutriaux C, Maio M, Mortier L, Hassel JC, Rutkowski P, McNeil C, Kalinka-Warzocha E, et al. Nivolumab in previously untreated melanoma without BRAF mutation. N. Engl. J. Med. 2015;372(4):320–330. doi:10.1056/NEJMoa1412082. PMID:25399552.
- Topalian SL, Drake CG, Pardoll DM. Immune checkpoint blockade: A common denominator approach to cancer therapy. Cancer Cell. 2015;27(4):451–461. doi:10.1016/j.ccell.2015.03.001.
- VivierE, Tomasello E, Baratin M, Walzer T, Ugolini S. Functions of natural killer cells. Nat. Immunol. 2008;9(5):503–510. doi:10.1038/ni1582. PMID:18425107.
- Raulet DH, Vance RE. Self-tolerance of natural killer cells. Nat Rev Immunol. 2006;6(7):520–531. doi:10.1038/nri1863. PMID:16799471.
- Guillerey C, Huntington ND, Smyth MJ. Targeting natural killer cells in cancer immunotherapy. Nat. Immunol. 2016;17(9):1025–1036. doi:10.1038/ni.3518. PMID:27540992.
- Stojanovic A, Fiegler N, Brunner-Weinzierl M, Cerwenka A. CTLA-4 is expressed by activated mouse NK cells and inhibits NK cell IFN-γ production in response to mature dendritic cells. J. Immunol. 2014;192(9):4184–4191. doi:10.4049/jimmunol.1302091. PMID:24688023.
- Huang BY, Zhan YP, Zong WJ, Yu CJ, Li JF, Qu YM, Han S. The PD-1/B7-H1 pathway modulates the natural killer cells versus mouse glioma stem cells. PLoS One. 2015;10(8):1–14. doi:10.1371/journal.pone.0134715.
- Westin JR, Chu F, Zhang M, Fayad LE, Kwak LW, Fowler N, Romaguera J, Hagemeister F, Fanale M, Samaniego F, et al. Safety and activity of PD1 blockade by pidilizumab in combination with rituximab in patients with relapsed follicular lymphoma: A single group, open-label, phase 2 trial. Lancet Oncol. 2014;15(1):69–77. doi:10.1016/S1470-2045(13)70551-5. PMID:24332512.
- Pires da Silva I, Gallois A, Jimenez Baranda S, Khan S, Anderson AC, Kuchroo VK, Osman I, Bhardwaj N. Reversal of NK cell exhaustion in advanced melanoma by Tim-3 blockade. Cancer Immunol. Res. 2014;2(5):410–422. doi:10.1158/2326-6066.CIR-13-0171. PMID:24795354.
- Romagné F, André P, Spee P, Zahn S, Anfossi N, Gauthier L, Capanni M, Ruggeri L, Benson DM, Blaser BW, et al. Preclinical characterization of 1–7F9, a novel human anti–KIR receptor therapeutic antibody that augments natural killer–mediated killing of tumor cells. Blood. 2009;114(13):2667 LP–2677. doi:10.1182/blood-2009-02-206532.
- Benson DM, Hofmeister CC, Padmanabhan S, Suvannasankha A, Jagannath S, Abonour R, Bakan C, Andre P, Efebera Y, Tiollier J, et al. A phase 1 trial of the anti-KIR antibody IPH2101 in patients with relapsed/refractory multiple myeloma. Blood. 2012;120(22):4324 LP–4333. doi:10.1182/blood-2012-06-438028.
- Vey N, Bourhis J-H, Boissel N, Bordessoule D, Prebet T, Charbonnier A, Etienne A, Andre P, Romagne F, Benson D, et al. A phase 1 trial of the anti-inhibitory KIR mAb IPH2101 for AML in complete remission. Blood. 2012;120(22):4317 LP–4323. doi:10.1182/blood-2012-06-437558.
- Blake SJ, Stannard K, Liu J, Allen S, Yong MCR, Mittal D, Aguilera AR, Miles JJ, Lutzky VP, de Andrade LF, et al. Suppression of metastases using a new lymphocyte checkpoint target for cancer immunotherapy. Cancer Discov. 2016;6(4):446 LP–459. doi:10.1158/2159-8290.CD-15-0944.
- Stanietsky N, Simic H, Arapovic J, Toporik A, Levy O, Novik A, Levine Z, Beiman M, Dassa L, Achdout H, et al. The interaction of TIGIT with PVR and PVRL2 inhibits human NK cell cytotoxicity. Proc. Natl. Acad. Sci. 2009;106(42):17858–17863. doi:10.1073/pnas.0903474106.
- Paolino M, Choidas A, Wallner S, Pranjic B, Uribesalgo I, Loeser S, Jamieson AM, Langdon WY, Ikeda F, Fededa JP, et al. The E3 ligase Cbl-b and TAM receptors regulate cancer metastasis via natural killer cells. Nature. 2014;507(7493):508–512. doi:10.1038/nature12998. PMID:24553136.
- Putz EM, Gotthardt D, Hoermann G, Csiszar A, Wirth S, Berger A, Straka E, Rigler D, Wallner B, Jamieson AM, et al. CDK8-mediated STAT1-S727 phosphorylation restrains NK cell cytotoxicity and tumor surveillance. Cell Rep. 2013;4(3):437–444. doi:10.1016/j.celrep.2013.07.012. PMID:23933255.
- Parameswaran R, Ramakrishnan P, Moreton SA, Xia Z, Hou Y, Lee DA, Gupta K, DeLima M, Beck RC, Wald DN. Repression of GSK3 restores NK cell cytotoxicity in AML patients. Nat. Commun. 2016;7:11154. doi:10.1038/ncomms11154. PMID:27040177.
- Delconte RB, Kolesnik TB, Dagley LF, Rautela J, Shi W, Putz EM, Stannard K, Zhang J-G, Teh C, Firth M, et al. CIS is a potent checkpoint in NK cell-mediated tumor immunity. Nat Immunol 2016;17(7):816–824. doi:10.1038/ni.3470. PMID:27213690.
- Putz EM, Guillerey C, Kos K, Stannard K, Miles K, Delconte RB, Takeda K, Nicholson SE, Huntington ND, Smyth MJ. Targeting cytokine signaling checkpoint CIS activates NK cells to protect from tumor initiation and metastasis. Oncoimmunology. 2017;6(2), e1267892. doi:10.1080/2162402X.2016.1267892. PMID:28344878.
- Gillard-Bocquet M, Caer C, Cagnard N, Crozet L, Perez M, Fridman WH, Sautes-fridman C, Cremer I. Lung tumor microenvironment induces specific gene expression signature in intratumoral NK cells. Front. Immunol. 2013;4:19. doi:10.3389/fimmu.2013.00019. PMID:23382731.
- Platonova S, Cherfils-Vicini J, Damotte D, Crozet L, Vieillard V, Validire P, André P, Dieu-Nosjean M-C, Alifano M, Régnard J-F, et al. Profound coordinated alterations of intratumoral NK cell phenotype and function in lung carcinoma. Cancer Res. 2011;71(16):5412 LP–5422. doi:10.1158/0008-5472.CAN-10-4179.
- Semeraro M, Rusakiewicz S, Minard-Colin V, Delahaye NF, Enot, Vély F, Marabelle A, Papoular B, Piperoglou C, Ponzoni M, et al. Clinical impact of the NKp30/B7-H6 axis in high-risk neuroblastoma patients. Sci. Transl. Med. 2015;7(283):283ra55. doi:10.1126/scitranslmed.aaa2327. PMID:25877893.
- Rusakiewicz S, Semeraro M, Sarabi M, Desbois M, Locher C, Mendez R, Vimond N, Concha A, Garrido F, Isambert N, et al. Immune infiltrates are prognostic factors in localized gastrointestinal stromal tumors. Cancer Res. 2013;73(12):3499–3510. doi:10.1158/0008-5472.CAN-13-0371. PMID:23592754.
- Rusakiewicz S, Perier A, Semeraro M, Pitt JM, Pogge von Strandmann E, Reiners KS, Aspeslagh S, Pipéroglou C, Vély F, Ivagnes A, et al. NKp30 isoforms and NKp30 ligands are predictive biomarkers of response to imatinib mesylate in metastatic GIST patients. Oncoimmunology. 2017;6(1):e1137418. doi:10.1080/2162402X.2015.1137418. PMID:28197361.
- Delahaye NF, Rusakiewicz S, Martins I, Menard C, Roux S, Lyonnet L, Paul P, Sarabi M, Chaput N, Semeraro M, et al. Alternatively spliced NKp30 isoforms affect the prognosis of gastrointestinal stromal tumors. Nat Med. 2011;17(6):700–707. doi:10.1038/nm.2366. PMID:21552268.
- Zitvogel L, Rusakiewicz S, Routy B, Ayyoub M, Kroemer G. Immunological off-target effects of imatinib. Nat. Rev. Clin. Oncol. 2016;13(7):431–446. doi:10.1038/nrclinonc.2016.41. PMID:27030078.
- Messaoudene M, Fregni G, Fourmentraux-Neves E, Chanal J, Maubec E, Mazouz-Dorval S, Couturaud B, Girod A, Sastre-Garau X, Albert S, et al. Mature cytotoxic CD56bright/CD16+natural killer cells can infiltrate lymph nodes adjacent to metastatic melanoma. Cancer Res. 2014;74(1), 81 LP–92. doi:10.1158/0008-5472.CAN-13-1303.
- Semeraro M, Adam J, Stoll G, Louvet E, Chaba K, Poirier-Colame V, Sauvat A, Senovilla L, Vacchelli E, Bloy N, et al. The ratio of CD8+/FOXP3 T lymphocytes infiltrating breast tissues predicts the relapse of ductal carcinoma in situ. Oncoimmunology. 2016;5(10):e1218106. doi:10.1080/2162402X.2016.1218106. PMID:27853639.
- Fend L, Rusakiewicz S, Adam J, Bastien B, Caignard A, Messaoudene M, Iribarren C, Cremer I, Marabelle A, Borg C, et al. Prognostic impact of the expression of NCR1 and NCR3 NK cell receptors and PD-L1 on advanced non-small cell lung cancer. Oncoimmunology. 2017;6(1):e1163456. doi:10.1080/2162402X.2016.1163456. PMID:28197362.
- Mahoney DJ, Cheung HH, Mrad RL, Plenchette S, Simard C, Enwere E, Arora V, Mak TW, Lacasse EC, Waring J, et al. Both cIAP1 and cIAP2 regulate TNFalpha-mediated NF-kappaB activation. Proc. Natl. Acad. Sci. USA 2008;105(33):11778–11783. doi:10.1073/pnas.0711122105.
- Vince JE, Pantaki D, Feltham R, Mace PD, Cordier SM, Schmukle AC, Davidson AJ, Callus BA, Wong WWL, Gentle IE, et al. TRAF2 must bind to cellular inhibitors of apoptosis for tumor necrosis factor (TNF) to efficiently activate NF-?B and to prevent TNF-induced apoptosis. J. Biol. Chem. 2009;284(51):35906–35915. doi:10.1074/jbc.M109.072256. PMID:19815541.
- Taïeb J, Maruyama K, Borg C, Terme M, Zitvogel L. Imatinib mesylate impairs Flt3L-mediated dendritic cell expansion and antitumor effects in vivo. Blood. 2004;103(5):1966 LP–1967. doi:10.1182/blood-2003-10-3475.
- Glasner A, Ghadially H, Gur C, Stanietsky N, Tsukerman P, Enk J, Mandelboim O. Recognition and prevention of tumor metastasis by the NK receptor NKp46/NCR1. J. Immunol. 2012;188(6):2509–2515. doi:10.4049/jimmunol.1102461. PMID:22308311.
- Rothe M, Wong SC, Henzel WJ, Goeddel DV. A novel family of putative signal transducers associated with the cytoplasmic domain of the 75 kDa tumor necrosis factor receptor. Cell. 1994;78(4):681–692. doi:10.1016/0092-8674(94)90532-0. PMID:8069916.
- Zapata JM, Reed JC. TRAF1: Lord without a RING. Sci. Signal. 2002;2002(133):pe27–pe27. doi:10.1126/stke.2002.133.pe27.
- Leo E, Deveraux QL, Buchholtz C, Welsh K, Matsuzawa SI, Stennicke HR, Salvesen GS, Reed JC. TRAF1 Is a substrate of caspases activated during tumor necrosis factor receptor-α-induced apoptosis. J. Biol. Chem. 2001;276(11):8087–8093. doi:10.1074/jbc.M009450200. PMID:11098060.
- Jang HD, Chung YM, Baik JH, Choi YG, Park I-S, Jung YK, Lee SY. Caspase-cleaved TRAF1 negatively regulates the antiapoptotic signals of TRAF2 during TNF-induced cell death. Biochem. Biophys. Res. Commun. 2001;281(2):499–505. doi:10.1006/bbrc.2001.4369. PMID:11181075.
- Speiser DE, Lee SY, Wong B, Arron J, Santana A, Kong Y-Y, Ohashi PS, Choi Y. A regulatory role for TRAF1 in Antigen-induced apoptosis of T cells. J. Exp. Med. 1997;185(10):1777 LP–1783. doi:10.1084/jem.185.10.1777.
- Duckett CS, Gedrich RW, Gilfillan MC, Thompson CB, Duckett CS, Gedrich RW, Gilfillan MC. Induction of nuclear factor kappaB by the CD30 receptor is mediated by TRAF1 and TRAF2. Mol Cell Biol 1997;17(3):1535–1542. doi:10.1128/MCB.17.3.1535. PMID:9032281.
- Tsitsikov EN, Laouini D, Dunn IF, Sannikova TY, Davidson L, Alt FW, Geha RS. TRAF1 is a negative regulator of TNF signaling: Enhanced TNF signaling in TRAF1-deficient mice. Immunity. 2001;15(4):647–657. doi:10.1016/S1074-7613(01)00207-2. PMID:11672546.
- Carpentier I, Beyaert R. TRAF1 is a TNF inducible regulator of NF-κB activation. FEBS Lett. 1999;460(2):246–250. doi:10.1016/S0014-5793(99)01356-3. PMID:10544244.
- Pandey R, DeStephan CM, Madge LA, May MJ, Orange JS. NKp30 ligation induces rapid activation of the canonical NF-κB pathway in NK cells. J. Immunol. 2007;179(11):7385–7396. doi:10.4049/jimmunol.179.11.7385. PMID:18025182.
- Hu W-T, Huang L-L, Li M-Q, Jin L-P, Li D-J, Zhu X-Y. Decidual stromal cell-derived IL-33 contributes to Th2 bias and inhibits decidual NK cell cytotoxicity through NF-κB signaling in human early pregnancy. J. Reprod. Immunol. 2015;109:52–65. doi:10.1016/j.jri.2015.01.004. PMID:25712540.
- Almishri W, Santodomingo-Garzon T, Le T, Stack D, Mody CH, Swain MG. TNFα augments cytokine-induced NK Cell IFNγ production through TNFR2. J. Innate Immun. 2016;8(6):617–629. doi:10.1159/000448077. PMID:27560480.
- Nocturne G, Boudaoud S, Ly B, Pascaud J, Paoletti A, Mariette X. Impact of anti-TNF therapy on NK cells function and on immunosurveillance against B-cell lymphomas. J. Autoimmun. 2017;80:56–64. doi:10.1016/j.jaut.2017.02.001. PMID:28214146.
- Ross ME, Caligiuri MA. Cytokine-induced apoptosis of human natural killer cells identifies a novel mechanism to regulate the innate immune response. Blood. 1997;89(3):910 LP–918.
- Takayama T, Kamada N, Chinen H, Okamoto S, Kitazume MT, Chang J, Matuzaki Y, Suzuki S, Sugita A, Koganei K, et al. Imbalance of NKp44+NKp46− and NKp44−NKp46+ natural killer cells in the intestinal mucosa of patients with crohn's disease. Gastroenterology. 2010;139(3):882–892.e3. doi:10.1053/j.gastro.2010.05.040. PMID:20638936.
- Nel I, Lucar O, Petitdemange C, Béziat V, Lapalus M, Bédossa P, Debré P, Asselah T, Marcellin P, Vieillard V. Accumulation of intrahepatic TNF-α-producing NKp44+ NK cells correlates with liver fibrosis and viral load in chronic HCV infection. Medicine (Baltimore). 2016;95(19), e3678. doi:10.1097/MD.0000000000003678. PMID:27175704.
- Pembroke T, Christian A, Jones E, Hills RK, Wang ECY, Gallimore AM, Godkin A. The paradox of NKp46+ natural killer cells: Drivers of severe hepatitis C virus-induced pathology but in-vivo resistance to interferon α treatment. Gut. 2014;63(3):515–524. doi:10.1136/gutjnl-2013-304472. PMID:23665989.
- Radaeva S, Sun R, Jaruga B, Nguyen VT, Tian Z, Gao B. Natural killer cells ameliorate liver fibrosis by killing activated stellate cells in NKG2D-dependent and tumor necrosis factor–related apoptosis-inducing ligand–dependent manners. Gastroenterology. 2006;130(2):435–452. doi:10.1053/j.gastro.2005.10.055. PMID:16472598.
- De Maria A, Fogli M, Costa P, Murdaca G, Puppo F, Mavilio D, Moretta A, Moretta L. The impaired NK cell cytolytic function in viremic HIV-1 infection is associated with a reduced surface expression of natural cytotoxicity receptors (NKp46, NKp30 and NKp44). Eur. J. Immunol. 2003;33(9):2410–2418. doi:10.1002/eji.200324141. PMID:12938217.
- Gazit R, Gruda R, Elboim M, Arnon TI, Katz G, Achdout H, Hanna J, Qimron U, Landau G, Greenbaum E, et al. Lethal influenza infection in the absence of the natural killer cell receptor gene Ncr1. Nat. Immunol. 2006;7(5):517–523. doi:10.1038/ni1322. PMID:16565719.
- Alvarez-Breckenridge CA, Yu J, Price R, Wojton J, Pradarelli J, Mao H, Wei M, Wang Y, He S, Hardcastle J, et al. NK cells impede glioblastoma virotherapy through NKp30 and NKp46 natural cytotoxicity receptors. Nat Med. 2012;18(12):1827–1834. doi:10.1038/nm.3013. PMID:23178246.
- Parsons M. S, Tang C-C, Jegaskanda S, Center RJ, Brooks AG, Stratov I, Kent SJ. Anti-HIV antibody–dependent activation of NK cells impairs NKp46 expression. J. Immunol. 2013;192(1):308 LP–315.
- Mercer LK, Askling J, Raaschou P, Dixon WG, Dreyer L, Hetland ML, Strangfeld A, Zink A, Mariette X, Finckh A, et al. Risk of invasive melanoma in patients with rheumatoid arthritis treated with biologics: results from a collaborative project of 11 European biologic registers. Ann. Rheum. Dis. 2017;76(2), 386 LP–391. doi:10.1136/annrheumdis-2016-209285.
- O'Rielly DD, Roslin NM, Beyene J, Pope A, Rahman P. TNF-α -308 G/A polymorphism and responsiveness to TNF-α blockade therapy in moderate to severe rheumatoid arthritis: A systematic review and meta-analysis. Pharmacogenomics J. 2009;9(3):161–167. doi:10.1038/tpj.2009.7. PMID:19365401.
- Zhu J, Zhang D, Wu F, He F, Liu X, Wu L, Zhou B, Liu J, Lu F, Liu J, et al. Single nucleotide polymorphisms at the TRAF1/C5 locus are associated with rheumatoid arthritis in a Han Chinese population. BMC Med. Genet. 2011;12(1):53. doi:10.1186/1471-2350-12-53. PMID:21492465.
- Han TU, Bang SY, Kang C, Bae SC. Traf1 polymorphisms associated with rheumatoid arthritis susceptibility in asians and in caucasians. Arthritis Rheum. 2009;60(9):2577–2584. doi:10.1002/art.24759. PMID:19714643.
- Cerhan JR, Ansell SM, Fredericksen ZS, Kay NE, Liebow M, Call TG, Dogan A, Cunningham JM, Wang AH, Liu-Mares W, et al. Genetic variation in 1253 immune and inflammation genes and risk of non-Hodgkin lymphoma. Blood. 2007;110(13):4455 LP–4463. doi:10.1182/blood-2007-05-088682.
- Abdul-Sater AA, Edilova MI, Clouthier DL, Mbanwi A, Kremmer E, Watts TH. The signaling adaptor TRAF1 negatively regulates Toll-like receptor signaling and this underlies its role in rheumatic disease. Nat Immunol. 2017;18(1):26–35. doi:10.1038/ni.3618. PMID:27893701.
- Nishimoto T, Seta N, Anan R, Yamamoto T, Kaneko Y, Takeuchi T, Kuwana M. A single nucleotide polymorphism of TRAF1 predicts the clinical response to anti-TNF treatment in Japanese patients with rheumatoid arthritis. Clin. Exp. Rheumatol. 2013;32(2):211–217. PMID:24321457.
- Kruit WHJ, van Ojik HH, Brichard VG, Escudier B, Dorval T, Dréno B, Patel P, van Baren N, Avril M-F, Piperno S, et al. Phase 1/2 study of subcutaneous and intradermal immunization with a recombinant MAGE-3 protein in patients with detectable metastatic melanoma. Int. J. Cancer. 2005;117(4):596–604. doi:10.1002/ijc.21264. PMID:15945101.
- Ritchie ME, Phipson B, Wu D, Hu Y, Law CW, Shi W, Smyth GK. Limma powers differential expression analyses for RNA-sequencing and microarray studies. Nucleic Acids Res. 2015;43(7):e47. doi:10.1093/nar/gkv007. PMID:25605792.
- Livak KJ, Schmittgen TD. Analysis of relative gene expression data using real-time quantitative PCR and the 2−ΔΔCT method. Methods. 2001;25(4):402–408. doi:10.1006/meth.2001.1262. PMID:11846609.