
ABSTRACT
Immunotherapy is effective in metastatic melanoma (MM) but most studies failed in discovering a biomarker predictive of clinical response. Exosomes (Exo) from melanoma cells are detectable in sera of MM patients similarly to those produced by immune cells that control the tumor progression. Here, we investigated by flow-cytometry the levels of Exo from both T-cells and dendritic cells (DCs) in 59 patients with MM treated with IPI and the relative expression of PD-1, CD28 and ICOS as well as CD80 and CD86. We found a significant increment of PD-1 and CD28 expression in patients achieving a clinical response reflected by improvement of both PFS and OS. Furthermore, MM patients receiving IPI who showed extended PFS underwent increased expression of CD80 and CD86 on DC-derived Exo at the end of treatment. These results suggest a possible association of both PD-1 and CD28 up-regulation on immune cell-derived Exo in patients with better clinical response to IPI.
Introduction
The modulation of the immune system by targeting inhibitory and stimulatory checkpoints of T-cell response is a functional approach that has definitely improved the survival in metastatic melanoma (MM). A relevant therapeutic breakthrough was the development of ipilimumab (IPI), namely the first drug producing durable response and extended overall survival (OS) in approximately 25% of MM patients.Citation1,2 Notwithstanding the long-term efficacy of IPI, there is modest evidence for a preliminary selection of responders exclusively based on immunological parameters. In this context, several studies investigated the expression by T-cells of ICOS (inducible co-stimulatory molecule) whose levels, however, poorly reflect the responsiveness to IPI.Citation3 By contrast, ICOS results progressively up-regulated by both CD4+ and CD8+ cells of patients achieving a definite clinical response, thus supporting its potential prognostic role. Other possibly predictive markers include the receptor of the interleukin-2, namely CD25, whose serum levels correlate with a clinical benefit, whereas a definite significance has been attributed to lactate dehydrogenase (LDH) serum elevations,Citation4 absolute leukocyte count (ALC) and neutrophil/lymphocyte (N/L) ratio, as well as to the over-expression of NY-ESO1 by T-cells, a cancer testis antigen.Citation5–9
An option for exploring the behaviour of melanoma and immune cells includes the investigation of exosomes (Exo), namely extracellular vesicles containing surface receptors, proteins, enzymes, RNAs and DNAs deriving from relative original cells.Citation10,11 Exo stem from the endosomal compartment of the cell membrane and express typical surface markers as long as they are packaged and released into the peripheral blood. Exo may drive relevant features associated with cancer progression as proliferation, angiogenesis and escape from the immune surveillance.Citation12 Moreover, Exo from melanoma cells also activate the epithelial-to-mesenchymal transition and promote the formation of the pre-metastatic niche throughout intracellular signals mostly transduced by a number of integrins.Citation13,14
Based on their antigenic, biological and molecular properties, tumor-derived Exo have been postulated as predictive and prognostic biomarkers or for monitoring the results of treatments in cancer. To this regard, CD63+/Cav-1+ Exo have been abundantly found in sera of melanoma patients and their amounts correlate with clinical progression.Citation15,16 To remark their role in other cancers, PCA3 expressing Exo from both serum and urine of patients with prostate cancer, namely prostasomes, have been reported as carriers of molecular information useful for diagnosis and follow-up as well as for evaluating the efficacy of therapy.Citation17 In addition, the overexpression of CD24 by serum Exo in ovarian cancer patients reflects the worsened clinical progression in a fashion similar to patients with glioblastoma.Citation18,19 Besides the diagnostic and prognostic relevance of Exo, these nanovesicles would also exert a therapeutic potential since dendritic cell (DC)-derived Exo (D-Exo) are able to prime specific cytotoxic T-cells to restrain the growth of murine tumors in vivo,Citation20 while those expressing high levels of toll-like receptor (TLR)-3 and TLR-9 have been successfully used in vaccination trials in MM.Citation21,22
Herein, we retrospectively investigated the levels of PD-1, CD28 and ICOS immune checkpoints expressed by T-cell-derived Exo (T-Exo) with the purpose to explore a potential correlation with clinical response in patients treated with IPI.
Methods
Patients and biological samples
Sixty-three untreated patients (≥18 years) with unresectable or cutaneous (n = 60), mucosal (n = 2) and uveal (n = 1) melanoma were enrolled independently from the number and site of distant metastases at the Medical Oncology Unit of the University of Bari ‘Aldo Moro’ and Melanoma, Cancer Immunotherapy and Innovative Therapy Unit of ‘G. Pascale Tumor National Institute’ of Naples to receive four courses of IPI (3 mg/kg) every 3 weeks. The patients provided their informed consent to the study that was approved by the ethic committees of both institutions. Sera were collected at baseline and before each IPI infusion. Patients were separated in responders (Group A) and non-responders (Group B) in relation to the immune related response criteria (irRC) evaluated within two months after the end of treatment and four of them (1 cutaneous, 2 mucosal and 1 uveal), were dropped out for the occurrence of early clinical progression or grade 3–4 adverse events.
Phenotypic characterization of T-cells and DCs
Peripheral blood mononuclear cells (PBMC) from 10 selected patients were isolated by Ficoll-Paque sedimentation and phenotype patterns of both T-cells and mature DCs were explored by flow-cytometry (FACSanto, Becton Dickinson, CA) using mouse anti-human monoclonal antibodies (MoAbs) before ipilimumab treatment. Briefly, anti-CD3, -CD4 and -CD8 reagents (Biolegend, San Diego, USA) were used to characterize T-cells, whereas mature DCs were typed by the expression of CD11c/CD8/CD86 (BioLegend), as previously reported.Citation23,24
Exosome isolation and characterization
Exo were collected from sera of MM patients before each infusion of IPI and then two months after the completion of the immunotherapy program by the Total Exosome Isolation kit (Invitrogen, Carlsbad, CA) accordingly to the manufacturers’ instructions and their amounts were measured by the Bradford method (Biorad, Hercules, CA). Before Exo isolation, sera were passed onto 0.22 μm filter to remove apoptotic particles and low soluble aggregates as well as membrane fractions. Thus, further experiments were devoted to verify the Exo enrichment in purified samples. Briefly, 5 μg of Exo were first conjugated to aldehyd/sulfate latex beads of 4 μm of diameter (Invitrogen, Carlsbad, CA) and incubated for 5 hours at room temperature until the coupling reaction was stopped by 100 nM glycine before the final centrifugation to pellet the Exo-coated beads.Citation25 Based on the typical expression of CD9, CD63 and CD81 molecules on Exo,Citation25,26 the samples were evaluated by flow-cytometry using relative mouse anti-human MoAbs (eBioscence, San Diego, CA), after blocking with 10% bovin serum albumin (BSA) to avoid aspecific binding, and the following experiments were addressed to evaluate the potential contamination by lipoparticles and microvesicles in our system.Citation27 To this, we used Ultraflex Extreme MALDI-TOF mass spectrometer (Bruker Daltonics, Bremen, Germany) and data were analysed by dedicated software (ClinPro Tools 3.0) with respect to specific lipid database (Lipid Maps Database). In addition, the transmission electron microscopy (TEM, JEOL-JEM 1011, Japan) was adopted to define both morphology and size of the isolated vesicles. Briefly, the samples were prepared by drop-casting of the solution containing vesicles on a copper/rhodium-coated TEM grid, followed by staining with 1% uranyl acetate, and the vesicle size was measured by ImageJ software. Further analyses by flow-cytometry measured the expression of immune checkpoints and costimulatory molecules on Exo conjugated to beads. To this, MoAbs to PD-1 (BioLegend, San Diego, CA), CD28 (eBioscience) and ICOS (gift from Prof. Dianzani, University of Novara, Italy) as well as to CD80 and CD86 were adopted to evaluate their levels on CD3+ and CD11c+ latex-beads, respectively. Parallel investigations were completed on available Exo specimens (n = 18) that were purified by immune affinity capture method using Dynabeads M450 (Invitrogen) previously conjugated with anti-CD3 or anti-CD11 c MoAbs, accordingly to the manufacturers’ instructions. Then, CD28, PD-1 and ICOS as well as CD80/CD86 were evaluated in their expression. Mouse IgG1 a and IgG2 a were used for isotypic controls.
Statistical analysis
The Mann-Whitney test explored the PD-1, CD28 and ICOS levels in both groups A and B. The cut-off value for PD-1+, CD28+ and ICOS+ T-Exo was calculated by the Receiver Operating Characteristic (ROC) curve analysis to identify MM patients with high probability to respond to IPI. In addition, the area under the curve (AUC) and the 95% confidence interval (C.I.) were also calculated with p < 0.05 significant. The correlations were completed by the Spearman's rank correlation test. Furthermore, the Fisher exact test explored the difference of responsiveness among patients with high or low PD-1 and CD28 levels as well as in those with positive or negative variation of CD86 expression by D-Exo (∆D-Exo) during IPI. progression-free survival (PFS) was calculated as the interval between the first dose of IPI and the date of disease progression or death, whereas OS was the interval between the first dose of IPI and death. The Kaplan-Meier method calculated both PFS and OS while the relative hazard ratio (HR) and the associated two-sided 95% C.I. were estimated by the stratified Cox proportional-hazard model. The one-way univariate ANOVA explored the correlation among checkpoint levels by T-Exo and pathological, molecular and clinical features of MM patients. The statistical analyses were completed with the Medcalc software (version 12.7.0.0) using p < 0.05 as statistical significance.
Results
Exosome and peripheral immune cell characterization
Preliminary experiments verified the quality of Exo in relation to the expression of proper markers as CD9, CD63 and CD81 (, panel A) whose levels were higher than 90% in the majority of preparations. Apoptotic particles in vesicle collections were excluded by filtration while the lipid content in most instances was typical of Exo based on the considerable content of BMP, a lipid marker of intracellular membranes (S1: Supplementary ). (panel B) illustrates representative TEM images showing cup-shaped vesicles (arrows) whose morphology appeared proper of Exo with size ranging between 30 and 110 nM (mean 80 nm). Other analyses explored the antigenic profile of peripheral T-cells and mature DCs as well as that of serum Exo collected from MM patients. As shown in , representative panels (patient #3) illustrate the CD3 (C), CD80 and CD86 (D and E) expression by T-cells and DCs (red histograms) as well as by Exo (blue histograms), with values of positive events higher than 90% in all instances. Although these values were apparently similar in cells and Exo, they were also dependent on unequal expression of relative molecules since Exo were not-specifically linked to beads. Therefore, we measured PD-1, CD28 and ICOS expression on T-Exo in 18 preparations from MM patients through two alternative methods exploring by flow-cytometry, both the aspecific linkage with the aldehyd/sulfate latex beads, and, additionally, the specific binding of Exo to the anti-CD3-coated Dynabeads. Although the latex beads may theoretically bind to Exo stemmed from different cell populations, we found that PD-1, CD28 and ICOS levels measured by this method were positively correlated to those investigated by immune-affinity capture with anti-CD3 coupled Dynabeads (S2: Supplementary ; rho: 0.82, 0.84 and 0.79, respectively; p < 0.05 in all cases). Similar results were obtained by investigating the CD80/CD86 levels from CD11c-conjugated Dynabeads as compared to those from Exo coupled with latex beads (rho: 0.77; p < 0.05). Based on these findings and on simplicity and reproducibility of this method, the next set of experiments was completed on vesicles coupled with latex beads.
Figure 1. Antigenic profile of exosomes. (A) Exosomes isolated from patients with MM were characterized by flow-cytometry for the expression of CD9, CD63 and CD81 resulting in most instances higher than 95%. (B) Representative panels by TEM showing cup-shaped Exo (arrows) with a mean size of 80 nm (range: 40–110 nm). (C-D) A similar level of expression (higher than 90% in all instances) of CD3 as well as CD80 and CD86 antigens was revealed in peripheral mononuclear cells (red histograms) and Exo (blue histograms) isolated from 10 randomly selected MM patients. Histograms are representative of a single MM patient (pt.#3). Grey histograms are IgG1 a isotypic controls.
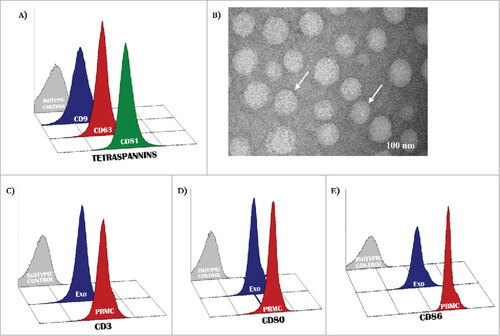
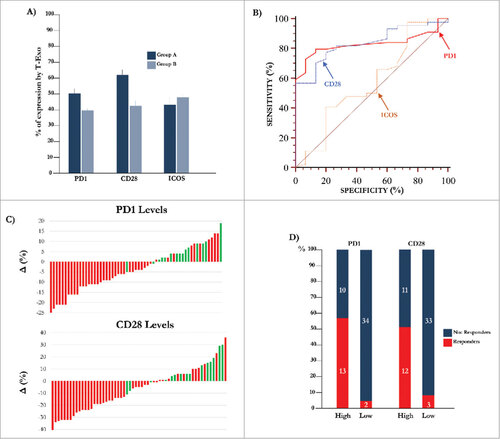
Figure 2. Expression of molecular immune checkpoints by T-Exo in MM population. (A) Levels of PD-1 (51.0±1.4%) and CD28 (62.6±3.0%) positive T-Exo were increased in groups A (p<0.0001) with respect to B (39.4±1.5% and 42.6±2.5%). By contrast, ICOS levels were almost similar. Bars are means±SEM (standard error of the mean). (B) Statistical analysis was completed to define the basal cut-off values of PD-1, CD28 and ICOS for exploring the meaning of their variation in MM population. As shown, the ROC curve analysis revealed a sensitivity and specificity equal to 79.5% and 86.7% for PD-1 (red line) while the values of CD28 (blue line) were 77.3% and 80%, respectively. A significant cut-off value for ICOS was not identified (yellow line). (C) Waterfall plots graphically represent the trend of PD-1 (up) and CD28 (down) levels with respect to basal cut-off in MM population treated with IPI. Green bars represent patients who achieved a response (CR, PR, SD) with respect to those showing PD (red bars). (D) The response of patients with high (n = 23) or low (n = 36) PD-1 and CD28 levels are represented. The 56.5% (n = 13) of patients with high PD-1 showed a clinical benefit as compared to only 5.5% of those with low levels (n = 2; p<0.0001). Similarly, 52% of patients with high CD28 levels showed a response (n = 12) with respect to the 8% (n = 3) characterized by low levels (p = 0.0004). Bars are percentage of patients divided in responders (red) and not-responders (blue).
Response to IPI and levels of immune checkpoint molecules on Exo
The clinical response to IPI was evaluated by irRC while major melanoma prognostic criteria of patients who completed the treatment are summarized in . A clinical response occurred in 15 patients (25.4%; group A) and included 3 with complete response (CR), 6 with partial response (PR) and 6 with stable disease (SD), whereas progressive disease (PD) was observed in 44 patients (74.6%; group B). Basal levels of PD-1 (57±12%), CD28 (69±11%) and ICOS (62±5%) were apparently similar in CD4+ and CD8+ cells from selected patients who also showed similar levels of CD80+/CD86+ DCs (5.3±0.8%). As shown in (panel A), the mean basal levels of PD-1+ (51.0±1.4%) and CD28+ (62.6±3.0%) T-Exo were increased in group A (p < 0.0001) with respect to B (39.4±1.5% and 42.6±2.5). By contrast, ICOS expression was almost similar (A: 43.1±5.8% and B: 48.1±3.0%). On the other hand, similar CD3 expression by Exo was demonstrated in group A and B (S3: Supplementary ), whereas the PD-1, CD28 and ICOS levels were lower then 5% in the CD3-negative vesicle fraction. As shown in , the univariate analysis did not reveal a significant correlation of PD1, CD28 and ICOS levels with Breslow, neither with the presence of TILs and ulceration, nor with clinical and laboratory parameters including site, number of metastasis and LDH levels. On the contrary, BRAF mutations and Clark levels showed a trend of correlation with CD28 levels, although a statistical difference was not obtained. Immune checkpoint levels detected by CD3+ T-Exo were not correlated with those expressed by peripheral CD3+ cells (S4: Supplementary ).
Table 1. Major prognostic criteria and mutational status in 59 MM patients enrolled in the study.
Figure 3. Kaplan-Meier curves for progression free survival and overall survival. (A) The Spearman's rank test revealed a positive correlation between PD-1 and CD28 levels of expression by T-Exo from MM population (rho: 0.459, p = 0.0003). (B) Median PFS and OS in MM population treated with IPI were 3.3 months and 8.5 months, respectively.
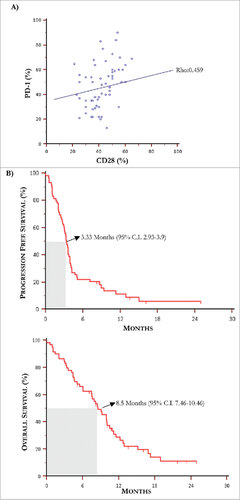
Table 2. One-way univariate analysis relative to molecular, pathological and laboratory parameters with respect to mean percentage levels of PD1 and CD28 by CD3+ Exo in MM population. TILs: tumor infiltrating lymphocytes; LDH: lactate dehydrogenase; ULN: upper limit of normal.
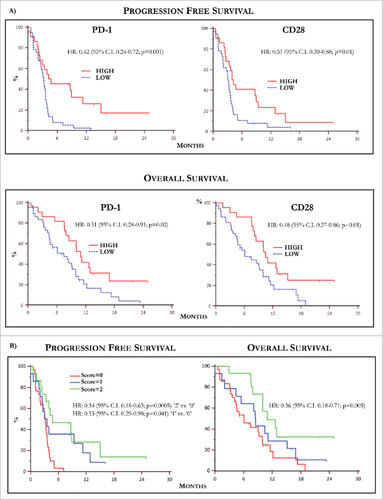
Figure 4. Kaplan-Meier curves by PD-1 and CD28 levels and predictive score. (A) Kaplan-Meier curves showing PFS (up) relative to PD-1 (left) and CD28 (right) levels in MM population. Patients with high basal PD-1 and CD28 T-Exo levels underwent increased PFS with respect to those with low expression of both receptors. The relative HR was 0.42 (95% C.I. 0.24-0.72) and 0.51 (95% C.I. 0.30-0.88), respectively (p < 0.05 in both instances). The OS (down) was similarly prolonged in patients bearing high basal PD-1 (HR:0.51, 95% C.I. 028-0.91) and CD28 (HR:0.48; 95% C.I. 0.27-0.86) expression (p < 0.05 in both instances). (B) PFS (left) and OS (right) calculated with respect to a predictive score calculated in relation to the basal values of PD-1 and CD28 higher or lower with respect to the cut-off. The study population was scored as follows: ‘0’ (n = 30; 50.8%), ‘1’ (n = 14; 23.7%), ‘2’ (n = 15; 25.4%). Median PFS and OS were 3.15 (95% CI: 2.03 to 3.57) and 6.06 months (95% CI: 4.1 to 9.9) in patients scored ‘0’, 3.56 (95% CI: 2.03 to 11.3) and 8.5 months (95% CI: 4.36 to 15.13) in those scored ‘1’ and 4.74 (95% CI, 3.33 to 15.00) and 10.93 months (95% CI, 10.0 to 12.9) in score ‘2’. Therefore, PFS (HR: 0.34, 95% C.I. 0.18-0.63; p = 0.0005) and OS (HR: 0.36, 95% C.I. 0.18- 0.71; p = 0.005) were significantly longer in score ‘2’ as compared to ‘0’, whereas a weak trend to significance in terms of median PFS occurred in ‘1’ (HR: 0.53, 95% C.I. 0.29-0.98; p = 0.041) with respect to ‘0’ without significant difference in terms of OS (p = 0.35). Finally, there was not significant difference in terms of PFS and OS between patients scored as ‘1’ or ‘2’. Score ‘2’: PD-1 hig/CD28 high; score ‘1’: PD-1 or CD28 high; score ‘0’: PD-1 and CD28 low. High and low levels were established in relation to values of ROC curves.
Levels of PD-1+/CD28+ Exo and response to IPI
Further experiments were devoted to define a potential predictive cut-off value of responsiveness to IPI by measuring in T-Exo the basal levels of PD-1, CD28 and ICOS. (panel B) illustrates the basal cut-off values of PD-1 and CD28 expression by ROC curve analysis which were 46% (AUC: 0.83; 95% CI:0.71-0.915) and 54% (AUC:0.836; 95% CI:0.717-0.92) respectively (p < 0.0001 in both instances). The sensitivity and specificity was equal to 79.5% and 86.7% for PD-1+, and 77.3% and 80% for CD28+ Exo, while a cut-off value for ICOS expression was not identified (AUC:0.57; 95% CI:0.43-0.70; p = 0.429). Waterfall plots (panel C) graphically represent the variation of PD-1 (up) and CD28 (down) basal levels from each MM patient with respect to relative cut-off. Briefly, an increment of both PD-1 (87%) and CD28 (80%) expression occurred in group A (green bars), whereas the majority of patients of group B (red bars) experienced a decrease of both PD-1 (77%) and CD28 (75%). In addition, parallel high levels of these checkpoints were observed in 67% of responders (n = 10), while low basal expression of PD-1 or CD28 with respect to relative cut-off, occurred in 13% (n = 2) and 20% (n = 3) of them, respectively. As shown in (panel D), a clinical response was achieved in 56.5% and 52% of patients with high PD-1 and CD28 levels with respect to those with low expression (5.5% and 8%, respectively; p < 0.05 in both instances). Moreover, a correlation (, panel A) between basal PD-1 and CD28 levels was revealed (rho:0.459; 95%; C.I.:0.23-0.64; p < 0.05). Levels of PD-1 and CD28 were almost unchanged in both responders and not-responders during the course of therapy as well as within two months after treatment.
Levels of PD-1 and CD28 correlate with PFS and OS
The next set of analyses verified the correlation of PD-1 and CD28 increase with survival in MM patients treated with IPI. The median follow-up was of 8.1 months and (panels B and C) shows the median PFS and OS resulting of 3.3 months (95% C.I. 2.93-3.9) and 8.5 months (95% C.I. 7.46-10.46), respectively. Based on the previous established cut-off values of PD-1 and CD28 and their correlation with response, PFS and OS were separately calculated in patients bearing high or low Exo levels of immune checkpoints. As shown in (panel A, up), patients with high basal PD-1 (left) and CD28 levels (right) underwent a median PFS of 4.7 months (95% C.I. 2.43-11.30) and 4.1 months (95% C.I. 2.66-8.90) as compared to those bearing low PD-1 (3.2 months; 95% C.I. 2.53-3.57) and CD28 (3.1 months; 95% C.I. 2.03-3.50). Parallel analyses proved that OS (panel A, down) was also increased in patients with high PD-1 (10.9 months; 5% C.I. 7.9-16.9) and CD28 (10.4 months; 95% C.I. 8.13-15.13) with respect to those showing lower levels (PD-1: 7.4 months; 95% C.I. 4.4-9.9 and CD28: 6.0 months; 95% C.I. 4.4-9.8).
In conclusion, with respect to relative cut-off values, patients with higher basal levels of PD-1 on T-Exo showed prolonged PFS (HR 0.42; 95% C.I. 0.24-0.72; p = 0.001) and OS (HR 0.51; 95%C.I. 0.28-0.91; p = 0.02) as compared to those with lower levels. Similarly, patients with high basal CD28 expression achieved a significant improvement of both PFS and OS (HR: 0.51, 95% C.I. 0.3-0.88; and 0.48, 95% C.I. 0.27-0.86, respectively; p = 0.01 in both instances).
Identification of a predictive score for IPI responders
Data from Kaplan-Meier survival analyses demonstrated that the high basal expression of both PD-1 and CD28 correlated with improved PFS and OS in MM population. Therefore, we next explored the hypothesis to identify, with respect to basal cut-off values, a predictive score by separating patients in relation to the expression of both PD-1 and CD28. As shown in (panel B), the study population was arbitrarily scored as follows: score: 0 (n = 30; 50.8%) showing low PD-1 and CD28; score: 1 (n = 14; 23.7%) patients with high PD-1 or CD28; score: 2 (n = 15; 25.5%) with high PD-1 and CD28. A median PFS and OS of 3.1 (95% CI, 2.03 to 3.57) and 6.0 months (95% CI, 4.1 to 9.9) characterized score ‘0’, whereas score ‘1’ showed a PFS of 3.5 (95% CI, 2.03 to 11.3) and OS of 8.5 months (95% CI, 4.36 to 15.13). Score ‘2’ showed a PFS of 4.7 (95% CI, 3.33 to 15.00) and OS of 10.9 months (95% CI, 10.0 to 12.9). Therefore, PFS (HR: 0.34, 95% C.I. 0.18-0.63; p = 0.0005) and OS (HR: 0.36, 95% C.I. 0.18- 0.71; p = 0.005) were significantly longer in patients with score ‘2’ as compared to score ‘0’, whereas a weak trend to significance in terms of median PFS occurred in score ‘1’ (HR: 0.53, 95% C.I. 0.29-0.98; p = 0.041) with respect to score ‘0’. On the contrary, a significant difference of PFS and OS (p = 0.35) was not demonstrated between score ‘1’ and ‘2’.
Taken together, these data confirmed that high basal levels of PD-1 and CD28 by Exo may better identify patients with MM most likely responding to IPI.
Levels of CD80 and CD86 by D-Exo correlate with response to IPI
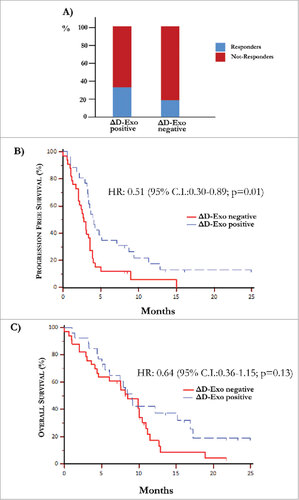
The mean D-Exo levels (Supplementary Fig. S5) calculated before (31.8±8.8%) and after treatment (31.6±10.4%) were not statistically different between responders (n = 15) and not-responders (n = 44). However, the ∆D-Exo was evaluated during IPI treatment as potential surrogate marker of outcome. As shown in (panel A), a clinical response at the end of treatment occurred in 35% of responders with increased ∆D-Exo and, contrariwise, in only 18% of those showing a decrease of ∆D-Exo. However, these results were not considered significant in relation to the low number of patients. As shown in (panel B), the major difference of expression of CD80 was correlated with improved median PFS of 4.1 months (95% C.I. 3.30–7.13), whereas patients with unchanged or reduced ∆D-Exo showed a worsened PFS (2.73 months, 95% C.I. 2.03-3.57; HR: 0.51, 95% C.I. 0.30-0.89; p = 0.01). By contrast, no significant difference in terms of OS was obtained (p = 0.13).
Figure 5. Over-expression of co-stimulatory molecules by D-Exo. (A) The difference of expression (Δ) of CD80 and CD86 levels by D-Exo before and after IPI was correlated to the clinical response. This linear correlation was confirmed at the end of treatment in 35% of patients with increased ΔD-Exo and, concurrently, only in 18% of those with decreased ΔD-Exo. Bars are percentage of patients showing ΔD-Exo positive (n = 26) and ΔD-Exo negative levels (n = 33) and include responders (blue) and not-responders (red). (B) Patients characterized by increased ΔD-Exo showed an improvement in terms of PFS (4.10 months vs 2.73 months) with respect to those with reduced ΔD-Exo with a HR of 0.51 (95% C.I. 0.30-0.89; p = 0.01). (C) Overall survival was independent by ΔD-Exo variation (HR: 0.64; 95% C.I. 0.36-1.15; p = 0.13).
These preliminary results, therefore, suggested that levels of costimulatory molecules on DCs might indirectly reflect the immune system activation since their upregulation in some patients at the end of IPI apparently correlated with the clinical response.
Discussion
The reinforcement of the immune system to suppress the cancer cell proliferation has recently resulted variably efficient and immunotherapy became a primary option in cancer treatment after approval of the CTLA-4 and PD-1 blockers in MM, also in lung and renal cancer.Citation28–30 Apart from preliminary clinical results, a recent pooled analysis proved a long-term survival in MM patients resulting in a definite and prolonged clinical benefit from IPI.Citation2 The achievement of this milestone, however, was neither correlated with clinical features, nor with serum biomarkers useful for the early identification of responders and the majority of studies failed in discovering an effective biomarker reflecting the efficacy of IPI. Here, we provide evidence that basal levels of PD-1 and CD28 by T-Exo may probably identify MM responders to IPI, while the change in expression of CD80 and CD86 on D-Exo reflects the prognosis.
Recently, the role of Exo in cancer progression is focused by clinical investigators and many efforts have been devoted to their isolation and characterization.Citation10 They express major histocompatibility complex antigens while carrying membrane and cytosolic proteins that regulate cytotoxicity, DC priming, T-cell apoptosis and NK activity that are required to control the tumor growth and progression.Citation31 We proved that patients with MM release serum Exo with a peculiar antigenic profile resembling the original cell while expressing CD9, CD63 and CD81 tetraspanins that in association with heat shock proteins (HSP70), serve to distinguish themselves from other cytosolic vesicles.Citation15 Based on the previously demonstrated diagnostic role of Exo in prostate cancer and their prognostic potential in ovarian cancer and glioblastoma, we investigated serum Exo in IPI-treated MM patients with the aim to explore a potential correlation with the outcome.
The abundance of T-cells, their antigenic repertoire and activation or suppressive phenotype as well as the proportion of V∂1+ and V∂2+ subsets and effector memory T-cells, are pivotal to identify IPI responders,Citation32,33 while variation of CD25, CD27, NY-ESO-1, TIM-3 or ICOS levels variably correlate with the clinical outcome.Citation34 Based on previous reports, it has been definitely proved that CTLA-4 exerts inhibitory effects on both T-cell activation and CD28 stimulation through complex mechanisms enrolling intrinsic and extrinsic cell adaption as trans-endocytosis events.Citation35 Moreover, the CTLA-4 blockade amplifies the expression of CD28 and ICOS necessary for achieving the best T-cell response and for reinforcing the anti-melanoma cytotoxicity.Citation36 In relation to the variability of CTLA-4 expression on T-cells mostly related to the trans-endocytosis mechanism, it is considered, therefore, a poor attractive biomarker in the clinical practice. Besides CD28 and ICOS, other potential biomarkers include PD-1 and PDL-1 whose levels by tumor cells poorly correlate with response in melanoma patients receiving immunotherapy. On the other hand, PD-1 is a functional immune checkpoint with inhibitory property on T-cells and its expression by TILs has been recently correlated with poor OS and PDL-1 up-regulation in B-cell lymphoma.Citation37 To this regard, pre-existing PD-1+ T-cells at the invasive tumor margins appear predictive of responsiveness to pembrolizumab in melanoma.Citation38 These data, however, have been obtained in small groups of patients and require larger number of donors as well as availability of tumoral tissues.
Immune checkpoints are relevant for driving the anti-melanoma activity and restoring the immune system functions while their levels apparently correlate with the clinical response to immunotherapy. Thus, we measured CD28, PD-1 and ICOS on Exo and found high basal CD28 and PD-1 levels in MM patients achieving a clinical response to IPI while on the contrary, a low expression in those in PD. In addition, we proved that Exo were the major source of PD-1 and CD28 signals with respect to other vesicle as definitely proved by TEM, lipidome and tetraspanins expression,Citation25–27 although functional events driving such a concomitant expression remain unclear. Contrariwise to previous data,Citation39 ICOS was poorly correlated with outcome because its cut-off value was not significant in terms of specificity and sensitivity. In this context, many studies demonstrated the major increase of CD4+/ICOS+ T-cells in patients achieving a survival benefit over twelve weeks from the CTLA-4 blockade.Citation3 Based on these results and our preliminary evidence, it is conceivable therefore, that ICOS plays a modest prognostic meaning in our IPI-treated population.
Other proposed biomarkers for the evaluation of IPI response include the ALC or the measurement of N/L ratio that reflect the benefit along the course of therapy, whereas the LDH is a functional indicator of the clinical activity in melanoma and its levels greater than two-fold the normal value correlate with failure of CTLA-4 blockade.Citation39,40 Hence, LDH variation is a meaningful prognostic rather than predictive biomarker of response to IPI in the majority of patients. The modest predictive role of LDH was also indirectly proved in our population since the univariate analysis failed to discover a potential correlation of LDH values with levels of either PD-1+ or CD28+ Exo. By contrast, waterfall plots and correlative analysis revealed a linear relation between PD-1 and CD28 Exo levels with the clinical outcome as well as PFS improvement in patients with high basal levels of PD-1 and CD28 or a parallel advantage in terms of OS that was ever longer than 20 months in a few patients. In addition to the potential role played in B-cell lymphoma and MM,Citation35 this is the first evidence suggesting the functional measurement of PD-1 as predictor biomarker in candidates to immunotherapy, whereas the variability of CTLA-4 expression also yields CD28 as a further biomarker in melanoma management.Citation32 Furthermore, besides the significance of PD-1 and CD28 levels on PFS and OS in IPI responders, we realized a meaningfulness score based on the concurrent or individual increase or decrease of their levels before treatment. Patients with the highest score showed the greatest benefit with both a median PFS and OS longer than 6 and 12 months, respectively. Thus, the basal expression of these molecules reflects a state of immune activation probably due to an already ongoing anti-tumor response as well as the ability of cytotoxic T-cells to remain armed against melanoma during IPI and their measurement could be, therefore, essential for the selection of candidates. In this context, no data on predictive biomarkers of responsiveness to immunotherapy are available and, if compared to circulating immune cells, Exo detection provides an easy tool for selecting the responders to immunotherapy in the clinical practice. Apart from the diagnostic and prognostic value in other cancers,Citation15–17 Exo resemble the features of their original cells in terms of antigenic repertoire, proteins and nucleic acids and also play a functional role. Thus, the superiority of Exo with respect to PBMCs has also been proven in vaccination trials revealing a more powerful anti-melanoma activity in patients treated with DC-derived Exo as compared to those treated with PBMC-DCs.Citation41 Based on the abundancy of serum Exo in MM patients, stability and reproducibility of their detection as compared to peripheral cells, our data support their valuable measurement in the clinical setting. On the other hand, such a predictive role of CD28 and PD-1 on Exo in melanoma could be useful in monitoring the therapeutic response during immunotherapy with respect to other methodology.Citation25
Exosomes secreted by immature and mature DCs have been largely described and used for vaccination trials in experimental and human MM because they are functional in inducing T-cell activation.Citation22 We demonstrated that D-Exo express high levels of CD80 and CD86 co-stimulatory molecules, thus confirming their origin from mature DCs. Furthermore, D-Exo efficiently activate T-cells and we proved that an increase of ∆D-Exo was associated with clinical response. Thus, based on the improvement of PFS and OS in MM patients, the putative prognostic role of D-Exo in patients with high basal PD-1 and CD28 levels, can indirectly suggest the role of IPI in restoring the immune system health.
In conclusion, T-Exo appear as reliable and easily measurable biomarkers for the selection of MM patients who could benefit from IPI. Moreover, the validation of D-Exo measurement in this population requires large clinical trials to confirm its clinical application to select the MM patients to immunotherapy in relation to multiple options including combinatory or sequencing treatments with the targeted therapy.
Authorship
Authors disclose financial conflict of interest.
1387706.zip
Download Zip (1.7 MB)Acknowledgment
This work was funded by a grant (# IG11647) from AIRC (Italian Association for Cancer Research). Authors are grateful to Angela Corcelli, PhD (Department of Basic Medical Science, Neuroscience and Sense Organs, University of Bari ‘Aldo Moro’) for lipidome analysis and TEM visualization of exosomes.
References
- Hodi FS, O'Day SJ, McDermott DF, Weber RW. Improved survival with ipilimumab in patients with metastatic melanoma. N Engl J Med. 2010;363:711–23. doi:10.105/NEJMoa1003466.
- Schadendorf D, Hodi FS, Robert C, Weber JS, Margolin K, Hamid O, Patt D, Chen T-T, Berman DM, Wolchok JD. Pooled analysis of long-term survival data from phase II and Phase III trials of ipilimumab in unresectable or metastatic melanoma. J Clin Oncol. 2016;33:1889–94. doi:10.120/JCO.2014.56.2736.
- Di Giacomo AM, Calabro L, Danielli R, Fonsatti E, Bertocci E, Pesce I, Fazio C, Cutaia O, Giannarelli D, Miracco C, et al. Long-term survival and immunological parameters in metastatic melanoma patients who responded to ipilimumab 10 m/kg within an expanded access programme. Cancer Immunol Immunother. 2013;62:1021–8. doi:10.100/s00262-013-1418-6.
- Martens A, Wistuba-Hamprecht K, Foppen MG, Yuan J, Postow MA, Wong P, Romano E, Khammari A, Dréno B, Capone M, et al. Baseline peripheral blood biomarkers associated with clinical outcome of advanced melanoma patients treated with ipilimumab. Clin Cancer Res. 2016;22:2908–18. doi:10.115/1078-0432.CCR-15-2412.
- Callahan MK, Wolchok JD, Allison JP. Anti–CTLA-4 antibody therapy: immune monitoring during clinical development of a novel immunotherapy. Semin Oncol. 2010;37:473–84. doi:10.105/j.seminoncol.2010.09.001.
- Kitano S, Tsuji T, Liu C, Hirschhorn-Cymerman D, Kyi C, Mu Z, Allison JP, Gnjatic S, Yuan JD, Wolchok JD. Enhancement of tumor-reactive cytotoxic CD4+ T-cell responses after ipilimumab treatment in four advanced melanoma patients. Cancer Immunol Res. 2013;1:235–44. doi:10.115/2326-6066.CIR-13-0068.
- Chen H, Liakou CI, Kamat A, Pettaway C, Ward JF, Tang DN, Sun J, Jungbluth AA, Troncoso P, Logothetis C, et al. Anti-CTLA-4 therapy results in higher CD4+ICOShi T cell frequency and IFN-γ levels in both nonmalignant and malignant prostate tissues. Proc Natl Acad Sci USA. 2009;106:2729–34. doi:10.107/pnas.0813175106.
- Yuan J, Adamow M, Ginsberg BA, Rasalan TS, Ritter E, Gallardo HF, Xu Y, Pogoriler E, Terzulli SL, Kuk D, et al. Integrated NY-ESO-1 antibody and CD8+ T-cell responses correlate with clinical benefit in advanced melanoma patients treated with ipilimumab. Proc Natl Acad Sci USA. 2011;108:16723–8. doi:10.107/pnas.1110814108.
- Hannani D, Vétizou M, Enot D, Rusakiewicz S, Chaput N, Klatzmann D, Jacquelot N, Vimond N, Chouaib S, Mateus C, et al. Anticancer immunotherapy by CTLA-4 blockade: obligatory contribution of IL-2 receptors and negative prognostic impact of soluble CD25. Cell Res. 2015;25:208–24. doi:10.103/cr.2015.3.
- Vlassov AV, Magdaleno S, Setterquist R, Conrad R. Exosomes: Current knowledge of their composition, biological functions, and diagnostic and therapeutic potentials. Biochim Biophys Acta. 2012;1820:940–8. doi:10.101/j.bbagen.2012.03.017.
- Mannavola F, Tucci M, Felici C, Stucci S, Silvestris F. miRNAs in melanoma: a defined role in tumor progression and metastasis. Exp Rev Clin Immunol. 2015;12:79–89. doi:10.158/1744666X.2016.1100965.
- Skog J, Würdinger T, van Rijn S, Meijer DH, Gainche L, Curry WT, Carter BS, Krichevsky AM, Breakefield XO. Glioblastoma microvesicles transport RNA and proteins that promote tumour growth and provide diagnostic biomarkers. Nat Cell Biol. 2008;10:1470–6. doi:10.103/ncb1800.
- Hoshino A, Costa-Silva B, Shen T-L, Rodrigues G, Hashimoto A, Mark MT, Molina H, Kohsaka S, Di Giannatale A, Ceder S, et al. Tumour exosome integrins determine organotropic metastasis. Nature. 2015;527:329–35. doi:10.103/nature15756.
- Peinado H, Alečković M, Lavotshkin S, Matei I, Costa-Silva B, Moreno-Bueno G, Hergueta-Redondo M, Williams C, García-Santos G, Ghajar CM, et al. Melanoma exosomes educate bone marrow progenitor cells toward a pro-metastatic phenotype through MET. Nat Med. 2012;18:883–91. doi:10.103/nm.2753.
- Logozzi M, De Milito A, Lugini L, Borghi M, Calabro L, Spada M, Perdicchio M, Marino ML, Federici C, Iessi E, et al. High levels of exosomes expressing CD63 and Caveolin-1 in plasma of melanoma patients. PLoS ONE. 2009;4:e5219–10. doi:10.137/journal.pone.0005219.
- Lazar I, Clement E, Ducoux Petit M, Denat L, Soldan V, Dauvillier S, Balor S, Burlet Schiltz O, Larue L, Muller C, et al. Proteome characterization of melanoma exosomes reveals a specific signature for metastatic cell lines. Pigment Cell Melanoma Res. 2015;28:464–75. doi:10.111/pcmr.12380.
- Zijlstra C, Stoorvogel W. Prostasomes as a source of diagnostic biomarkers for prostate cancer. JCI. 2016;126:1144–51. doi:10.117/JCI81128.
- Properzi F, Logozzi M, Fais S. Exosomes: the future of biomarkers in medicine. Biomarkers Med. 2013;7:769–78. doi:10.221/bmm.13.63.
- Redzic J, Ung T, Graner M. Glioblastoma extracellular vesicles: reservoirs of potential biomarkers. Pharm Pers Med. 2014;7:65–13.
- Adams M, Navabi H, Croston D, Coleman S, Tabi Z, Clayton A, Jasani B, Mason MD. The rationale for combined chem/immunotherapy using a Toll-like receptor 3 (TLR3) agonist and tumour-derived exosomes in advanced ovarian cancer. Vaccine. 2005;23:2374–8. doi:10.101/j.vaccine.2005.01.014.
- Pitt JM, André F, Amigorena S, Soria J-C, Eggermont A, Kroemer G, Zitvogel L. Dendritic cell–derived exosomes for cancer therapy. JCI. 2016;126:1224–32. doi:10.117/JCI81137.
- Escudier B, Dorval T, Chaput N, André F, Caby M-P, Novault S, Flament C, Leboulaire C, Borg C, Amigorena S, et al. Vaccination of metastatic melanoma patients with autologous dendritic cell (DC) derived-exosomes: results of thefirst phase I clinical trial. J Transl Med. 2005;3:10. doi:10.118/1479-5876-3-10.
- Tucci M, Stucci S, Passarelli A, D'Oronzo S, Silvestris F. Everolimus restrains the IL-17 A-dependent osteoclast-like transdifferentiation of dendritic cells in multiple myeloma. Exp Hematol. 2017;47:48–53. doi:10.101/j.exphem.2016.10.004.
- Tucci M, Stucci S, Savonarola A, Ciavarella S, Cafforio P, Dammacco F, Silvestris F. Immature dendritic cells in multiple myeloma are prone to osteoclast-like differentiation through interleukin-17 A stimulation. Br J Haematol. 2013;161:821–31. doi:10.111/bjh.12333.
- Théry C, Amigorena S, Raposo G, Clayton A. Isolation and characterization of exosomes from cell culture supernatants and biological fluids. 5th ed. Hoboken (NJ, USA): John Wiley & Sons, Inc; 2006.
- Lötvall J, Hill AF, Hochberg F, Buzàs EI, Di Vizio D, Gardiner C, Gho YS, Kurochin IV, Mathivanan S, Quesenberry P, Sahoo S, et al. Minimal experimental requirements for definition of extracellular vesicles and their functions: a position statement for the international society for extracellular vesicles. J Extracell Vesic. 2014;3:26913. doi:10.340/jev.v3.26913.
- Record M, Carayon K, Poirot M, Silvente-Poirot S. Exosomes as new vesicular lipid transporters involved in cell-cell communication and various pathophysiologies. Bioch Biophys Acta. 2014;1841:108–20.
- Robert C, Long GV, Brady B, Dutriaux C, Maio M, Mortier L, Hassel JC, Rutkowski P, McNeil C, Kalinka-Warzocha E, et al. Nivolumab in previously untreated melanoma without BRAF mutation. N Engl J Med. 2015;372:320–30. doi:10.105/NEJMoa1412082.
- Borghaei H, Paz-Ares L, Horn L, Spigel DR, Steins M, Ready NE, Chow LQ, Vokes EE, Felip E, Holgado E, et al. Nivolumab versus docetaxel in advanced nonsquamous non–small-cell lung cancer. N Engl J Med. 2015;373:1627–39. doi:10.105/NEJMoa1507643.
- Motzer RJ, Escudier B, McDermott DF, George S, Hammers HJ, Srinivas S, Tykodi SS, Sosman JA, Procopio G, Plimack ER, et al. Nivolumab versus everolimus in advanced renal-cell carcinoma. N Engl J Med. 2015;373:1803–13. doi:10.105/NEJMoa1510665.
- Tucci M, Stucci S, Passarelli A, Giudice G, Dammacco F, Silvestris F. The immune escape in melanoma: role of the impaired dendritic cell function. Exp Rev Clin Immunol. 2014;10:1395–404. doi:10.158/1744666X.2014.955851.
- Wistuba-Hamprecht K, Martens A, Heubach F, Romano E, Foppen MG, Yuan J, Postow M, Wong P, Mallardo D, Schilling B, et al. Peripheral CD8 effector-memory type 1 T-cells correlate with outcome in ipilimumab-treated stage IV melanoma patients. Eur J Cancer. 2017;73:61–70. doi:10.101/j.ejca.2016.12.011.
- Wistuba-Hamprecht K, Martens A, Haehnel K, Geukes Foppen M, Yuan J, Postow MA, Wong P, Romano E, Khammari A, Dréno B, et al. Proportions of blood-borne Vδ1+ and Vδ2+ T-cells are associated with overall survival of melanoma patients treated with ipilimumab. Eur J Cancer. 2016;64:116–26. doi:10.101/j.ejca.2016.06.001.
- Ascierto PA, Kalos M, Schaer DA, Callahan MK, Wolchok JD. Biomarkers for immunostimulatory monoclonal antibodies in combination strategies for melanoma and other tumor types. Clin Cancer Res. 2013;19:1009–20. doi:10.115/1078-0432.CCR-12-2982.
- Gardner D, Jeffery LE, Sansom DM. Understanding the CD2/CTLA-4 (CD152) pathway and its implications for costimulatory blockade. Am J Transpl. 2014;14:1985–91. doi:10.111/ajt.12834.
- Liakou CI, Kamat A, Tang DN, Chen H, Sun J, Troncoso P, Logothetis C, Sharma P. CTLA-4 blockade increases IFNγ-producing CD4+ICOShi cells to shift the ratio of effector to regulatory T cells in cancer patients. Proc Natl Acad Sci USA. 2008;105:14987–92. doi:10.107/pnas.0806075105.
- Four M, Cacheux V, Tempier A, Platero D, Fabbro M, Marin G, Leventoux N, Rigau V, Costes-Martineau V, Szablewski V. PD1 and PDL1 expression in primary central nervous system diffuse large B-cell lymphoma are frequent and expression of PD1 predicts poor survival. Hematol Oncol. December 13 2016. doi:10.100/hon.2375. [Epub ahead of print ].
- Tumeh PC, Harview CL, Yearley JH, Shintaku IP, Taylor EJM, Robert L, Chmielowski B, Spasic M, Henry G, Ciobanu V, et al. PD-1 blockade induces responses by inhibiting adaptive immune resistance. Nature. 2014;515:568–71. doi:10.103/nature13954.
- Weide B, Di Giacomo AM, Fonsatti E, Zitvogel L. Immunologic correlates in the course of treatment with immunomodulating antibodies. Seminars Oncol. 2015;42:448–58. doi:10.105/j.seminoncol.2015.02.016.
- Ferrucci PF, Ascierto PA, Pigozzo J, Del Vecchio M, Maio M, Antonini Cappellini GC, Guidoboni M, Queirolo P, Savoia P, Mandalà M, et al. Baseline neutrophils and derived neutrophil-to-lymphocyte ratio: prognostic relevance in metastatic melanoma patients receiving ipilimumab. Ann Oncol. 2016;27:732–8. doi:10.109/annon/mdw016.
- Viaud S, Théry C, Ploix S, Tursz T, Lapierre V, Lantz O, Zitvogel L, Chaput N. Dendritic cell-derived exosomes for cancer immunotherapy: what's next? Cancer Res. 2010;70:1281–5. doi:10.115/0008-5472.CAN-09-3276.