
ABSTRACT
K-Ras mutations are a hallmark of human pancreatic adenocarcinoma (PDAC) and epithelial-mesenchymal-transition (EMT) is a driver of progression. Oncogenic K-Ras causes the constitutive activation of NF-kB and the switch-on of an inflammatory program, which further fuels NF-kB and STAT3 activation. In this study we investigated how inflammatory pathways triggered by oncogenic K-Ras are regulated in human pancreatic cancer cells with distict epithelial or mesenchymal phenotype. Our results demonstrate that in cells with epithelial features, K-Ras driven inflammation is under the control of IL-1, while in cells undergoing EMT, is IL-1 independent. In pancreatic tumor cells with EMT phenotype, treatment with IL-1R antagonist (Anakinra) did not inhibit inflammatory cytokine production and tumor growth in mice. In these cells IL-6 is actively transcribed by the EMT transcription factor TWIST. Targeting of mesenchymal pancreatic tumors in vivo with anti-IL-6RmAb (RoActemra) successfully decreased tumor growth in immunodeficient mice, inhibited the inflammatory stroma and NF-kB-p65 and STAT3 phosphorylation in cancer cells. The results confirm that IL-1 is an important driver of inflammation in epithelial pancreatic tumors; however, tumor cells undergoing EMT will likely escape IL-1R inhibition, as IL-6 is continuously transcribed by TWIST. These findings have implications for the rational targeting of inflammatory pathways in human pancreatic cancer.
Introduction
Chronic inflammation is a driver of tumor progression and is considered a promising target for therapeutic interventions.Citation1–5 In cancer, inflammatory pathways are activated either by inflammatory cells present in the tumor micro-environment (extrinsic pathway) or by genetic lesions causing cancer, such as oncogenes or loss of tumor suppressor genes (intrinsic pathway).Citation6 Oncogene-mediated activation of a cell-autonomous inflammatory programme is believed to have an important impact on tumor cell fate, their relationship with the micro-environment and response to therapy.
In pancreatic ductal adenocarcinoma (PDAC), a leading cause of cancer related mortality,Citation7 mutations in the K-Ras gene are the key and earliest genetic event playing a central role in the initiation and maintenance of this disease.Citation8 K-Ras affects several different cellular functions and intersects many signaling pathways, for instance: the RAF-MAPK, phosphoinositide 3-kinase and Ral-GDS pathways, which are involved in the establishment of a malignant phenotype through mechanisms of proliferation, survival, angiogenesis, invasion and chemo-resistance.Citation9 Oncogenic components of the RAS-RAF signaling pathway also trigger an intrinsic inflammatory programme by activating the transcription factor NF-κB which in turn stimulates the production of inflammatory chemokines and cytokines.Citation10,11
Cytokines of the IL-1 family are key inflammatory mediators.Citation12 The presence of IL-1 at sites of tumor development activates NF-κB and enhances the expression of adhesion molecules on endothelial and malignant cells and promotes early tumor invasiveness, angiogenesis and metastasis.Citation13 It has been established that a feed-forward loop occurs where inflammatory mediators, and particularly IL-1, activate and prolong both NF-κB and K-Ras activity, ultimately leading to promotion of PDAC progression.Citation14–16 The K-Ras oncogene is also involved in switching on the transcription factors associated with the Epithelial-Mesenchymal Transition (EMT), linked with aggressiveness of PDAC.Citation17,18
EMT is importantly involved in cancer invasion and metastasis. It is marked by loss of epithelial markers and up-regulation of mesenchymal markers primarily at the invasive front of the tumor, eventually resulting in migrating cells causing metastasis.Citation19,20 Pancreatic cancer cells have been demonstrated to undergo EMT and acquire invasiveness at early time point during neoplastic transformation.Citation21,22 A link exists between the EMT program and K-Ras-driven inflammation.Citation23–26 Several inflammatory factors, mainly produced by infiltrating macrophages or activated fibroblasts, such as TNF-α, IL-6 and other have been reported to induce EMT in cancer cells.Citation27,28 However, how inflammation is regulated intrinsically in PDAC cells displaying an epithelial or mesenchymal phenotype is unclear. In this study, we have characterized the inflammatory pathways in recently K-Ras transduced pancreatic cells according to their distinct epithelial or mesenchymal features. We performed a single cell cloning of the immortalized human pancreatic epithelial cells (HPDE-E6E7) immediately after transduction with the mutant form of K-Ras (G12 V). Characterization of epithelial or EMT traits of cloned lines was performed in vitro and in vivo with phenotypic and functional assays. Our results demonstrate that K-Ras-driven cytokine-mediated inflammation is differentially regulated in epithelial and mesenchymal K-Ras-transformed pancreatic cells, with implications for pathogenesis and therapeutic targeting.
Results
Acquisition of the EMT phenotype is a frequent event in early K-Ras -transduced pancreatic cells
Malignant transformation caused by oncogenes, like the activated K-Ras, results in an intrinsic heterogeneity of the transformed cells, which encompasses EMT. To dissect this heterogeneity, we performed single cell cloning of the immortalized human pancreatic epithelial cells (HPDE-E6E7) immediately after transduction with the mutant form of K-Ras (G12 V). Sixty-three HPDE-K-Ras G12V clones were selected for further characterization in a first experiment and 25 clones in a second identical experiment. HPDE-K-Ras G12V sub-lines were initially screened for the mRNA expression of E-Cadherin and Vimentin and categorized as “Epithelial” (high E-Cadherin and low Vimentin) or “Mesenchymal” (high Vimentin and low E-Cadherin) compared to Mock-transduced HPDE cells. In both experiments more than 50% of clones (51% and 52%) exhibited a mesenchymal phenotype, whereas 25% and 28% of the clones had an epithelial one, and the remaining sub-lines had a mixed phenotype ().
Figure 1. Characterization of epithelial and EMT phenotype of individual cloned sublines derived from K-Ras -pancreatic cells. (A) Distribution of epithelial or mesenchymal phenotype of cloned sub-lines of HPDE-K-RasG12V from two independent experiments (n = 63 and n = 25). Each subline was evaluated for the expression of epithelial (high E-Cadherin, low vimentin) and mesenchymal markers (low E-Cadherin, high Vimentin) compared to Mock-transduced cells. (B) mRNA expression levels of TWIST, ZEB-2, SNAIL and SLUG analyzed by real time qPCR. (C) Expression of E-Cadherin protein by immunofluorescence using anti-human E-Cadherin antibody; nuclei are stained with DAPI. Scale bar = 50 μm. (D) Quantification of active K-Ras (bound to GTP) in epithelial and mesenchymal lines by the K-Ras-GTP pull down assay. Bars refer to band intensity.
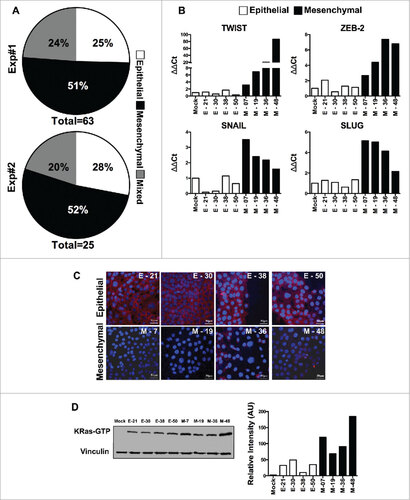
Of note, we also cloned the Mock-transduced cell line, to rule out intrinsic heterogeneity, but found that none of the 50 clones studied had increased levels of Vimentin or decreased expression of E-Cadherin (not shown), excluding the possibility that the heterogeneity seen after K-Ras-expression was pre-existing in these cells.
We selected 4 epithelial and 4 mesenchymal cloned sub-lines for further characterization. Mesenchymal lines (M-07, M-19, M-36 and M-48) showed significantly higher expression of EMT-associated transcription factors (ZEB2, TWIST, SNAIL and SLUG) when compared to Mock-cells and to epithelial lines (E-21, E-30, E-38 & E-50) ( & Fig. S1) and low or no immuno-staining for E-Cadherin, while epithelial lines were E-cadherin positive (). We next measured the active K-Ras (bound to GTP) by performing the Ras pull-down assay from individual cell lines followed by Western blot analysis. The results demonstrated that mesenchymal lines had significantly increased K-Ras activity compared to epithelial lines (). Overall these findings provide evidence that shift to an EMT program is an early and frequent event upon transduction of oncogenic K-Ras in epithelial cells and appears to be related to the amount of active K-Ras.
Mesenchymal HPDE-K-Ras G12V cell lines show enhanced invasive/metastatic ability both in vitro and in vivo
We next explored whether mesenchymal lines had functional features distinct from the epithelial ones. The proliferative activity in vitro was identical in both types of cells (not shown). The migrating and invasive ability in the Matrigel invasion assay showed higher invasive features of mesenchymal lines as compared to epithelial ones ( & ). In vivo growth in immuno-compromised animals was first tested using nude mice, but none of the sub-lines formed tumors up to 2 million cells. When injected into NOD/SCID/IL-2rg-/- (NSG) mice, all the cell lines were tumorigenic, with up to 90% tumor incidence with as low as 50,000 cells injected s.c. or i.m. (Fig S2), while the Mock-transduced cells were unable to form tumors. We also observed the trend that tumors derived from mesenchymal lines were smaller than epithelial ones () indicating, as already reported, that the EMT phenomenon switches cancer cells from a proliferative mode to an invasive one.Citation8,29,30
Figure 2. Characterization of epithelial and EMT functional features of individual cloned sublines derived from K-Ras -pancreatic cells. (A) Matrigel invasion assay of epithelial and EMT cell lines; shown are migrated cells (triplicates +/-SD) Student's t test #P<0.05. (B) Representative pictures of migrated cells in the lower membrane. (C) Tumor weight of different cell lines (5 × 10⁵) cells, grown in NSG mice, two-way ANOVA ##P< 0.01. (D) Incidence of liver metastasis after tumor cell injection (2 × 10⁶) in the spleen. (E) Representative (8 clones; 4 epithelial and 4 mesenchymal) images of liver metastasis (indicated by arrows) and histological sections of liver (H&E staining) to show metastatic nodules in the liver. Scale bar = 100 μm.
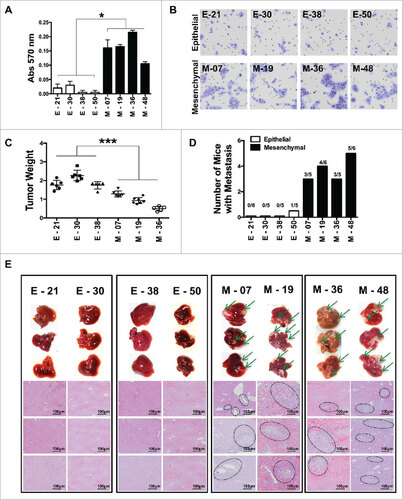
As there were no spontaneous metastases after i.m transplantation, we assessed, the ability to metastasize in vivo by injecting cells into the spleen of NSG mice and after 55–60 days they were sacrificed to check for liver metastasis. Gross examination and histological analysis of livers after 55–60 days demonstrated metastatic lesions in all the four mesenchymal lines tested, whereas epithelial lines were unable to form metastasis, with the exception of one metastatic deposit in 1/5 mice, for the E-50 cells ( and ).
Collectively, these results characterize, in vitro and in vivo, different cloned K-Ras-expressing pancreatic tumor cell lines with clear-cut distinguishable features typical of the epithelial or EMT phenotype. Of note, the original phenotype was checked throughout the study and was remarkably stable, with the accuracy to propagate cells in culture for no more than one month.
Distinct K-Ras-induced inflammatory programs in epithelial and mesenchymal pancreatic cells
We next addressed which autonomous inflammatory programme was switched on by K-Ras and whether any difference could be noted in pancreatic cells with distinct phenotypes. Several cytokines and chemokines contribute to the cancer-associated inflammation and are important to regulate growth, trafficking and invasion ability of tumor cells.Citation6,31,32 The constitutive production of several inflammatory cytokines was measured in cell supernatant by ELISA. All cloned cell lines, irrespective of their phenotype, were able to produce at least 1 or more of the following cytokines: IL-1α, IL-1β, IL-6, CXCL8; however, EMT lines had a tendency to produce higher concentrations and also produced pentraxin-3 (PTX3, a fluid phase pattern recognition molecule). Among eight cell lines screened, only one epithelial (E-21) and one EMT (M-48) showed a low inflammatory profile ().
Figure 3. IL-1R antagonist reduces inflammation and tumor growth only in K-Ras-pancreatic cells with epithelial phenotype. (A) Constitutive secretion of inflammatory mediators (IL-6, CXCL8 and PTX3) in different epithelial and mesenchymal cell lines measured by ELISA. (B) Inhibition of inflammatory mediators in cell lines upon blocking IL-1 signaling with Anakinra (100 ng/ml). Mean +/-SD, 3 independent experiments, #P< 0.05. (C) Tumor growth (volume) in NSG mice of epithelial cell lines (E-21, E-30, E-38) and mesenchymal cell lines (M-7, M-19, M-36), treated (solid circle) or not (empty circles) with Anakinra (2 μg/mouse, three times/week), 5–7 mice for each group, two-way ANOVA ##P<0.01 (D) Representative immunohistochemistry image of CD31+ vessel network in tumor sections from untreated or Anakinra-treated mice and relative quantification. (E) Representative Immunohistochemistry pictures (F4/80, macrophages) in the same tumors sections. Scale bar = 100 μm. Images were captured with V20Dot Slide microscope and analyzed with image pro analysis software in D and E, bar graphs indicate the quantification of the specific immunoreactive area (Mean +/-SD of 5 sections/tumor, 3–5 tumors per group). Student's t test #P<0.05 ##P<0.01 ###P<0.001. ns: non-significant.
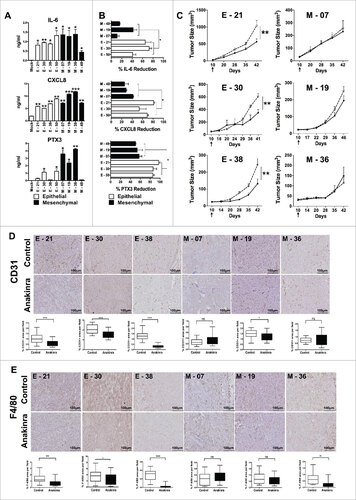
Interleukin-1 (IL-1) is a central mediator of inflammation/innate immunity and plays a crucial role in cancer progression.Citation9,33 To understand its role in K-Ras-expressing cells with different phenotypes, we first analyzed by flow cytometry the IL-1 receptor expression and found that all line types had similar levels of IL-1 R1 (Fig S3A). We then inhibited IL-1R signalling by treating cells in vitro with the IL-1 receptor antagonist (Anakinra) for 48 hrs. Treatment with Anakinra inhibited the constitutive production of inflammatory mediators, but interestingly, with distinct results: in epithelial lines, Anakinra significantly reduced the production of IL-6, PTX3 and CXCL8 with a mean inhibition of 73%, while in three different EMT lines, Anakinra had a much lower effect with a mean inhibition of 34%; (). This was especially evident for IL-6 production that was not significantly affected in 2/3 mesenchymal lines. This result was confirmed by using an shRNA approach to silence IL-1R (Fig S3B). Of note, cell viability and in vitro growth was unaffected in treated cells (Fig S3C). Thus, in K-Ras-expressing pancreatic cells with epithelial features, secretion of inflammatory mediators (especially IL-6), is under the control of IL-1 signalling, while in cells with mesenchymal features it is IL-1-independent.
We next tested the effect of Anakinra on tumor growth in vivo. Three EMT and three epithelial lines were i.m. injected in NSG mice and 10 days post inoculation, 2μg of Anakinra was administered three times a week into the peri-tumoral region. Saline was used in control mice. After six weeks of treatment, tumors derived from epithelial lines showed a significantly reduced tumor volume and weight, while tumor growth from mesenchymal lines was not inhibited ( & S4). We also observed that epithelial tumors responding to Anakinra showed significantly less vessels (stained with CD31), and macrophages (F4/80), as compared to saline-treated tumors, whereas mesenchymal tumors did not show any significant modification of the stromal environment ( & ). Only in one EMT line (M-19), a decrease in angiogenesis was observed, but to a much lesser extent. These results in vivo demonstrate the crucial role of IL-1 in the construction of the inflammatory microenvironment, and confirmed the above in vitro finding that cells with mesenchymal phenotype are unresponsive to IL-1R signaling block.
We next investigated the activation levels of NF-κB, a critical mediator of cancer-related inflammation, by performing immunohistochemistry of NF-κB p65 in epithelial and mesenchymal tumors treated in vivo with Anakinra. We found significantly lower expression of NF-κB p65 protein in epithelial treated tumors whereas mesenchymal tumors showed no difference compared to their respective control (). Furthermore, only in epithelial tumors, activation of STAT3 (phospho-STAT3-Tyr 705) was significantly decreased upon Anakinra treatment ().
Figure 4. IL-1R antagonist reduces NF-κB p65 and STAT3 phosphorylation in only K-Raspancreatic tumors with epithelial phenotype. Representative immunohistochemistry image of tumors from epithelial cell lines (E-21, E-30, E-38) and mesenchymal cell lines (M-7, M-19, M-36) treated or not with Anakinra as detailed in the legend of . (A) NF-κB p65 phosphorylation, and (B) STAT3 phosphorylation (Tyr 705). Scale bar = 100 mm. Graphs at right side indicate quantification of stained area. Bars indicate mean +/-SD of 5 sections/tumor, 3–5 tumors per group). Student's t test #P<0.05, ##P<0.01, ###P<0.001. (C) mRNA expression level of inflammatory mediators in the tumor microenvironment by real-time qPCR. Bars, mean +/-SD. #P<0.05, ##P<0.01 for difference between control and Anakinra treated group.
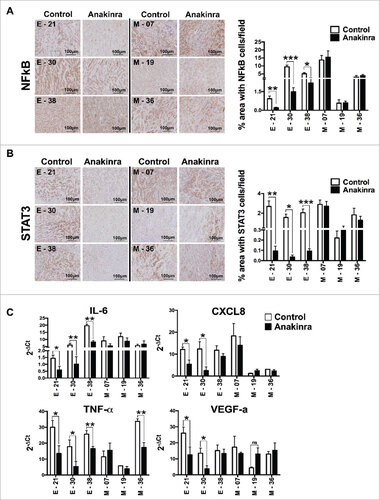
To have a broader overview of the inflammatory microenvironment, we quantified the mRNA levels of several inflammatory and pro-tumorigenic mediators such as IL-6, CXCL8, TNF-α, and VEGF-a, in tumor tissues of mice treated or not with Anakinra (.). The expression levels demonstrated that the responding epithelial tumors had significantly reduced pro-inflammatory and pro-tumorigenic mediators, while tumor growth from mesenchymal lines was not inhibited. Overall, the results confirmed in vivo that IL-1 is an important driver of inflammation in K-Ras-expressing pancreatic tumors with epithelial, but not with mesenchymal phenotype.
Link between IL-6 and EMT transcription factors
Our results that inflammatory cytokines (especially IL-6) were not controlled by IL-1 in EMT lines prompted us to investigate whether EMT transcription factors can regulate IL-6 expression. Upon silencing the transcription factors ZEB and TWIST in three mesenchymal lines using gene specific shRNA, we determined the expression levels of IL-6 and CXCL8. A significant reduction in the secretion of IL-6 and CXCL8 was found in TWIST-silenced cells, compared to scramble shRNA, while silencing of ZEB did not produce any effect ( & ). To confirm these findings we tested whether TWIST directly induces the expression of IL-6. We performed a ChIP assay with chromatin extracted from two EMT lines using anti–TWIST and anti-H3K9Ac antibodies, and observed an enrichment of TWIST on the proximal E-box of the IL-6 promoter in both lines. Accordingly, IL-6 promoter acetylation (recruitment of anti-H3K9 Ac antibody) was observed, suggesting that binding of TWIST to the IL-6 promoter correlates with active gene transcription (). These results indicate that in mesenchymal cells IL-6, and to a lesser extent CXCL8 production, is associated with the activity of the EMT transcription factor TWIST, explaining why these cytokines were still produced even when IL-1 signaling was abrogated by Anakinra.
Figure 5. IL-6 is transcriptionally activated by TWIST in K-Ras-pancreatic cells with mesenchymal phenotype. mRNA expression levels of TWIST (A) or Zeb2 (B) upon shRNA silencing of each specific transcription factor in four mesenchymal pancreatic cell lines. Graphs in the middle and right panels show ELISA quantification of IL-6 and CXCL8 in silenced cells. Bars, +/-SD. #P<0.05, ##P< 0.01, ###P<0.005 (Student's t test). (C) ChIP assay to evaluate the recruitment of TWIST to the IL-6 promoter. H3K9Ac antibody was used as a marker of active chromatin, while rabbit IgG was used as negative control. Input and immunoprecipitated DNA were analyzed by qPCR using primers that span the proximal E-box of the IL-6 promoter. Results are mean +/-SD of one of two independent experiments with similar results, ###P<0.005 (Student's t test).
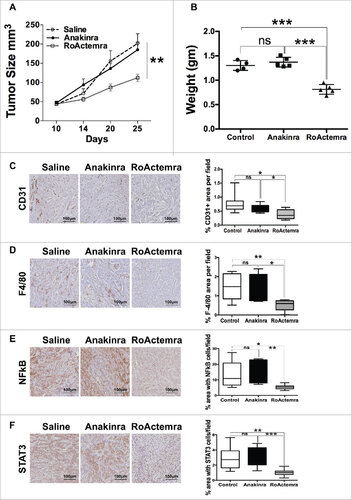
We next performed an in vivo experiment with the EMT line M-7 and treated mice with the clinically approved mAb anti-human IL-6 receptor (RoActerma, Roche), as well as with Anakinra. In mice treated with anti- IL-6R, tumor growth was significantly reduced, while Anakinra had no effect, confirming the previous experiments ( & ). Of note, exposure of cells in vitro in the presence of anti-IL-6R did not affect cell proliferation (Fig S5). Furthermore, the vessel network and the density of macrophages in tumors were decreased in mice receiving anti-IL-6 R ( & ). Phosphorylation of NFkB p65 and STAT3 was also decreased ( & ). Overall these results demonstrate the dominant role of IL-6, and not IL-1, in pancreatic tumor cells with EMT phenotype.
Figure 6. Anti-IL-6R mAb reduces inflammation and tumor growth in K-Ras -pancreatic cells with mesenchymal phenotype. Tumor growth (A) Tumor growth (volume) in NSG mice of mesenchymal cell lines (M-07), not treated (empty circle) or treated with Anakinra (solid circles) or with RoActemra (empty square), 2 μg/mouse, three times/week, 5–7 mice for each group, two-way ANOVA ##P<0.01. (B) Tumor weight (C) Representative Immunohistochemistry image of tumor sections with CD31 vessel network; (D) F4/80, macrophages; (E) NF-κB p65 phosphorylation; (F) STAT3 Tyr 705-phosphorylation. Image quantification was performed as detailed in and is shown in the right panels. #P<0.05, ##P< 0.01, ###P<0.005 (Student's t test).
Discussion
By using a cellular model of pancreatic epithelial cells (HPDE/E6E7) freshly transduced with the oncogenic K-RasG12V we have characterized the inflammatory programme switched on by K-Ras in distinct transformed sub-lines with specific epithelial or EMT phenotypes. This model allowed us to analyse the cell autonomous intrinsic inflammatory programme, without the influence of the extrinsic inflammation provided by host cells of the tumor microenvironment.
Tumor heterogeneity is a hallmark of K-Ras -induced carcinogenesis.Citation34 Of 88 different cloned lines analyzed from K-Ras transduced pancreatic cells, the original epithelial phenotype was preserved only in 25%, while in 50% of the cases the cells acquired an EMT phenotype and functional features: loss of E-Cadherin, upregulation of Vimentin and of typical transcription factors (TWIST, ZEB, SLUG, SNAIL). Unlike epithelial cells, EMT sub-lines had strong Matrigel-invasive ability and metastatic activity in vivo. These results indicate that a mesenchymal transition is an early and frequent event upon oncogenic K-Ras activation in pancreatic cells. A similar observation was previously made in a genetic mouse model of pancreatic cancer, where tagged cells with EMT phenotype were caught in the process of entering the circulation before histological signs of tumor formation were evident.Citation21
In our pancreatic sub-lines, the EMT phenotype was associated with higher K-Ras -GTP levels, suggesting a causal relationship. Higher Ras activity may act as an essential factor for the transformation of cellular phenotype leading to loss of E-Cadherin and gain of EMT markers, as suggested in earlier findings that the Ras-GTP level dictates the early metastasis in mouse models.Citation35,36 However, also epithelial lines had appreciable levels of active K-Ras. The significance of this finding and the need for a specific threshold of activity remains to be determined.
In spite of the phenotypic and functional heterogeneity of our cloned cell lines, the inflammatory programme switched on by K-Ras did not segregate with a particular phenotype. Both epithelial and EMT cell lines were able to produce several inflammatory mediators, including IL-1α/β, IL-6, CXCL8 and VEGF, which are known to be expressed by this tumor.Citation37–39 However, a distinct regulation of IL-6 and CXCL8 production was found in pancreatic cells with specific phenotypes.
IL-1 is a key driver of inflammation in Ras-expressing cancers.Citation40 A number of studies demonstrated that IL-1-mediated constitutive activation of NF-κB occurs in pancreatic tumors, and is a requirement for tumor development.Citation16,41–43 When we blocked IL-1R signaling with Anakinra (IL-1R antagonist), we found strong inhibition of IL-6 and CXCL8 production only in cells with epithelial phenotype. In vivo, Anakinra-treated mice had significant inhibition of tumor growth and lower infiltration of macrophages and vessels. Tumor sections showed reduced levels of NF-κB p65 and STAT3 phosphorylation, overall confirming that the inflammatory program in pancreatic cells with epithelial phenotype is orchestrated by IL-1.
Instead, in cells with EMT features, IL-1 inhibition had no effect on inflammation or on tumor growth in vivo, due to the persistence of inflammatory mediators, especially IL-6 and CXCL8. Immunohistochemistry of tumor sections still showed high phosphorylation of NF-κB p65 and STAT3 proteins. We further demonstrated that in EMT sublines the transcriptional activity of TWIST activates the production of IL-6 and CXCL8. The ChIP assay confirmed TWIST interaction with the IL-6 gene promoter. Overall, our results indicate that TWIST actively participates to the maintenance of an inflammatory environment in pancreatic cells with EMT phenotype.Citation44 In the adipose tissue, a similar result was previously reported, where silencing of TWIST reduced the levels of IL-6 and other inflammatory cytokines.Citation45 Furthermore a feed forward loop exists between IL-6 and TWIST, because IL-6-mediated STAT3 activation up-regulates TWIST.Citation46
Several studies underlined the well-known tumor promoting effect of STAT3 and IL-6 in pancreatic cancer.Citation47,48 The pro-tumorigenic role of IL-6 was confirmed also in our in vivo experiment in mice bearing tumors derived from an EMT cell line. While these tumors were unaffected by Anakinra, treatment with the anti-IL-6 receptor (RoActemra) significantly reduced tumor growth, the construction of a vessel network and the recruitment of macrophages in tumor tissues.
Thus, the cell autonomous intrinsic inflammatory programme triggered by oncogenic K-Ras in pancreatic cells with EMT features is no more under the control of IL-1, and production of IL-6 is dependent on the transcription factor TWIST. These results bear relevance in therapeutic settings. Cancer-promoting inflammation is now object of consideration of therapeutic interventions in oncology.Citation49–54 A recent report showed activity of IL-1R antagonist in pancreatic cancer preclinical models.Citation55 Early phase clinical trials are under way in un-resectable pancreatic tumor patients with inhibitors of IL-1R (Trial NCT02550327) and IL-6R (Trial NCT02767557) in combination with chemotherapy. It will be important to try to correlate activity with EMT phenotype.
In conclusion, our results confirm that IL-1 is an important driver of inflammation in epithelial pancreatic tumors and a potential therapeutic target. However, tumor cells which have already undergone EMT and express high TWIST will likely escape IL-1 inhibition, as IL-6 can be continuously transcribed by TWIST. Inhibition of IL-6, or simultaneous inhibition of IL-1 and IL-6 in holds promise for the rational targeting of inflammatory pathways in pancreatic cancer.
Materials and methods
Cell culture, lentiviral transduction and single cell cloning
HPDE cells were cultured in RPMI 1640 medium supplemented with 10% FBS, 2 mM Ultraglutamine and 100 U/ml penicillin/streptomycin (Lonza, BioWhittaker). Transduction was performed using lentiviral system. To generate lentiviral vector, K-Ras G12V was cloned into pRRLsinPPTGFPpre lentiviral vector. Viral particles were produced by transfecting packaging cell line 293T with the packaging plasmid (pCMV- ΔR8.74), the envelope plasmid (VSV-G gene) and with 10μg DNA of interest. Cells were transduced with filtered (0.45 μm) viral supernatant collected 24 hours and 48 hours after transfection, in 6 well plate and incubated in 5% CO2 incubator at 37°C. Positive transduced cells were sorted by Facs Aria based on GFP fluorescence. Single cell cloning was performed in 96 well flat well plates by limiting dilution method and expanded upon propagation. Lentiviral vector with shRNA for IL-1R (Thermo Scientific, RHS4531-NM_000877) and control shRNA (Thermo Scientific, RHS4346) was purchased from Thermo Scientific as bacterial stocks. shRNA for ZEB-2 (Sigma NM_014795.2), TWIST (Sigma, NM_000474) and Scramble shRNA (Addgene, 1864) was purchased as bacterial stocks. Culture was propagated in LB medium with ampicillin antibiotic and DNA was extracted following instructions from Promega Midi preparation DNA isolation kit.
Antibodies and Reagents
The following antibodies were used: Mouse CD31/PECAM-1 Antibody (R&D Systems AF3628), Rat Anti Mouse F4/80 (AbD Serotec MCA497GA), E-Cadherin (Transduction Laboratories C20820), Alexa Donkey anti-mouse 647, Alexa goat anti-rabbit 647 (Invitrogen), NF-κB p65 (Cell Signaling, C22B4), pSTAT3 (Tyr 705) (Cell Signaling, D3A7), Cells were transfected with lipofectamine (Invitrogen).
Flow cytometry
HPDE cells were removed from flasks non-enzymatically, washed, re-suspended in ice cold washing buffer (phosphate-buffered saline (PBS) containing 2% FCS) and incubated with 10 μg/ml APC-conjugated mouse anti-human IL-1R1 antibody (R&D Systems, Minneapolis, MN) for 30 minutes at 4°C. Cells were then washed and fixed with 2% PFA in PBS, acquired on FACS Canto and analyzed using Flowjo.
RT-PCR and quantitative real time qPCR
Total RNA was isolated either from cells or tumors using TRI reagent (Ambion) and quantified with nanodrop. DNAse treatment (Turbo DNA-freeê kit, Ambion) was performed to avoid genomic DNA contamination. 1μg of total RNA was reverse-transcribed using the High-Capacity cDNA Archive kit (Applied Biosystems). cDNA was analyzed by SYBER Green based Quantitative Real-Time PCR on ABI Prism® 7900HT Fast Real Time PCR System (Applied Biosystem). 18S/GAPDH was used as internal control to normalize. All gene specific primers were domestically designed. The sequences of the primer pairs are as follows: 18S: (F-CGCCGCTAGAGGTGAAATTC; R-CTTTCGCTCTGGTCCGTCTT); GAPDH: (F-AGATCATCAGCAATGCCTCCTG; R-ATGGCATGGACTGTGGTCATG); E-Cadherin: (F-GGAACTATGAAAAGTGGGCTTG; R-AAATTGCCAGGCTCAATGAC); Vimentin: (F-CCTTGAACGCAAAGTGGAATC; R-TGTTCCTGAATCTGAGCCTGC); TWIST: (F-AGCAAGATTCAGACCCTCAAGCT; R-CCTGGTAGAGGAAGTCGATGTACCT); ZEB2: (F-GCTACACGTTTGCCTACCGC; R-CGATTACCTGCTCCTTGGGTT); SNAIL: (F-GCACATCCGAAGCCACAC; R-GGAGAAGGTCCGAGCACAC); SLUG: (F-GGGGAGAAGCCTTTTTCTTG; R-TCCTCATGTTTGTGCAGGAG); IL-6: (F-GAAAGCAGCAAAGAGGCACT; R-TTTCACCAGGCAAGTCTCCT); CXCL8: (F-CCAGGAAGAAACCACCGGA; R-GAAATCAGGAAGGCTGCCAAG); VEGF-a: (F-GCTACTGCCATCCAATCGAG; R-GCTTGTCACATCTGCATTCAC); TNF-α: (F-CCG ATG GGT TGT ACC TTG TC; R-GGG CTG GGT AGA GAA TGG AT)
K-Ras -GTP pull down
Briefly, cells were collected and lysed with 1X ice-cold lysis buffer (MLB) supplemented with protease inhibitor cocktail. The cell lysate was diluted to 1μg/μl total cell protein in 1 ml of volume and pre-cleared with glutathione agarose. Ras-GTP was pulled down by adding 10μg Raf-1 RBD agarose for 1 ml of cell lysate at 4°C for 1 hr with gentle agitation. The agarose beads were washed three times with MLB, re-suspended in 2x sampling buffer and boiled for 5 minutes to release Ras-GTP. Supernatant was run on acrylamide gel, active Ras protein was detected with an Anti-Ras antibody (Millipore, Temecula, CA) and the band intensity was evaluated using ImageJ software.
Matrigel invasion
The cell invasion assay was performed using 24-well plate in triplicate by using a Matrigel-coated invasion chamber (BD Biosciences, Bedford, MA) with an 8.0 μm pore size polyethylene terephthalate (PET) membrane. The invasion assay was performed according to manufacturer's instructions. The migrated cells to the lower side of the inserts were fixed in methanol, stained with 1% Crystal Violet and then washed several times with PBS to remove the excessive stain. Insert chamber was then allowed to dry and the membrane was then taken out delicately using the tip of the needle to dissolve the attached cells in DMSO (dimethyl sulfoxide). Colorimetric analysis was performed at 570 nm to compare the number of cells that migrated to the lower side of the membrane. Alternatively the Transwell membrane was stained with Difco stain and invasive fixed cells at the bottom of the membrane were placed on glass slide mounted with coverslip and the images were captured from microscope.
Immunofluorescence
Cell lines were cultured on coverslips coated with Poly-L-Lysine, washed in PBS and fixed in 4% PFA for 15′. After two washes in 2% BSA in PBS, cells were incubated with the specific primary antibody E-Cadherin (Transduction Laboratories C20820), diluted in 2% BSA, 0.1% TritonX-100, 0.1% glycine, 5% Normal Goat Serum in PBS. After 3 washes in washing buffer (0.2% BSA, 0.05% Tween 20 in PBS), cells were incubated with secondary antibody Alexa Donkey anti-mouse 647 (Invitrogen) for 1 h at RT. After 4 washes in washing buffer, DAPI was used to stain nuclei. Coverslip was mounted with Fluor Preserve™ Reagent (Calbiochem) and the images were acquired with a laser scanning confocal microscope (FluoView FV1000; Olympus). For image analysis, Imaris X64 7.0.2 Software (Bitplane, AG) was used.
Measurement of cytokines (ELISA)
Equal number of cells (2 × 10⁶) were seeded in a monolayer fashion in a six well plate and allowed to incubate in CO2 incubator at 37°C. Supernatant was collected post 24 hour of incubation. ELISA for cytokines (IL-6, CXCL8, IL-1β and PTX3) was performed using human cytokine ELISA Kit (R&D) according to manufacturer instructions.
In vitro proliferation
Equal number of HPDE-K-Ras G12V cells were plated into 96 well plates. For each time point, 20 μl of MTT (5 mg/ml in PBS 1X) were added to each well (200 μl medium) and left at 37°C for 3 hours, in the dark. After aspiration of the medium, 100 μl of DMSO was added to each well and crystal was dissolved by pipetting up and down. The absorbance of this solution was measured at 570 nm.
Animal experiments
Procedures involving animals and their care conformed to institutional guidelines in compliance with national (4D.L. N.116, G.U., suppl. 40, 18-2-1992) and international law and policies (EEC Council Directive 2010/63/EU, OJ L 276/33, 22.09.2010; NIH Guide for the Care and Use of Laboratory Animals, U.S. National Research Council, 2011).
6–8 weeks old female NSG (NOD/SCID/IL-2rg−/−) mice (Jackson Laboratories) were used. Mice (6–7 mice for each group) received subcutaneous injection into both the flanks with 50,000 viable cells for tumor growth studies. For Anakinra study, mice (6 mice per group for each clone) received intramuscular injection of 50,000 cells into quadriceps muscle group on the anterior of thigh. After 10 days of inoculation, 2 μg of Anakinra (IL1RA; Peprotech, 200–01RA) per mouse, thrice a week was injected into the peri-tumoral region in 25 μl of volume using a 27-gauge needle. Control group received equal volume of saline. Similar procedure was followed when animals were treated with anti-human IL-6 R mAb (RoActerma, Roche, Milano, Italy).
Tumor volume was measured thrice a week. After 45 days, mice were sacrificed to harvest the tumors. For spleen-liver metastasis experiment, mice (6 mice for each group) were anesthetized with Avertin (Sigma-Aldrich, T4.840-2), and the spleen was exteriorized through a left lateral flank incision. Tumors were established by intrasplenic injection of two millions (2 × 10⁶) cell suspension using a 27-gauge needle. The injection site on the spleen was pressed with a cotton stick in order to wipe out any split cells and ensure hemostasis. The peritoneum and skin were closed with surgical thread. After 55–60 days, mice were sacrificed, liver removed and fixed for H&E staining.
Immunohistochemistry
Formalin-fixed, paraffin-embedded tissues were deparaffinised and endogenous peroxidase was blocked with 3% hydrogen peroxide for 20 min at room temperature. For CD31 and F4/80 staining, tumor sections were exposed to an antigen retrieval procedure with Diva Buffer in Decloacking chamber before being incubated with specific antibody (Mouse CD31/PECAM-1 Antibody (R&D Systems AF3628), Rat Anti-Mouse F4/80 (AbD Serotec MCA497 GA) for 1.5 h RT. For NF-κB p65 (C22B4, Cell Signaling), antigen retrieval was performed with citrate buffer (10 mM). For pSTAT3 (Tyr 705) (Cell Signalling, D3A7), antigen retrieval was done in 1 mM EDTA buffer. Reactive sites were identified by exposure to Anti-Rat Polymer HRP kit or Anti-Goat Polymer HRP kit (Biocare Medical, CA USA) for 30 min at room temperature. Immunoperoxidase staining was then performed by using diaminobenzidine as a chromogen (DAB+chromogenX-50, ChemMate, DakoCytomation, Carpinteria, CA, USA). The slides were finally counterstained with haematoxylin (Harris Hematoxilyn, DiaPath, Microstain Division, Martinengo, Bergamo, Italy), and analyzed with the computer-aided image pro analysis software to calculate the percentage of immunoreactive area as a fraction of the total area digitally captured.
Chromatin immunoprecipitation (ChIP)
Cells were seeded at the concentration of 3 × 10⁵ cells/ml, the day after ChIP was carried out with 5–10 × 106 cells according to a previously described protocol.Citation56 Briefly, cells were cross-linked with formaldehyde 1% at RT for 10 minutes then, chromatin was extracted and was sonicated to obtain fragments of about 400 bp. Immunoprecipitation was performed by incubating the chromatin at 4°C overnight with anti-TWIST antibody, anti-H3K9Ac antibody (Abcam) or normal rabbit IgG (Millipore) as negative control. Then, ChIP DNA fragments and input DNA were analyzed by qPCR using primers which are specific for the promoter regions of TWIST gene spanning two predicted E-boxes.Citation45 The sequences of primers are: h-IL6_promoter_Fw:ACCCTCACCCTCCAACAAAG;hIL6_promoter_Rev:GCCTCAGACATCTCCAGTCC. ChIP-enriched DNA was compared with input DNA, according to the formula 100 × 2(Input Ct − sample Ct).
Statistical analysis
Prism software (v6.0 a; Graphpad) was used to conduct appropriate statistical procedures, as noted in the individual figure legends. P value <0.05 was considered significant unless noted otherwise. 2way ANOVA was used to compare the tumor growth between treated and control group.
Disclosure of potential conflicts of interest
No potential conflicts of interest were disclosed.
Supp_files.zip
Download Zip (1.7 MB)Acknowledgments
We thank Dr. Carlo Selmi, Humanitas Research Hospital, Milan-Italy for providing us with RoActemra. We also thank Prof. Hemant Kocher, Queen Mary University London-UK for helpful suggestions during the study.
Funding
This work was supported by the Italian Association for Cancer Research (AIRC), grant 5 × 1000 (12182) Program “Molecular Clinical Oncology” to P. Allavena; grant AIRC IG (IG18443) to F. Marchesi and grant CARIPLO to C. Chiabrando. I. Siddiqui was a recipient of a Marie Curie fellowship from FP7 ITN (Program ATTRACT-238778). M. Erreni was supported by a fellowship from Fondazione Umberto Veronesi, Milano, Italy.
References
- Hanahan D, Weinberg RA. Hallmarks of cancer: the next generation. Cell. 2011;144:646–74. doi:10.1016/j.cell.2011.02.013. PMID:21376230
- Zhong Z, Sanchez-Lopez E, Karin M. Autophagy, inflammation, and immunity: a troika governing cancer and its treatment. Cell. 2016;166:288–98. doi:10.1016/j.cell.2016.05.051. PMID:27419869
- Coussens LM, Zitvogel L, Palucka AK. Neutralizing tumor-promoting chronic inflammation: a magic bullet? Science. 2013;339:286–91. doi:10.1126/science.1232227. PMID:23329041
- Elinav E, Nowarski R, Thaiss CA, Hu B, Jin C, Flavell RA. Inflammation-induced cancer: crosstalk between tumours, immune cells and microorganisms. Nat Rev Cancer. 2013;13:759–71. doi:10.1038/nrc3611. PMID:24154716
- Mantovani A, Marchesi F, Malesci A, Laghi L, Allavena P. Tumour-associated macrophages as treatment targets in oncology. Nat Rev Clin Oncol. 2017;14:399–416. doi:10.1038/nrclinonc.2016.217. PMID:28117416
- Mantovani A, Allavena P, Sica A, Balkwill F. Cancer-related inflammation. Nature. 2008;454:436–44. doi:10.1038/nature07205. PMID:18650914
- Siegel RL, Miller KD, Jemal A. Cancer Statistics, 2017. CA Cancer J Clin. 2017;67:7–30. doi:10.3322/caac.21387.
- Hruban RH. Pathology of genetically engineered mouse models of pancreatic exocrine cancer: consensus report and recommendations. Cancer Res. 2006;66:95–106. doi:10.1158/0008-5472.CAN-05-2168. PMID:16397221
- Matsuo Y, Campbell PM, Brekken RA, Sung B, Ouellette MM, Fleming JB, Aggarwal BB, Der CJ, Guha S. K-Ras promotes angiogenesis mediated by immortalized human pancreatic epithelial cells through mitogen-activated protein kinase signaling pathways. Mol Cancer Res. 2009;7:799–808. doi:10.1158/1541-7786.MCR-08-0577. PMID:19509115
- Guerra CC, Schuhmacher AJA, Cañamero MM, Grippo PJP, Verdaguer LL, Pérez-Gallego LL, Dubus PP, Sandgren EPE, Barbacid MM. Chronic pancreatitis is essential for induction of pancreatic ductal adenocarcinoma by K-Ras oncogenes in adult mice. Cancer Cell. 2007;11:12–2. doi:10.1016/j.ccr.2007.01.012.
- Sparmann A, Bar-Sagi D. Ras-induced interleukin-8 expression plays a critical role in tumor growth and angiogenesis. Cancer Cell. 2004;6:447–58. doi:10.1016/j.ccr.2004.09.028. PMID:15542429
- Garlanda C, Dinarello CA, Mantovani A. The interleukin-1 family: back to the future. Immunity. 2013;39:1003–18. doi:10.1016/j.immuni.2013.11.010. PMID:24332029
- Voronov E, Shouval DS, Krelin Y, Cagnano E, Benharroch D, Iwakura Y, Dinarello CA, Apte RN. IL-1 is required for tumor invasiveness and angiogenesis. Proc Natl Acad Sci USA. 2003;100:2645–50. doi:10.1073/pnas.0437939100. PMID:12598651
- Daniluk J, Liu Y, Deng D, Chu J, Huang H, Gaiser S, Cruz-Monserrate Z, Wang H, Ji B, Logsdon CD. An NF-κB pathway-mediated positive feedback loop amplifies Ras activity to pathological levels in mice. J Clin Invest. 2012;122:1519–28. doi:10.1172/JCI59743. PMID:22406536
- Huang H, Daniluk J, Liu Y, Chu J, Li Z, Ji B, Logsdon CD. Oncogenic K-Ras requires activation for enhanced activity. Oncogene. 2013;33:532–5.
- Ling J, Kang Y, Zhao R, Xia Q, Lee D-F, Chang Z, Li J, Peng B, Fleming JB, Wang H, et al. KrasG12D-induced IKK2/β/NF-κB activation by IL-1α and p62 feedforward loops is required for development of pancreatic ductal adenocarcinoma. Cancer Cell. 2012;21:105–20. doi:10.1016/j.ccr.2011.12.006. PMID:22264792
- Wang Z, Ali S, Banerjee S, Bao B, Li Y, Azmi AS, Korc M, Sarkar FH. Activated K-Ras and INK4 a/Arf deficiency promote aggressiveness of pancreatic cancer by induction of EMT consistent with cancer stem cell phenotype. J Cell Physiol. 2013;228:556–62. doi:10.1002/jcp.24162. PMID:22806240
- Hezel AF, Kimmelman AC, Stanger BZ, Bardeesy N, DePinho RA. Genetics and biology of pancreatic ductal adenocarcinoma. Genes Dev. 2006;20:1218–49. doi:10.1101/gad.1415606. PMID:16702400
- Kalluri R, Weinberg RA. The basics of epithelial-mesenchymal transition. J Clin Invest. 2009;119:1420–8. doi:10.1172/JCI39104. PMID:19487818
- Tsuji T, Ibaragi S, Hu G-F. Epithelial-mesenchymal transition and cell cooperativity in metastasis. Cancer Res. 2009;69:7135–9. doi:10.1158/0008-5472.CAN-09-1618. PMID:19738043
- Rhim AD, Mirek ET, Aiello NM, Maitra A, Bailey JM, McAllister F, Reichert M, Beatty GL, Rustgi AK, Vonderheide RH, et al. EMT and dissemination precede pancreatic tumor formation. Cell. 2012;148:349–61. doi:10.1016/j.cell.2011.11.025. PMID:22265420
- Rucki AA, Foley K, Zhang P, Xiao Q, Kleponis J, Wu AA, Sharma R, Mo G, Liu A, Van Eyk J, et al. Heterogeneous stromal signaling within the tumor microenvironment controls the metastasis of pancreatic cancer. Cancer Res. 2017;77:41–52. doi:10.1158/0008-5472.CAN-16-1383. PMID:27821486
- López-Novoa JM, Nieto MA. Inflammation and EMT: an alliance towards organ fibrosis and cancer progression. EMBO Mol Med. 2009;1:303–14. doi:10.1002/emmm.200900043. PMID:20049734
- Wu Y, Deng J, Rychahou PG, Qiu S, Evers BM, Zhou BP. Stabilization of snail by NF-kappaB is required for inflammation-induced cell migration and invasion. Cancer Cell. 2009;15:416–28. doi:10.1016/j.ccr.2009.03.016. PMID:19411070
- Lamouille S, Xu J, Derynck R. Molecular mechanisms of epithelial-mesenchymal transition. Nat Rev Mol Cell Biol. 2014;15:178–96. doi:10.1038/nrm3758. PMID:24556840
- Carbone C, Moccia T, Zhu C, Paradiso G, Budillon A, Chiao PJ, Abbruzzese JL, Melisi D. Anti-VEGF treatment-resistant pancreatic cancers secrete proinflammatory factors that contribute to malignant progression by inducing an EMT cell phenotype. Clin Cancer Res. 2011;17:5822–32. doi:10.1158/1078-0432.CCR-11-1185. PMID:21737511
- Suarez-Carmona M, Lesage J, Cataldo D, Gilles C. EMT and inflammation: inseparable actors of cancer progression. Mol Oncol. 2017;11:805–23. doi:10.1002/1878-0261.12095. PMID:28599100
- Khalafalla FG, Khan MW. Inflammation and epithelial-mesenchymal transition in pancreatic ductal adenocarcinoma: fighting against multiple opponents. Cancer Growth Metastasis. 2017;10:1179064417709287. PMID:28579826
- Mejlvang J, Kriajevska M, Vandewalle C, Chernova T, Sayan AE, Berx G, Mellon JK, Tulchinsky E. Direct repression of cyclin D1 by SIP1 attenuates cell cycle progression in cells undergoing an epithelial mesenchymal transition. Mol Biol Cell. 2007;18:4615–24. doi:10.1091/mbc.E07-05-0406. PMID:17855508
- Wan L, Pantel K, Kang Y. Tumor metastasis: moving new biological insights into the clinic. Nat Med. 2013;19:1450–64. doi:10.1038/nm.3391. PMID:24202397
- Morris JP, Wang SC, Hebrok M. KRAS, Hedgehog, wnt and the twisted developmental biology of pancreatic ductal adenocarcinoma. Nat Rev Cancer. 2010;10:683–95. doi:10.1038/nrc2899. PMID:20814421
- Rodriguez-Viciana P, Tetsu O, Oda K, Okada J, Rauen K, McCormick F. Cancer targets in the Ras pathway. Cold Spring Harb Symp Quant Biol. 2005;70:461–7. doi:10.1101/sqb.2005.70.044. PMID:16869784
- Lewis AM, Varghese S, Xu H, Alexander HR. Interleukin-1 and cancer progression: the emerging role of interleukin-1 receptor antagonist as a novel therapeutic agent in cancer treatment. J Transl Med. 2006;4:48. doi:10.1186/1479-5876-4-48. PMID:17096856
- Jonckheere N, Vasseur R, Van Seuningen I. The cornerstone K-RAS mutation in pancreatic adenocarcinoma: From cell signaling network, target genes, biological processes to therapeutic targeting. Critical Rev Oncol Hematol. 2017;111:7–19. doi:10.1016/j.critrevonc.2017.01.002.
- Collins MA, Brisset J-C, Zhang Y, Bednar F, Pierre J, Heist KA, Galbán CJ, Galbán S, di Magliano MP. Metastatic pancreatic cancer is dependent on oncogenic Kras in mice. PLoS One. 2012;7:e49707. doi:10.1371/journal.pone.0049707. PMID:23226501
- Xu W, Wang Z, Zhang W, Qian K, Li H, Kong D, Li Y, Tang Y. Mutated K-ras activates CDK8 to stimulate the epithelial-to-mesenchymal transition in pancreatic cancer in part via the Wnt/β-catenin signaling pathway. Cancer Letters. 2015;356:613–27. doi:10.1016/j.canlet.2014.10.008. PMID:25305448
- Tjomsland V, Spångeus A, Välilä J, Sandström P, Borch K, Druid H, Falkmer S, Falkmer U, Messmer D, Larsson M. Interleukin 1α sustains the expression of inflammatory factors in human pancreatic cancer microenvironment by targeting cancer-associated fibroblasts. Neoplasia. 2011;13:664–75. doi:10.1593/neo.11332. PMID:21847358
- Steele CW, Jamieson NB, Evans TRJ, McKay CJ, Sansom OJ, Morton JP, Carter CR. Exploiting inflammation for therapeutic gain in pancreatic cancer. Br J Cancer. 2013;108:997–1003. doi:10.1038/bjc.2013.24. PMID:23385734
- Piro G, Simionato F, Carbone C, Frizziero M, Malleo G, Zanini S, Casolino R, Santoro R, Mina MM, Zecchetto C, et al. A circulating T H2 cytokines profile predicts survival in patients with resectable pancreatic adenocarcinoma. OncoImmunology. 2017;6(9):e1322242. doi:10.1080/2162402X.2017.1322242. PMID:28932629
- Cataisson CC, Salcedo RR, Hakim SS, Moffitt BAB, Wright LL, Yi MM, Stephens RR, Dai R-MR, Lyakh LL, Schenten DD, et al. IL-1R-MyD88 signaling in keratinocyte transformation and carcinogenesis. J Exp Med. 2012;209:1689–702. doi:10.1084/jem.20101355. PMID:22908325
- Niu J, Li Z, Peng B, Chiao PJ. Identification of an autoregulatory feedback pathway involving interleukin-1alpha in induction of constitutive NF-kappaB activation in pancreatic cancer cells. J Biol Chem. 2004;279:16452–62. doi:10.1074/jbc.M309789200. PMID:14679213
- Zhang D, Li L, Jiang H, Knolhoff BL, Lockhart AC, Wang-Gillam A, DeNardo DG, Ruzinova MB, Lim K-H. Constitutive IRAK4 activation underlies poor prognosis and chemoresistance in pancreatic ductal adenocarcinoma. Clin Cancer Res. 2017;23:1748–59. doi:10.1158/1078-0432.CCR-16-1121. PMID:27702822
- Bang D, Wilson W, Ryan M, Yeh JJ, Baldwin AS. GSK-3α promotes oncogenic KRAS function in pancreatic cancer via TAK1-TAB stabilization and regulation of noncanonical NF-κB. Cancer Discovery. 2013;3:690–703. doi:10.1158/2159-8290.CD-12-0541. PMID:23547054
- Li C-W, Xia W, Huo L, Lim S-O, Wu Y, Hsu JL, Chao C-H, Yamaguchi H, Yang N-K, Ding Q, et al. Epithelial-mesenchymal transition induced by TNF-α requires NF-κB-mediated transcriptional upregulation of Twist1. Cancer Res. 2012;72:1290–300. doi:10.1158/0008-5472.CAN-11-3123. PMID:22253230
- Pettersson AT, Laurencikiene J, Mejhert N, Näslund E, Bouloumié A, Dahlman I, Arner P, Rydén M. A possible inflammatory role of twist1 in human white adipocytes. Diabetes. 2010;59:564–71. doi:10.2337/db09-0997. PMID:20007935
- Qin Q, Xu Y, He T, Qin C, Xu J. Normal and disease-related biological functions of Twist1 and underlying molecular mechanisms. Cell Res. 2012;22:90–106. doi:10.1038/cr.2011.144. PMID:21876555
- Holmer R, Goumas FA, Waetzig GH, Rose-John S, Kalthoff H. Interleukin-6: a villain in the drama of pancreatic cancer development and progression. HBPD INT. 2014;13:371–80. PMID:25100121
- Lesina M, Kurkowski MU, Ludes K, Rose-John S, Treiber M, Klöppel G, Yoshimura A, Reindl W, Sipos B, Akira S, et al. Stat3/Socs3 activation by IL-6 transsignaling promotes progression of pancreatic intraepithelial neoplasia and development of pancreatic cancer. Cancer Cell. 2011;19:456–69. doi:10.1016/j.ccr.2011.03.009. PMID:21481788
- Dinarello CA. Why not treat human cancer with interleukin-1 blockade? Cancer Metastasis Rev. 2010;29:317–29. doi:10.1007/s10555-010-9229-0. PMID:20422276
- Jones SA, Scheller J, Rose-John S. Therapeutic strategies for the clinical blockade of IL-6/gp130 signaling. J Clin Invest. 2011;121:3375–83. doi:10.1172/JCI57158. PMID:21881215
- Carbone C, Melisi D. NF-κB as a target for pancreatic cancer therapy. Expert Opin Ther Targets. 2012;16Suppl 2:S1–10. doi:10.1517/14728222.2011.645806. PMID:22443181
- Apte RN, Voronov E. Immunotherapeutic approaches of IL-1 neutralization in the tumor microenvironment. J Leukoc Biol. 2017;102(2):293–306 doi:10.1189/jlb.3MR1216-523R. PMID:28522598
- Arpin CC, Mac S, Jiang Y, Cheng H, Grimard M, Page BDG, Kamocka MM, Haftchenary S, Su H, Ball DP, et al. Applying small molecule signal transducer and activator of Transcription-3 (STAT3) Protein inhibitors as pancreatic cancer therapeutics. Mol Cancer Ther. 2016;15:794–805. doi:10.1158/1535-7163.MCT-15-0003. PMID:26873728
- Lesina M, Wörmann SM, Morton J, Diakopoulos KN, Korneeva O, Wimmer M, Einwächter H, Sperveslage J, Demir IE, Kehl T, et al. RelA regulates CXCL1/CXCR2-dependent oncogene-induced senescence in murine Kras-driven pancreatic carcinogenesis. J Clin Invest. 2016;126:2919–32. doi:10.1172/JCI86477. PMID:27454298
- Zhuang Z, Ju H-Q, Aguilar M, Gocho T, Li H, Iida T, Lee H, Fan X, Zhou H, Ling J, et al. IL1 receptor antagonist inhibits pancreatic cancer growth by abrogating NF-κB activation. Clin Cancer Res. 2016;22:1432–44. doi:10.1158/1078-0432.CCR-14-3382. PMID:26500238
- Peters AHFM, Kubicek S, Mechtler K, O'Sullivan RJ, Derijck AAHA, Perez-Burgos L, Kohlmaier A, Opravil S, Tachibana M, Shinkai Y, et al. Partitioning and plasticity of repressive histone methylation states in mammalian chromatin. Mol Cell. 2003;12:1577–89. doi:10.1016/S1097-2765(03)00477-5. PMID:14690609