
ABSTRACT
The immune environment of primary tumor is associated with the clinical response and benefit of immunotherapy. This study aims to investigate the intratumoral immune profile and its clinical relevance in advanced head and neck squamous cell carcinoma (HNSCC). Gene expression profiles of 401 HNSCCs at stage III-IVB from two cohorts (The Cancer Genome Atlas, TCGA, n = 203; the Leipzig Head and Neck Group, LHNG, n = 198) were involved in this analysis. Based on the global immune-related genes, four gene expression subtypes (C1-4) were identified in HNSCCs. Overall, subtypes C2 and C3 showed upregulation of immune profiles and increased tumor lymphocyte infiltration, exhibiting an enhanced immune microenvironment (EIME). However, the two EIME subtypes revealed differences in immune markers and clinical features. Subtype C2 showed higher expression of macrophage signature, whereas subtype C3 was more associated with B cell infiltration. T cell and NK cell infiltration was not different between C2 and C3 subtypes. The subtype C2 tumors were characterized by inflammation compared with subtype C3. Although the checkpoint receptors PD1 and CTLA4 expressed equally between the EIME subtypes, their ligands (PD-L1/PD-L2, CD86/CD80) were significantly upregulated in subtype C2 compared with C3. HPV-positive tumors were predominantly enriched in subtype C3 but not in C2. Furthermore, patients in subtype C2 had a worse outcome than those in C3. In summary, two immune-enhanced subtypes with different immune characteristics and clinical features were identified in advanced HNSCC. The different immune microenvironments among HNSCC subgroups may provide new insights into the strategy of immunotherapy.
Introduction
Head and neck squamous cell carcinoma (HNSCC) is the eighth most common malignancy for males in the United States.Citation1 Stage III/IV tumors are the major subgroups for HNSCC. The prognosis of patients at stage III/IV is dissatisfactory, with 5-year relapse-free survival (RFS) and overall survival (OS) of 40% and 60%, respectively.Citation2 Surgical resection followed by adjuvant irradiation or chemoradiotherapy is the common treatment for resectable HNSCC at late stage.Citation2 Postoperative radiotherapy and chemoradiotherapy improve locoregional control initially, but with a long-term local and distant failure rate of 50% and 15%, respectively.Citation3 Therefore, novel therapeutic strategies in monotherapy or in combination with traditional treatments are required to improve outcome of primary HNSCC at late stage.
Recently, much attention has been paid to immunotherapy in the field of cancer treatment. The monoclonal antibodies (mAb) targeting the immune checkpoint pathways have been approved for the treatment of metastatic melanoma and non-small cell lung cancer.Citation4 HNSCC is characterized by several alterations in the immune system, making it possible that these patients may benefit from immunotherapy. Indeed, the anti-PD1 mAb (pembrolizumab and nivolumab) has been demonstrated to improve clinical outcome for platinum refractory recurrent/metastatic HNSCC.Citation5,6 Other ongoing clinical trials are designed to evaluate the efficacy of pembrolizumab in biomarker-unselected or platinum- and cetuximab-refractory recurrent/metastatic HNSCC with promising results.Citation7,8 However, little is known about the usefulness of immunotherapy in primary advanced HNSCC. We propose that a better understanding of the immune microenvironment of the primary tumors may provide new insights into the immunotherapy of HNSCC.
Immune processes play critical roles in carcinogenesis and progression of solid tumors. It is considered that the nascent transformed cells can be initially eliminated by the host immune system based on both innate and adaptive immunity.Citation9,10 The destroyed cells release various tumor antigens that further stimulate an adaptive immunity, e.g., activated T cells and B cells. In a later stage, multiple mechanisms have been developed by cancer cells to escape from the immune surveillance. For example, cancer cells secrete soluble cytokines or chemokines, which can recruit suppressive cells such as regulatory T cells (Tregs) and myeloid-derived suppressor cells into the tumor microenvironment. The costimulatory or coinhibitory signals are co-opted by tumors in regulating the activation of T cells. The PD1 signaling contributes to a suppressive effect on T cells. The ligands CD86/CD80 can act as either costimulatory or coinhibitory effectors, depending on their ligation to CD28 or CTLA4 respectively.Citation11 Upregulation of these checkpoint molecules on cancer cells or stromal cells leads to an immunosuppressive tumor microenvironment.Citation12 Immunotherapy agents targeting coinhibitory receptors (PD1 and CTLA4) can increase immune response by inhibiting the immunosuppressive mechanisms, and provide excellent therapeutic benefit in several cancers.Citation4,12 The expression pattern and potential clinical relevance of immune checkpoint molecules in HNSCC remain unclear so far.
HPV infection has been established as a cause of HNSCC, especially for tumors of the oropharynx (approximately 45.8% of oropharyngeal cancer were HPV positive).Citation13 HPV-positive tumors are associated with high responsiveness to chemotherapy and chemoradiotherapy and have improved outcomes in HNSCC patients.Citation14 A recent study showed that the HPV-positive tumors were enriched in the HNSCC subtype with high immune response.Citation15 For the platinum refractory recurrent/metastatic HNSCC, HPV-positive status is associated with a favorable outcome when receiving anti-PD1 mAb treatment.Citation16 The relationship between immune landscape and HPV status must be uncovered for primary III/IV HNSCC.
This study aimed to investigate the overall immune landscape and its clinical relevance in HNSCC at stage III-IVB. From The Cancer Genome Atlas (TCGA) cohort, we identified four consensus molecular subtypes of tumors based on the gene expression of global immune genes. The four subtypes were further validated in an external cohort from the Leipzig Head and Neck Group (LHNG). Two subtypes were characterized as upregulation of a series of immune markers. Moreover, the two subtypes also showed remarkable differences in terms of HPV status and expression of checkpoint genes as well as patient outcomes.
Results
Identification of molecular subtypes of HNSCC based on immune profiles
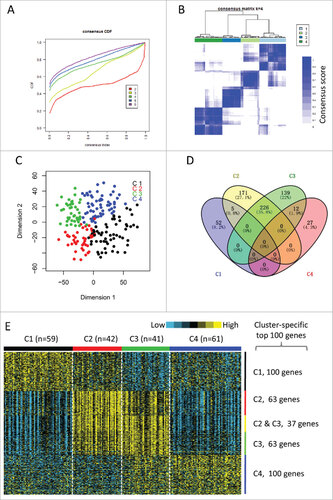
The gene expression profiles of 1703 immune-related genes were used to identify the HNSCC subtypes in TCGA cohort. All tumor samples were firstly grouped into k (k = 2, 3, 4, 5, 6) different subtypes using Consensus Cluster Plus. According to the cumulative distribution function curves of the consensus score, the optimal division was achieved when k = 4 (, supplementary Fig. 1). The four clusters of samples were separated from each other on the two-dimensional scaling plotting (). In addition, SigClust analysis also demonstrated that the consensus clusters (k = 4) were significant in all pairwise comparisons (supplementary Table 2). Thus, the HNSCC tumors were finally classified into four molecular subtypes based on the global immune gene expression (C1, n = 59; C2, n = 42; C3, n = 41; C4, n = 61).
Figure 1. Identification of immune-related subtypes of HNSCCs in TCGA cohort. (A) The cumulative distribution function (CDF) curves in consensus cluster analysis. CDF curves of consensus scores by different subtype number (k = 2, 3, 4, 5, 6) were represented. (B) The consensus score matrix of all samples when k = 4. A higher consensus score between two samples indicates they are more likely to be grouped into the same cluster in different iterations. (C) Two-dimensional scaling plot by expression profile of global immune genes. Each point represents a single sample, with different colors indicating the four subtypes. (D) Venn diagram of the overlapping of genes across four subtypes. The upregulated genes for each subtype were calculated by unpaired t-test, with FDR < 0.01 and fold change > 2 as the cutoff. (E) Gene expression profile of the top 100 featured genes which were specifically upregulated in each subtype. Heat map indicates relative gene expression value, with yellow for high expression and cyan for low expression.
The distributions of conventional clinical variables among the four molecular subtypes are summarized in . The association between anatomic tumor site and four subtypes was significant (χ2 test, FDR < 0.001). Tumors of oropharynx were enriched in C3 subtype, the laryngeal tumors were more likely to be characterized as C3 and C4 subtypes. A significant HPV-positive rate was observed in C3 subtype (47.4%, 9/19), compared with other subtypes (C1, 0/9; C2, 1/10; C4, 3/16) (χ2 test, FDR = 0.01). In addition, subtype C3 tended to have higher histological grade that other subtypes (χ2 test, FDR = 0.025). All other clinical parameters did not achieve statistical significance ().
Table 1. Association of four molecular subtypes with clinical parameters in TCGA cohort.
Two subtypes were characterized as enhanced immune microenvironment
The upregulated genes in each subtype compared with other subtypes were calculated by unpaired t-test (FDR < 0.01, fold change > 2). Of the 1,706 immune genes, 57 genes, 402 genes, 377 genes, and 39 genes were significantly upregulated in subtypes C1, C2, C3, and C4, respectively (). Notably, there were 226 genes overlapped between subtypes C2 and C3. However, only a few genes overlapped between other pairs of subtypes (). We selected the top 100 upregulated genes of each subtype as the featured genes as previously describedCitation17 (). Again, subtypes C2 and C3 shared a highly similar gene expression pattern with 37 overlapped featured genes. The remarkably large number of immune genes upregulated in subtypes C2 and C3 indicates an enhanced immune profile in the two subtypes.
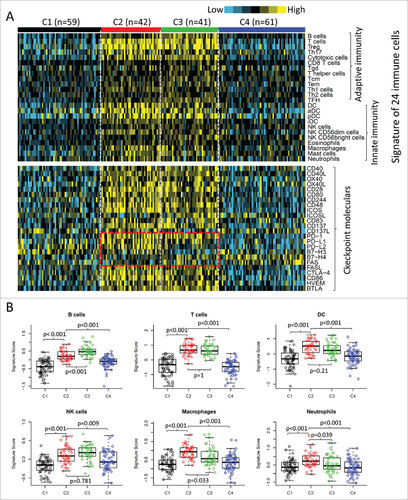
We also examined the expression signatures of 24 different types of immune cells.Citation18 Overall, most of the immune signatures were upregulated in subtypes C2 and C3 than in subtypes C1 and C4 (, upper panel). The upregulated pattern was observed for signatures of both innate and adaptive immunity. This was consistent with the observation of a relatively higher intratumoral lymphocyte infiltration in C2 and C3 subtypes (Supplementary Fig. 2A). Further analysis indicated a positive correlation between most of the immune signatures and lymphocyte infiltration (Supplementary Fig. 2B). Collectively, the high expression of immune profiles and increased infiltrates suggested an enhanced immune microenvironment (EIME) in subtypes C2 and C3.
Figure 2. Immune profiles of the four subtypes in TCGA cohort. (A) The gene expression scores of 24 immune signatures across four subtypes are displayed in the upper panel. The lower panel indicates the expression profile of costimulatory/coinhibitory molecules. Heat map indicates relative gene expression value, with yellow for high expression and cyan for low expression. (B) The expression scores of signatures of six immune cells in four HNSCC subtypes. Boxplots indicate 5%, 25%, 50%, 75%, and 95%, respectively. Comparisons between subtypes were performed by Student's t-test. All p values were corrected by the Bonferroni method. The adjusted value of p < 0.05 was considered significant.
Differential levels of specific immune cell markers as well as checkpoint signalings between subtypes C2 and C3
Although subtypes C2 and C3 showed high immune levels compared with subtypes C1 and C4, they were significantly different in the consensus cluster analysis (). There was no expression difference between subtypes C2 and C3 for several immune markers, such as T cells, Tregs, and NK cells (, Supplementary Fig. 3). The expression signatures of B cells, T helper cells and central memory T cells (Tcm) were significantly higher in subtype C3 than those in subtype C2 (, Supplementary Fig. 3). On the other hand, subtype C2 showed upregulated signatures of macrophages, neutrophils, Th1 cells, and immature dendritic cells (iDC), compared with subtype C3 (, Supplementary Fig. 3). The immune profiles were also validated by using the MCP-counter (Supplementary Fig. 4). Many of the immune patterns by MCP-counter were consistent with that described above, such as B cells, T cells and NK cells. We also found that the monocytic lineage were significantly upregulated in subtype C2 compared with C3. However, the difference of neutrophils was not significant between subtype C2 and C3 by MCP-counter (Supplementary ).
Figure 3. Differential expression of checkpoint molecules in HNSCC subtypes in TCGA cohort. The gene expression value of eight checkpoint molecules were presented across four subtypes. Boxplots indicate 5%, 25%, 50%, 75%, and 95%, respectively. Comparisons between subtypes were performed by Student t-test. All p values were corrected by the Bonferroni method. The adjusted value of p < 0.05 was considered significant.
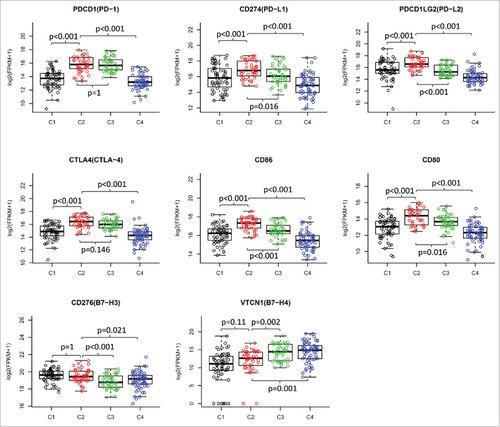
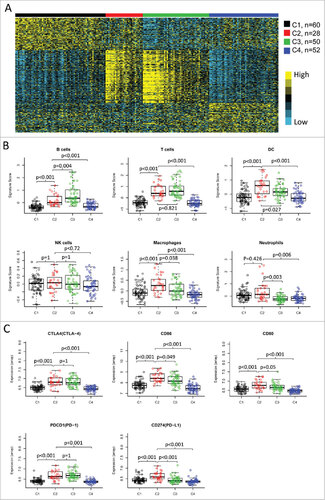
Figure 4. Validation of the four immune-related subtypes in the LHNG cohort. (A) Gene expression profile of the top 100 featured genes in the LHNG cohort. The subtypes (columns) were assigned by the centroids of TCGA cohort. Heat map indicates relative gene expression value, with yellow for high expression and cyan for low expression. B and C. The expression value of immune signatures (B) and checkpoint molecules (C) among subtypes in the LHNG cohort. Boxplots indicate 5%, 25%, 50%, 75%, and 95%, respectively. Comparisons between subtypes were performed by Student's t-test. Multiple testing was corrected by the Bonferroni method. The adjusted value of p < 0.05 was considered significant.
We then investigated the expression of immune checkpoint genes, which play a critical role in T cell regulation. Similar to the immune cell signatures, most of the checkpoint genes were upregulated in the two subtypes with EIME (C2 and C3) (, lower panel). However, some of the checkpoint molecules showed differential expression between the two subtypes. The immune checkpoint receptors, such as PD1 and CTLA4, were equally expressed in tumors between subtypes C2 and C3 (). However, the corresponding ligands (PD-L1/PD-L2 for PD1 and CD86/CD80 for CTLA4) were significantly higher in subtype C2 compared with subtype C3 (). B7H3 and B7H4 were recently identified as checkpoint molecules. We found that B7H3 was dramatically downregulated while B7H4 was upregulated in subtype C3, compared with subtype C2 ().
Validation of four molecular subtypes in the LHNG cohort
The four subtypes identified in TCGA cohort were further validated in an external cohort of LHNG, using a nearest-centroid classifier (). The four subtypes classified by our method were strongly correlated with the sample clusters identified by Wichmann et alCitation15 (χ2 test, FDR < 0.001, ). The previously identified immune response cluster was remarkably enriched in our subtype C3 (45/50, 90%), but not in other subtypes (C1, 0/68; C2, 6/28; C4, 11/52). Moreover, subtype C3 were enriched for HPV-positive tumors (28/50, 56%; χ2 test, FDR = 0.003), especially for tumors with DNA+/RNA+ of HPV16 (22/50, 44%; χ2 test, FDR < 0.001) (). The four subtypes in the LHNG cohort were also associated with T stage (χ2 test, FDR = 0.039) and N stage (χ2 test, FDR = 0.056) ().
Table 2. Association of four molecular subtypes with clinical parameters in the LHNG cohort.
Consistent with TCGA cohort, two subtypes (C2 and C3) in the LHNG cohort were characterized as high expression of various immune signatures (). However, subtype C2 was preferentially associated with macrophages, neutrophils, iDCs and Th1 cells (, Supplementary Fig. 5). Subtype C3 showed higher expression of signatures of B cells, CD8+ T cells, T helper cells as well as Tcm than C2 (, Supplementary Fig. 5). The expression patterns of B cells, T cells and CD8+ T cells had been confirmed by the MCP-counter (Supplementary Fig. 6). Moreover, the MCP-counter score of monocytic lineage was significantly higher in subtype C2 than that in C3 (Supplementary Figure 6). These observations in the LHNG cohort were greatly consistent with TCGA cohort.
Figure 5. Expression pattern of non-immune stromal cell signatures and inflammatory chemokine signature. The MCP-counter score of endothelial cells (left column) and fibroblasts (middle column), and the expression value of chemokine signature (right column) were presented across four HNSCC subtypes. The data of TCGA cohort (upper row) and the LHNG cohort (lower row) was shown respectively. Boxplots indicate 5%, 25%, 50%, 75%, and 95%, respectively. Comparisons between subtypes were performed by Student t-test. All p values were corrected by the Bonferroni method. The adjusted value of p < 0.05 was considered significant.
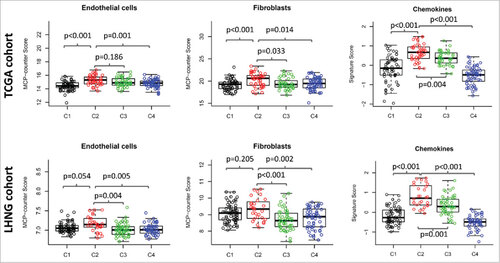
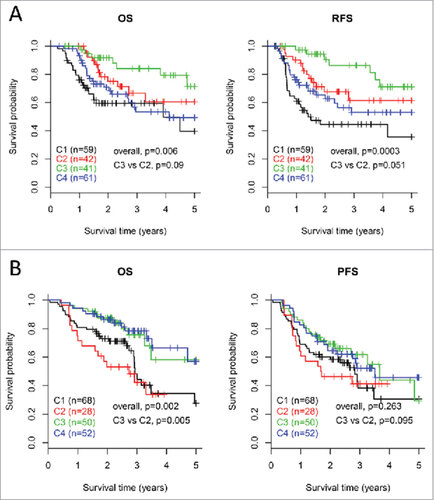
Figure 6. Survival analysis for the four subtypes of HNSCCs. Kaplan-Meier curves show the distinct outcome of patients in the four subtypes respectively. The p value was calculated by the log-rank test, by comparing the overall four subtypes together or subtype C3 versus subtype C2 only. Results are represented for TCGA cohort (A) and the LHNG cohort (B), respectively.
In the LHNG cohort, the checkpoint receptors CTLA4 and PD1 were equally expressed in subtypes C2 and C3, with higher levels compared with subtypes C1 and C4 (). However, the ligands CD86/CD80 and PD-L1 were significantly upregulated in subtype C2 compared with subtype C3 (). The expression value of PD-L2, another ligand for PD1, was not detected in the LHNG dataset. In addition, B7H3 was significantly decreased, but B7H4 was increased in the subtype C3 compared with C2 (). Again, these findings were consistent with those in TCGA cohort.
Expression pattern of non-immune stromal cell signatures and inflammatory chemokines
We examined the expression of two non-immune stromal cells, endothelial cells and fibroblasts, by using the MCP-counter. The expression score of endothelial cells were upregulated in subtype C2 compare with C3 in the LHNG cohort, but the significance was not achieved in TCGA cohort (, left column). The markers of fibroblasts were significantly higher in subtype C2 than C3 in both cohorts (, middle column). In addition, we investigated the inflammatory chemokine signature identified from melanoma in our HNSCC subtypes. Overall, the expression score of the inflammatory signature was enhanced in the two EIME subtypes compared with C1 and C4 subtypes in both cohorts. Furthermore, a higher expression of inflammatory chemokines was observed in subtype C2 than in C3 (, right column).
Angiogenesis related genes were reported as prognostic factors in colorectal cancers with high expression of lymphocyte-derived cytotoxic protein.Citation19 We then studied three angiogenesis related genes VEGFA, PDGFA and FGF1 across the four molecular subtypes. There was no remarkable difference for the angiogenesis related genes between subtypes C2 and C3, except that the expression of PDGFA was upregulated in subtype C2 than C3 in the LHNG cohort (Supplementary Figure 7).
Prognostic significance of the four molecular subtypes
On the basis of differential expression of immune profiles, we sought to know whether the four subtypes reflect distinct clinical outcome of patients. In TCGA cohort, Kaplan-Meier curves showed significantly different OS and RFS rates of patients in the four subtypes (log-rank test, OS, p = 0.006; RFS, p = 0.0003, ). Patients in subtype C3 demonstrated the best outcome out of the four subtypes based on both OS and RFS. Particularly, for the two EIME subtypes, subtype C2 was associated with a trend toward poorer patient outcome (log-rank test, OS, p = 0.09; RFS, p = 0.051) than subtype C3.
For the LHNG cohort, the OS rates of patients in the four subtypes were significantly different (log-rank test, OS, p = 0.002, ). For the two EIME subtypes, patients in subtype C3 had remarkably better OS than those in C2 (log-rank test, p = 0.005). The PFS results indicated a similar trend with that of OS, but the significance was not achieved.
Discussion
In this study, we identified four gene expression subtypes based on global immune genes in stage III-IVB HNSCCs in TCGA cohort. The subtypes were also validated in an external cohort of LHNG. Two of the four subtypes showed significant higher expression of a series of immune markers. However, the two high-immune subtypes were different in terms of specific immune markers (immune cell types, inflammatory chemokines and checkpoint molecules) and clinical features (HPV infection and patient outcome). These findings may provide some new insight into the strategy of immunotherapy of primary advanced HNSCCs.
Previous studies have reported some molecular subtypes of HNSCCs mainly based on the genome wide profiles.Citation15,20,21 In our analysis, we focused only on the global immune profiles, which could provide more details about the immune landscape of HNSCC. Among the four molecular subtypes, the overall immune profiles of subtypes C2 and C3 were significantly higher than that of subtypes C1 and C4. The two subtypes also showed increased tumor lymphocyte infiltration rate, which was positively correlated with expression signatures of several types of immune cells. These findings suggest that subtypes C2 and C3 were associated with an enhanced immune status in the tumor microenvironment, which was termed as EIME. Although subtypes C1 and C4 were characterized with lower expression of immune profiles, they were different from each other depending on several aspects. Firstly, subtype C1 and C4 were separated from each other on the 2-dimentional plotting based on global immune profiles (). Secondly, there was no overlapping of genes upregulated in the two subtypes (). Thirdly, a larger proportion of larynx tumors were enriched in C4 than C1 (TCGA cohort, 32.8% vs 10.2%, ; LHNG cohort, 23.1% vs 11.8%, ). A higher proportion of ‘G1’ grade tumors were observed in subtype C1 than C4 (18.6% vs 8.2%, ). Moreover, subtype C1 exhibited an higher enrichment in mesenchymal subtype than C4 (55.9% vs 11.5%), but subtype C4 were more related with the classical subtype than C1 (32.7% vs 1.5%) ().
Wichmann et alCitation15 reported a molecular subtype of ‘immune response’, which was significantly overlapped with our C3 subtype. Recently, an inflamed phenotype was identified in HNSCCs using a chemokine signature of metastatic melanoma.Citation22 The chemokine signature was upregulated in our EIME subtypes, with an even higher expression in C2 subtype (, right column). Both the ‘immune response’ subtype and the inflamed phenotype were reported to be enriched in HPV-positive tumors.Citation15,22 However, in our EIME subtypes, only subtype C3 but not subtype C2 showed a strong correlation with HPV infection. These results indicated that two distinct immune phenotypes exist in HNSCC, which may reflect HPV-dependent or -independent mechanisms, respectively.
We found that the two EIME subtypes were quite different in terms of specific immune cell types. Subtype C2 was more likely to be correlated with markers of cells involved in innate immunity, such as macrophages, iDCs, and monocytes. The gene expression signatures of adaptive immune response cells, such as B cells, T helper cells as well as Tcm, were significantly higher in subtype C3 than subtype C2. The higher expression of adaptive immunity–related markers in subtype C3 may be partially due to the enrichment of HPV-positive tumors in subtype C3. A high level of adaptive immune response was associated with HPV infection in HNSCC.Citation23 These data again suggest that HNSCC contains at least two immune environments, which may reflect innate immunity and adaptive immunity respectively. Immunity type and specific immune cell markers may provide more details about the immune microenvironment of HNSCC.
Inflammation is common in tumor microenvironment, and contributes to tumorigenesis and cancer progression.Citation24 The proinflammatory cytokines and chemokines can be secreted by cancer cells or stromal cells, such as macrophages and fibroblasts.Citation24–26 We found that the inflammatory chemokine signature was significantly higher in subtype C2 than in C3. Consistently, the expression of markers for macrophages and fibroblasts was upregulated in subtype C2 in both cohorts. Moreover, we found a higher content of monocytic lineage infiltration in subtype C2 than C3. Previous studies reported that the cancer associated fibroblasts and macrophages were associated with unfavourable prognosis in HNSCC patients.Citation25,27–29 A recent study found that high count of pretreatment peripheral monocytes was an independent factor for poor prognosis in HNSCCs.Citation30 All together, the inflammatory phenotype with higher infiltration of macrophages, fibroblasts and monocytes, may partially contribute to the bad prognosis of patients in subtype C2 than those in C3. Otherwise, the inflammatory microenvironment may also contribute to immunosuppression, because of that the expression of PD-L1 was correlated with an inflammatory phenotype in HNSCC.Citation22,31
Indeed, we found that the immune checkpoint signalings differ between the two EIME subtypes. Previous studies have identified HNSCC subtype with high immune response along with upregulation of checkpoint molecules.Citation22,32 Consistently, the overall expression of checkpoint molecules was elevated in our EIME subtypes (). The checkpoint receptors are expressed on activated immune cells to prevent overabundant immune response.Citation16 We found that PD1 and CTLA4 were equally expressed in subtypes C2 and C3, which was consistent with the similar infiltration rate of lymphocytes. However, subtype C2 was preferentially associated with higher expression of the ligands (PD-L1/PD-L2 for PD1 and CD86/CD80 for CTLA4). The ligation of CD86/CD80 to the costimulatory receptor CD28 trigers the activation of T cells. The subsequent upregulation of CTLA4 on activated T cells competitively bind to CD86/CD80 to prevent overabundant immune response.Citation11 Previous studies have suggested that CD86 acts as a tumor suppressor expressed on non-cancer cells, such as macrophages and NK cells.Citation33–36 In our results, the expression signature of macrophage was significantly upregulated in subtype C2 compared with C3. We found a high correlation between CD86/CD80 expression and the macrophage signature (Supplementary Figure 8). Therefore, it is possible that the upregulation of CD86/CD80 in subtype C2 is a sign of higher macrophage infiltration. However, the elevated CTLA4 may preferentially bind to CD86/CD80 with a higher affinity than CD28,Citation11 resulting in an immunosuppressive environment. The correlation of PD-L1/PD-L2 with macrophage signature was somewhat weaker (Supplementary Figure 8), suggesting that PD-L1/PD-L2 may express on both immune cells and cancer cells. In fact, overexpression of PD-L1 and/or PD-L2 on tumor cells was observed in many cancers including HNSCC.Citation37,38 These observations collectively suggest a more immunosuppressive microenvironment existing in subtype C2. This notion was supported by survival analysis that showed a worse prognosis of patients in subtype C2 than those in subtype C3. Therefore, we presumed that the patients in subtype C2 may derive more clinical benefit from checkpoint pathway blockade.
Th1 cells regulate cytotoxic immune response and contribute to tumor suppression. Previous studies reported that higher expression of Th1 related genes in tumor microenvironment was correlated with better prognosis in cancer patients.Citation18,39 Surprisingly, we found that the Th1 signature was significantly upregulated in the C2 subtype with a bad outcome. However, the biological mechanism underlying this observation is unclear and needs further investigation. The cytotoxic CD8+ T cells suppress tumor growth and improve patient survival in many cancers.Citation40 However, it seems to remain a debate on the prognostic value of CD8+ T cell infiltration in HNSCC. CD8+ T cell infiltration was responsible for the antitumor effect of cancer vaccine against HNSCC.Citation40 High infiltration of tumors by CD8+ T cells correlated with a favourable prognosis in HNSCCs following definitive chemoradiotherapy.Citation41 Although HPV+ HNSCCs were highly infiltrated by T cells, the high content of CD8+ cells could not predict a better outcome in these patients.Citation41,42 Another study showed that the prognostic value of CD8+ infiltration was only observed in HNSCCs at low risk, but not found in the late-stage subgroup.Citation43 In our results, the CD8+ T cell signature were upregulated in subtype C3 compared with C2 in the LHNG cohort, but the significance was not achieved in TCGA cohort. These data suggested that the prognostic value of CD8+ infiltration in HNSCCs is far more complex than previously expected. The HPV status, tumor stage, and the localization of infiltration in tumors may affect the prognostic value of CD8+ T cells.Citation41–43
The four molecular subtypes were correlated with distinct patient outcome in both cohorts. For the two EIME subtypes, prognosis of patients in subtype C3 was consistently better than those in subtype C2 in both cohorts. However, the non-EIME subtypes (especially subtype C4) showed different prognostic results between the two cohorts. One potential reason is that the distributions of tumor sites for the two cohorts are quite different (Supplementary Table 1). The TCGA cohort contains 64.5% (131/203) of tumors of the oral cavity, whereas the proportion is only 27.8% (55/198) in the LHNG cohort. When considering only the non-oral cavity tumors, the survival patterns of the four subtypes were more similar between the two cohorts (Supplementary Figure 9). Another explanation is that the patients in the two cohorts were underwent different treatments, which affects clinical outcome significantly.
In conclusion, using the gene expression profile of global immune genes, we identified two EIME subtypes in primary advanced HNSCC. The two subtypes were distinct in terms of HPV status, immunity features, and immune checkpoint molecules as well as patient outcomes. These findings of the intratumoral immune microenvironment may shed new light on the strategy of immunotherapy in advanced HNSCC.
Materials and methods
Patients and clinical characteristics
The gene expression profiles and clinical information of 528 primary HNSCCs by surgery resection were obtained from TCGA. This study analyzed 203 patients from this entire cohort with the following criteria: a) without any neoadjuvant therapy; b) at pTNM stage of III-IVB; c) receiving postoperative radiotherapy or chemoradiotherapy before any recurrence or metastasis occurs; d) with follow-up information; e) with gene expression profiles of the primary tumor. Clinical characteristics of TCGA cohort were summarized in Supplementary Table 1. HPV status was determined by p16 testing or HPV in situ hybridization. OS and RFS (locoregional or distant recurrence after surgery treatment) were available for TCGA cohort.
The external validation cohort is a subset of 270 HNSCCs collected by the LHNG.Citation15 Only 198 primary HNSCCs at stage III-IVB were included in our analysis. HPV status of the LHNG cohort is determined by HPV DNA genotyping, as well as DNA and RNA test of HPV16 as described previously.Citation15 OS and progression-free survival (PFS) information was available for the LHNG cohort. Clinical characteristics of this cohort were summarized in Supplementary Table 1. There was no difference in most of the clinical parameters between TCGA cohort and the LHNG cohort. There was one exception that a larger proportion of oropharyngeal tumors and smaller ratio of oral cavity tumors were enrolled in the LHNG cohort (Supplementary Table 1).
Gene expression data processing
For TCGA cohort, the RNA-seq data was profiled by the next-generation sequencing platform of Illumina®. The fragments per kilobase of gene per million fragments mapped with upper quartile normalization (FPKM-uq) were downloaded from TCGA Data Portal. Gene annotation was performed with the Ensembl database. The gene expression value was log2-transformed for subsequent analysis. The gene expression profiles of LHNG cohort were analyzed by Illumina® HT12 v4 Expression BeadChips.Citation15 The normalized expression data and corresponding clinical information were downloaded from Gene Expression Omnibus (GEO) (GSE65858). Probe annotations of BeadChips were obtained from the GEO database. Entrez Gene IDs were used for mapping gene expression data between the two cohorts.
Identification of molecular subtypes of HNSCC by immune genes
The gene expression profile of global immune genes in TCGA cohort was used to identify the HNSCC subtypes. Immune-related genes were extracted from the Gene Ontology (GO) database by searching the immune/inflammation/defense related GO terms, resulting in 139 GO terms with 1,939 genes. The genes with no expression (FPKM = 0) in more than 80% of samples were excluded. The remaining 1,706 immune genes were used for Consensus Cluster Plus analysis.Citation44 Gene expression data were median centered. The clustering program was performed with 1,000 iterations, by sampling 80% of samples at each iteration. The optimal cluster number was determined by cumulative distribution function curves of the consensus score. Pairwise comparisons among identified subtypes were performed by SigClust analysis.Citation45 Bonferroni correction was used for multiple testing.
For each subtype, the featured genes were calculated by comparing the samples in this subtype with the remained samples using Student's t-test. We selected the top 100 upregulated genes in each subtype to distinguish the different molecular subtypes, as suggested in a previous study.Citation17 False discovery rate (FDR) was calculated using the Benjamini-Hochberg method.
Immune profiles in HNSCC molecular subtypes
The expression signatures over 24 types of immune cells were obtained from a previous study by Bindea et al.Citation18 A signature with 12 chemokines identified in metastatic melanoma was recently used to identify an inflamed phenotype of HNSCCs.Citation22 This chemokine signature was also analyzed in our study. Expression score of a given signature in each tumor sample was calculated by averaging the z-normalized expression value of the signature genes. The immune profiles were also validated by the MCP-counter, an estimator for abundance of tissue-infiltrating cells by gene expression profiles.Citation46 The MCP-counter score was calculated by using the R package ‘MCPcounter’.Citation46 The costimulatory or coinhibitory molecules were analyzed across the molecular subtypes. Immune signature scores and expression value of checkpoint genes were compared between different HNSCC subtypes by Student's t-test. The association between subtypes and the tumor lymphocyte infiltration rate (%) was assessed using the Mann-Whitney U test. Bonferroni correction was used for multiple testing.
Validation the molecular subtypes in LHNG cohort
To validate the molecular subtypes identified in TCGA cohort, the cancer samples in the LHNG cohort were classified by the top 100 featured genes. Gene expression data were z-normalized for both cohorts. The centroid of each subtype in TCGA cohort was calculated by averaging the inner-subtype expression data. For a profile of each sample in the LHNG cohort, the Pearson correlations with the centroids of TCGA cohort were calculated, and the subtype with the highest correlation was assigned to this sample.
Other statistical methods
The association between conventional clinical variables and molecular subtypes was tested by chi-square test or Fisher's exact test. Multiple testing was corrected by the Benjamini-Hochberg's FDR. Kaplan-Meier curves and log-rank test were employed to compare the 5-year OS and RFS rates of different molecular subtypes. All statistical tests were two-sided. All statistical analyses were performed by R software.
Disclosure of interest
The authors report no conflict of interest.
Funding details
This work was supported by the Key Research Project of Science and Technology Department of Sichuan Province under Grant 2015SZ0053; and the National Natural Science Foundation of China under Grant 81602731.
2017ONCOIMM0650R-s01.doc
Download MS Word (8.1 MB)References
- Siegel RL, Miller KD, Jemal A. Cancer Statistics, 2017. CA Cancer J Clin. 2017;67:7–30. doi:10.3322/caac.21387.
- Chi AC, Day TA, Neville BW. Oral cavity and oropharyngeal squamous cell carcinoma–an update. CA Cancer J Clin. 2015;65:401–21. doi:10.3322/caac.21293. PMID:26215712
- Cooper JS, Zhang Q, Pajak TF, Forastiere AA, Jacobs J, Saxman SB, Kish JA, Kim HE, Cmelak AJ, Rotman M, et al. Long-term follow-up of the RTOG 9501/intergroup phase III trial: postoperative concurrent radiation therapy and chemotherapy in high-risk squamous cell carcinoma of the head and neck. Int J Radiat Oncol Biol Phys. 2012;84:1198–205. doi:10.1016/j.ijrobp.2012.05.008. PMID:22749632
- Wolchok JD. PD-1 Blockers. Cell. 2015;162:937. doi:10.1016/j.cell.2015.07.045. PMID:26317459
- Seiwert TY, Burtness B, Mehra R, Weiss J, Berger R, Eder JP, et al. Safety and clinical activity of pembrolizumab for treatment of recurrent or metastatic squamous cell carcinoma of the head and neck (KEYNOTE-012): an open-label, multicentre, phase 1b trial. Lancet Oncol. 2016;17:956–65. doi:10.1016/S1470-2045(16)30066-3. PMID:27247226
- Ferris RL, Blumenschein G, Jr., Fayette J, Guigay J, Colevas AD, Licitra L, et al. Nivolumab for Recurrent Squamous-Cell Carcinoma of the Head and Neck. N Engl J Med. 2016;375:1856–67. doi:10.1056/NEJMoa1602252. PMID:27718784
- Chow LQ, Haddad R, Gupta S, Mahipal A, Mehra R, Tahara M, Berger R, Eder JP, Burtness B, Lee SH, et al. Antitumor Activity of Pembrolizumab in Biomarker-Unselected Patients With Recurrent and/or Metastatic Head and Neck Squamous Cell Carcinoma: Results From the Phase Ib KEYNOTE-012 Expansion Cohort. J Clin Oncol. 2016;34:3838–3845. doi:10.1200/JCO.2016.68.1478. PMID: 27646946
- Bauml J, Seiwert TY, Pfister DG, Worden F, Liu SV, Gilbert J, Saba NF, Weiss J, Wirth L, Sukari A, et al. Pembrolizumab for Platinum- and Cetuximab-Refractory Head and Neck Cancer: Results From a Single-Arm, Phase II Study. J Clin Oncol. 2017;35:1542–9. doi:10.1200/JCO.2016.70.1524. PMID:28328302
- Chow MT, Moller A, Smyth MJ. Inflammation and immune surveillance in cancer. Semin Cancer Biol. 2012;22:23–32. doi:10.1016/j.semcancer.2011.12.004. PMID:22210181
- Geary CD, Sun JC. Memory responses of natural killer cells. Semin Immunol. 2017;31:11–19. doi:10.1016/j.smim.2017.08.012.PMID:28863960
- Chikuma S. CTLA-4, an Essential Immune-Checkpoint for T-Cell Activation. Curr Top Microbiol Immunol. 2017 [Epub ahead of print]. doi:10.1007/82_2017_61. PMID:28900679
- Swatler J, Kozlowska E. [Immune checkpointtargeted cancer immunotherapies]. Postepy Hig Med Dosw (Online). 2016;70:25–42. doi:10.5604/17322693.1192926. PMID:26864062
- Ndiaye C, Mena M, Alemany L, Arbyn M, Castellsague X, Laporte L, et al. HPV DNA, E6/E7 mRNA, and p16INK4 a detection in head and neck cancers: a systematic review and meta-analysis. Lancet Oncol. 2014;15:1319–31. doi:10.1016/S1470-2045(14)70471-1. PMID:25439690
- Maxwell JH, Grandis JR, Ferris RL. HPV-Associated Head and Neck Cancer: Unique Features of Epidemiology and Clinical Management. Annu Rev Med. 2016;67:91–101. doi:10.1146/annurev-med-051914-021907. PMID:26332002
- Wichmann G, Rosolowski M, Krohn K, Kreuz M, Boehm A, Reiche A, Scharrer U, Halama D, Bertolini J, Bauer U, et al. The role of HPV RNA transcription, immune response-related gene expression and disruptive TP53 mutations in diagnostic and prognostic profiling of head and neck cancer. Int J Cancer. 2015;137:2846–57. doi:10.1002/ijc.29649. PMID:26095926
- Moskovitz JM, Moy J, Seiwert TY, Ferris RL. Immunotherapy for Head and Neck Squamous Cell Carcinoma: A Review of Current and Emerging Therapeutic Options. Oncologist. 2017;22:680–693. doi:10.1634/theoncologist.2016-0318. PMID:28507203
- Chen F, Zhang Y, Parra E, Rodriguez J, Behrens C, Akbani R, Lu Y, Kurie JM, Gibbons DL, Mills GB, et al. Multiplatform-based molecular subtypes of non-small-cell lung cancer. Oncogene. 2017;36:1384–93. doi:10.1038/onc.2016.303. PMID:27775076
- Bindea G, Mlecnik B, Tosolini M, Kirilovsky A, Waldner M, Obenauf AC, Angell H, Fredriksen T, Lafontaine L, Berger A, et al. Spatiotemporal dynamics of intratumoral immune cells reveal the immune landscape in human cancer. Immunity. 2013;39:782–95. doi:10.1016/j.immuni.2013.10.003. PMID:24138885
- Camus M, Tosolini M, Mlecnik B, Pages F, Kirilovsky A, Berger A, Costes A, Bindea G, Charoentong P, Bruneval P, et al. Coordination of intratumoral immune reaction and human colorectal cancer recurrence. Cancer Res. 2009;69:2685–93. doi:10.1158/0008-5472.CAN-08-2654. PMID:19258510
- Chung CH, Parker JS, Karaca G, Wu J, Funkhouser WK, Moore D, et al. Molecular classification of head and neck squamous cell carcinomas using patterns of gene expression. Cancer Cell. 2004;5:489–500. doi:10.1016/S1535-6108(04)00112-6. PMID:15144956
- Walter V, Yin X, Wilkerson MD, Cabanski CR, Zhao N, Du Y, Ang MK, Hayward MC, Salazar AH, Hoadley KA, et al. Molecular subtypes in head and neck cancer exhibit distinct patterns of chromosomal gain and loss of canonical cancer genes. PLoS One. 2013;8:e56823. doi:10.1371/journal.pone.0056823. PMID:23451093
- Saloura V, Zuo Z, Koeppen H, Keck MK, Khattri A, Boe M, et al. Correlation of T-cell inflamed phenotype with mesenchymal subtype, expression of PD-L1, and other immune checkpoints in head and neck cancer. Journal of Clinical Oncology. 2014;32:6009-.
- Wood O, Woo J, Seumois G, Savelyeva N, McCann KJ, Singh D, Jones T, Peel L, Breen MS, Ward M, et al. Gene expression analysis of TIL rich HPV-driven head and neck tumors reveals a distinct B-cell signature when compared to HPV independent tumors. Oncotarget. 2016; 7:56781–97. doi:10.18632/oncotarget.10788. PMID:27462861
- Marelli G, Sica A, Vannucci L, Allavena P. Inflammation as target in cancer therapy. Curr Opin Pharmacol. 2017;35:57–65. doi:10.1016/j.coph.2017.05.007. PMID:28618326
- Koontongkaew S. The tumor microenvironment contribution to development, growth, invasion and metastasis of head and neck squamous cell carcinomas. J Cancer. 2013;4:66–83. doi:10.7150/jca.5112. PMID:23386906
- Chiarugi P. Cancer-associated fibroblasts and macrophages: Friendly conspirators for malignancy. Oncoimmunology. 2013;2:e25563. doi:10.4161/onci.25563. PMID:24319632
- Sun W, Wei FQ, Li WJ, Wei JW, Zhong H, Wen YH, Lei WB, Chen L, Li H, Lin HQ, et al. A positive-feedback loop between tumour infiltrating activated Treg cells and type 2-skewed macrophages is essential for progression of laryngeal squamous cell carcinoma. Br J Cancer. 2017 [Epub ahead of print]. doi:10.1038/bjc.2017.329. PMID:28949956.
- Takahashi H, Sakakura K, Kudo T, Toyoda M, Kaira K, Oyama T, Chikamatsu K. Cancer-associated fibroblasts promote an immunosuppressive microenvironment through the induction and accumulation of protumoral macrophages. Oncotarget. 2017;8:8633–47. PMID:28052009
- Chang KP, Kao HK, Yen TC, Chang YL, Liang Y, Liu SC, Lee LY, Chang YL, Kang CJ, Chen IH, et al. Overexpression of macrophage inflammatory protein-3alpha in oral cavity squamous cell carcinoma is associated with nodal metastasis. Oral Oncol. 2011;47:108–13. doi:10.1016/j.oraloncology.2010.11.012. PMID:21163685
- Valero C, Pardo L, Lopez M, Garcia J, Camacho M, Quer M, León X. Pretreatment count of peripheral neutrophils, monocytes, and lymphocytes as independent prognostic factor in patients with head and neck cancer. Head Neck. 2017;39:219–26. doi:10.1002/hed.24561. PMID:27534525
- Satgunaseelan L, Gupta R, Madore J, Chia N, Lum T, Palme CE, Boyer M, Scolyer RA, Clark JR. Programmed cell death-ligand 1 expression in oral squamous cell carcinoma is associated with an inflammatory phenotype. Pathology. 2016;48:574–80. doi:10.1016/j.pathol.2016.07.003. PMID:27590194
- Chakravarthy A, Henderson S, Thirdborough SM, Ottensmeier CH, Su X, Lechner M, Feber A, Thomas GJ, Fenton TR. Human Papillomavirus Drives Tumor Development Throughout the Head and Neck: Improved Prognosis Is Associated With an Immune Response Largely Restricted to the Oropharynx. J Clin Oncol. 2016;34:4132–41. doi:10.1200/JCO.2016.68.2955. PMID:27863190
- Beyranvand Nejad E, van der Sluis TC, van Duikeren S, Yagita H, Janssen GM, van Veelen PA, Melief CJ, van der Burg SH, Arens R. Tumor Eradication by Cisplatin Is Sustained by CD80/86-Mediated Costimulation of CD8+ T Cells. Cancer Res. 2016;76:6017–29. doi:10.1158/0008-5472.CAN-16-0881. PMID:27569212
- Huber-Ruano I, Raventos C, Cuartas I, Sanchez-Jaro C, Arias A, Parra JL, Wosikowski K, Janicot M, Seoane J. An antisense oligonucleotide targeting TGF-beta2 inhibits lung metastasis and induces CD86 expression in tumor-associated macrophages. Ann Oncol;28:2278–85. doi:10.1093/annonc/mdx314. PMID:28911087
- Peng Y, Luo G, Zhou J, Wang X, Hu J, Cui Y, Li XC, Tan J, Yang S, Zhan R, et al. CD86 is an activation receptor for NK cell cytotoxicity against tumor cells. PLoS One. 2013;8:e83913. doi:10.1371/journal.pone.0083913. PMID:24349559
- Seth P, Csizmadia E, Hedblom A, Vuerich M, Xie H, Li M, Longhi MS, Wegiel B. Deletion of Lactate Dehydrogenase-A in Myeloid Cells Triggers Antitumor Immunity. Cancer Res. 2017;77:3632–43. doi:10.1158/0008-5472.CAN-16-2938. PMID:28446465
- Bu LL, Yu GT, Wu L, Mao L, Deng WW, Liu JF, Kulkarni AB, Zhang WF, Zhang L, Sun ZJ. STAT3 Induces Immunosuppression by Upregulating PD-1/PD-L1 in HNSCC. J Dent Res. 2017;96:1027–34. doi:10.1177/0022034517712435. PMID:28605599
- Calles A, Liao X, Sholl LM, Rodig SJ, Freeman GJ, Butaney M, Lydon C, Dahlberg SE, Hodi FS, Oxnard GR, et al. Expression of PD-1 and Its Ligands, PD-L1 and PD-L2, in Smokers and Never Smokers with KRAS-Mutant Lung Cancer. J Thorac Oncol. 2015;10:1726–35. doi:10.1097/JTO.0000000000000687. PMID:26473645
- Tosolini M, Kirilovsky A, Mlecnik B, Fredriksen T, Mauger S, Bindea G, Berger A, Bruneval P, Fridman WH, Pagès F, et al. Clinical impact of different classes of infiltrating T cytotoxic and helper cells (Th1, th2, treg, th17) in patients with colorectal cancer. Cancer Res. 2011;71:1263–71. doi:10.1158/0008-5472.CAN-10-2907. PMID:21303976
- Sandoval F, Terme M, Nizard M, Badoual C, Bureau MF, Freyburger L, Clement O, Marcheteau E, Gey A, Fraisse G, et al. Mucosal imprinting of vaccine-induced CD8(+) T cells is crucial to inhibit the growth of mucosal tumors. Sci Transl Med. 5:172ra20. PMID:23408053
- Balermpas P, Rodel F, Weiss C, Rodel C, Fokas E. Tumor-infiltrating lymphocytes favor the response to chemoradiotherapy of head and neck cancer. Oncoimmunology. 2014;3:e27403. doi:10.4161/onci.27403. PMID:24711959
- Badoual C, Hans S, Merillon N, Van Ryswick C, Ravel P, Benhamouda N, Levionnois E, Nizard M, Si-Mohamed A, Besnier N, et al. PD-1-expressing tumor-infiltrating T cells are a favorable prognostic biomarker in HPV-associated head and neck cancer. Cancer Res. 2013;73:128–38. doi:10.1158/0008-5472.CAN-12-2606. PMID:23135914
- Distel LV, Fickenscher R, Dietel K, Hung A, Iro H, Zenk J, Nkenke E, Büttner M, Niedobitek G, Grabenbauer GG. Tumour infiltrating lymphocytes in squamous cell carcinoma of the oro- and hypopharynx: prognostic impact may depend on type of treatment and stage of disease. Oral Oncol. 2009;45:e167–74. doi:10.1016/j.oraloncology.2009.05.640. PMID:19576838
- Wilkerson MD, Hayes DN. ConsensusClusterPlus: a class discovery tool with confidence assessments and item tracking. Bioinformatics. 2010;26:1572–3. doi:10.1093/bioinformatics/btq170. PMID:20427518
- Liu Y, Hayes DN, Nobel A, Marron JS. Statistical Significance of Clustering for High-Dimension, Low sample Size Data. Journal of the American Statistical Association. 2008;103:1281–93. doi:10.1198/016214508000000454.
- Becht E, Giraldo NA, Lacroix L, Buttard B, Elarouci N, Petitprez F, Selves J, Laurent-Puig P, Sautès-Fridman C, Fridman WH, et al. Estimating the population abundance of tissue-infiltrating immune and stromal cell populations using gene expression. Genome Biol. 2016;17:218. doi:10.1186/s13059-016-1070-5. PMID:27765066.