
ABSTRACT
Immunotherapy's effect against hepatocellular carcinoma (HCC) is hampered by immunosuppressive mechanisms in the tumor microenvironment. We assessed the clinicopathologic and biologic relevance of OX40, a costimulatory molecular expressed by regulatory T cells (Tregs), in HCC. We analyzed the immunohistochemistry data of 316 patients treated at West China Hospital (WCH) and the RNA sequencing data of 370 patients in The Cancer Genome Atlas (TCGA) to determine the clinicopathologic significance of OX40 in HCC. We also assessed associations between OX40 and multiple immune-related markers. Using the TCGA data, we further characterized the transcriptome, immune cell functions, and mutation signature related to OX40. We found that OX40 expression was higher in HCC than in adjacent liver tissue. In the WCH set, 136 (43%) patients had high-OX40 expression, whereas in the TCGA set, 247 (67%) patients had high-OX40 expression as determined by the X-tile program. High-OX40 expression was associated with high serum alpha-fetoprotein level, vascular invasion, and shorter survival. The prognostic significance of OX40 was validated in additional cohorts. OX40 expression was also associated with CD8A, CD68, LAG3, TIM-3, and PD-1 expression. High-OX40 expression tumors were characterized by upregulated cytokines and exhaustion-specific markers. Analysis of the enrichment data of immune cell types indicated that OX40 expression was associated with the functions of macrophages, plasmacytoid dendritic cells, and co-inhibitory T cells. Finally, high-and low-OX40 expressions were associated with mutations in AKT/mTOR and Wnt/β-catenin signaling, respectively. These results indicate that high-OX40 expression represents the activation of multiple immunosuppressive pathways and provide a rationale for the therapeutic targeting OX40 in HCC patients.
Introduction
Liver cancer is the second leading cause of cancer-related death worldwide. Approximately 850,000 new cases are reported per year, and about 90% of these are hepatocellular carcinoma (HCC).Citation1 Surgical resection is the major curative treatment for HCC, but the incidence of postoperative tumor recurrence is high. For patients with advanced, unresectable HCC, sorafenib is now the worldwide standard of treatment. However, these patients rapidly develop sorafenib resistance, and their disease quickly progresses.Citation2,3 Alternative treatments that benefit patients with HCC are greatly needed.
Immunotherapy represents a major breakthrough in cancer therapy.Citation4,5 The programmed cell death protein 1 (PD-1) and its ligand, programmed cell death 1 ligand 1 (PD-L1), are among the best-described immunotherapy targets. A growing number of studies are investigating the PD-1 pathway and its implication in treatment response and prognosis in patients with different cancer types, including HCC.Citation6–10 However, many patients do not experience therapeutic benefits from PD-1/PD-L1 immunotherapy, which suggests that other immunosuppressive mechanisms in the tumor immune microenvironment exist.
OX40 (also known as CD134 and tumor necrosis factor superfamily receptor 4) plays a vital role in the immune system by regulating T-cell activation. OX40 is transiently expressed by activated antigen-presenting cells, thus providing costimulatory signals to T cells, resulting in the proliferation and survival of memory T cells.Citation11 OX40 is expressed in an inducible manner by human regulatory T cells (Tregs), but whether this inducible signal can expand or suppress this cell population is unclear. It was recently reported that OX40 expression represents the expansion of highly suppressive Tregs in HCC,Citation12 suggesting that OX40 has complicated roles in the HCC immune microenvironment. However, information about OX40's expression in HCC, its relationship with the disease's clinicopathologic and molecular features, and its role in shaping the tumor immune microenvironment are still poorly understood.
In this study, we aimed to define the biological and clinical relevance of OX40 expression in HCC. To achieve this, we used tissue microarray (TMA) that included samples of 492 HCC tumors and analyzed the data of 370 HCC patients in The Cancer Genome Atlas (TCGA). We assessed OX40's expression in tumors and adjacent liver tissue, its clinicopathologic significance, and its association with multiple immune-related markers, including PD-1, PD-L1, TIM-3, LAG3, CD8, and CD68. Furthermore, we determined in the TCGA set the extent to which OX40 expression is associated with immune cell functions; cytokines, chemokines, interleukins, and their receptors; and gene- and/or pathway-level somatic mutations. The findings of this study may improve our understanding of the immunobiology of HCC and provide the rationale for developing anti-OX40 immunotherapy for HCC.
Patients and methods
Patients and samples
Study participants provided written informed consent, and the study was approved by the local ethics committee of West China Hospital (WCH) and Chongqing Medical University (CMU). The TMA used in this study are unselected, non-consecutive, primary and historically confirmed HCCs without pretreatment, that were resected at WCH (n = 316) from 2009 through 2014, at CMU (n = 86) from 2013 through 2016. Another commercialized TMA set (HLivH090Su01, Shanghai Outdo Biotech, n = 90) whose samples were collected from 2007 through 2008 was also used in this study (Fig S1). Following partial hepatectomy, approximately 5 g segments of tumor and adjacent tissue were isolated and immediately stored in liquid nitrogen until analysis. Tissue cores were punched from the representative tissue areas of the formalin-fixed, paraffin-embedded HCC samples and arranged in 1 recipient paraffin block, which was cut into 5-μm sections. Prospectively recorded clinical and biological data, including age, sex, hepatitis B virus infection, hepatitis C virus infection, preoperative serum alpha-fetoprotein (AFP) level, and type of surgery, were retrieved from computerized databases. Tumor staging was performed at the time of each patient's diagnosis using the Barcelona Clinic Liver Cancer (BCLC) staging system. Histological slides were reviewed by a pathologist specializing in liver disease, who evaluated them for tumor differentiation, tumor size, the number of nodules, vascular invasion, and the Ishak fibrosis score of the adjacent liver tissue. The primary endpoint was overall survival (OS), defined as time from surgery to death regardless of cause. Secondary end point was disease-free survival (DFS), defined as time from date of surgery to date of progression, or death from any cause. Patients with no events were censored at the time of their last follow-up.
Immunohistochemistry
Immunohistochemistry was performed according to standard protocols. Prior to staining, sections were baked at 60°C for 1 hour, de-paraffinized in xylene, and rehydrated through graded ethanol. Antigen retrieval was performed by heating the sections under high pressure in citrate antigen retrieval solution for about 5 minutes. Sections were incubated with monoclonal antibodies against CD8, CD68, PD-1, PD-L1, TIM-3, LAG3, OX40, E-cadherin, and vimentin for 60 minutes at room temperature. Detailed information on the primary antibodies used for IHC can be found in Table S1. The immunoreaction was detected by treatment with diaminobenzidine chromogen for 3 minutes. All staining runs included a no-primary-antibody control. Specifically, Placenta was used as a positive control for PD-L1 expression. Immunoreaction images were viewed and captured using the NDP.view.2 software program. Protein expression was assessed by 2 experienced liver pathologists blinded to clinical data, who performed the first reading independently and then debated any discrepancies until reaching a consensus. The mean value was used for the analyses presented.
Quantitation of OX40, PD-1, LAG3, TIM-3, CD8 and CD68
OX40, PD-1, LAG3, TIM-3, CD8, and CD68 measurements were recorded as the total number of cells expressing the protein in 5 random images at 40 × magnification from each immunostained HCC section. The expressions of these immune-related markers were classified as high if the number of positive immune cells was superior to the median of the full series, and as low if equal or inferior to the median of full series (Fig S2). This yielded a cutoff of 0 for OX40, PD-1, LAG3, TIM-3 and CD68 where more than half of cases had negative staining, and 17 for CD8, in the WCH set. As a result, patients were considered to have low CD68 (n = 159) or LAG3 (n = 178) or TIM-3 (n = 155) or OX40 (n = 180) or PD-1 (n = 272) staining when there was complete absence of staining, and low CD8 (n = 157) when patients were either completely absence of staining or very faint staining.
Quantitation of PD-L1
PD-L1 expression was counted in tumor-infiltrating immune cells and when present, in tumor cells. Expression of PD-L1 in immune cells were recorded as the total number of cells expressing the protein in 5 random images at 40 × magnification from each immunostained HCC section, and were defined as high if the number of positive immune cells was superior to the median of the full series. Positive PD-L1 tumors cells staining was defined as more than 1% tumors cells staining on the membrane/surface
The interobsever agreement analysis for OX40 expression was conducted in the WCH set. The intraclass correlation coefficient (ICC) of OX40 calculated to determine internal consistency among observers was 0.84 (95% confidence interval [CI], 0.80–0.87; P < 0.01), and the ICC of OX40 calculated to determine agreement among observers was 0.82 (95% CI, 0.73–0.87; P < 0.01). If category cut points of OX40 were used, the kappa statistic indicated almost perfect agreement between the two pathologists (kappa = 0.80).
Immunofluorescence microscopy
Mouse anti-human CD4 (1:100, Abcam, ab34276), anti-FOXP3 (1:100, Abcam, ab20034), anti-OX40 (1:100, Abcam, ab119904) and the corresponding secondary antibodies (Molecular Probes) were applied sequentially. HCC Tissue sections were counterstained with DAPI (Sigma) for nuclear staining. Images were captured with a Zeiss Axio Imager. A2 microscope. Images were adjusted for brightness and contrast with Adobe Photoshop (version 7.0).
Functional assay
FACS-purified (CD3+CD4+CD25+CD127low) tumoral Treg were classified into two groups according to the staining intensity of OX40. OX40+ and OX40− Treg (1,000 per well) were cocultured with CD3+CD8+ effector T (Teff) cells (2,500 per well) for 4 days in 96-well round-bottom plates (Sarstedt, Nümbrecht, Germany), respectively. Human T-Activator CD3/CD28 Dynabeads® (Gibco™; 1:5, bead:Teff ratio) were added to the cocultures. The staining intensity of IFN-γ in Teff was measured by multi-color FCM. The following antibodies were used for flow cytometry: anti-CD3 (APC-Cy™7, BD), anti-CD4 (Alexa Fluor® 700, BD), anti-CD25 (PE, BD), anti-CD127 (FITC, BD), anti-OX40 (BV421, BD), anti-CD8 (APC-Cy™7, BD), anti-IFN-γ (PE, BD).
TCGA data
Level 3 RNA-sequencing data, mutation data, and clinical information for 370 HCC patients were downloaded from the cBioPortal for Cancer Genomics (www.cbioportal.org). We used X-tile plots (version 3.6.1, Yale University School of Medicine) to select the optimum cutoff for the expression of OX40, CD8A, CD68, TIM-3, LAG3, PD-L1 and PD-1 based on the association of gene mRNA levels with the patients' overall survival (OS).Citation13 The cutoff value for OX40 was used to assign patients to the high-OX40 expression group (OX40 > 52.1) or low-OX40 expression group (OX40 ≤ 52.1). Likewise, patients were divided into high- and low-expression groups based on the expression of CD8A (cutoff = 19.5), CD68 (cutoff = 4270.0), TIM-3 (cutoff = 80.4), LAG3 (cutoff = 90.8), PD-L1 (cutoff = 13.1) and PD-1 (cutoff = 8.1). The fold change in gene expression was the ratio of the mean gene expression value of the high-OX40 expression group to that of the low-OX40 expression group. Significance was assessed with adjustment for multiple comparisons. Plots and figures were generated using the R package “ggplot2” and GraphPad Prism.
Gene Expression Omnibus (GEO) data
Microarray gene expression data of HCC patient's cohort was downloaded from the GEO database (accession numbers GSE1898).Citation14 R package “GEOquery” was used to extract the expression values of genes of interests. Clinical data was accessed from the PRECOG (www.precog.stanford.edu/index.php). In this validation cohort, mRNA cutoffs that could divide patients into the same percentage as cutoffs in the TCGA set did were applied (OX40: -0.63; CD68: 0.78; CD8A: -1.19; LAG3: 0.20)
Statistical analysis
All statistical tests were 2-sided, and P < 0.05 was considered to be statistically significant. The χ2 test or Fisher exact test was used to assess differences in categorical variables, and the t-test or Wilcoxon rank-sum test was used to detect differences in continuous variables. The Spearman correlation test was used to determine the extent of correlation between the expression of OX40 and those of other genes. The survival rates of the high- and low-OX40 expression groups were estimated using the Kaplan-Meier method, and OS and DFS were assessed using the log-rank test. The hazard ratios (HR) and 95% CI were estimated for age (continuous variable), sex (male/female), tumor stage (BCLC A/B/C or AJCC I/II/II, IV)), tumor grade (low and median/high), microvascular invasion (yes/no) and immune markers (low/high or positive/negative) in a univariate analysis model, and multivariate analysis was performed on those with P less than 0.20 in the univariate analysis. Cases with missing data items were also included in the analysis by categorizing them as “missing”. Statistical analysis was performed using R software (R 3.3.2). REMARK criteria were followed for this study.Citation15
Results
Patients and samples
The characteristics of the patients in the WCH set (n = 316), CMU set (n = 86), HLivH090Su01 set (n = 90) and TCGA set (n = 370) are presented in Table S1. Compared with the TCGA set, the WCH set, CMU set and HLivH090Su01 set had significantly larger proportion of male participants. Significant differences were also observed with regard to age, race, risk factors, and AFP levels.
OX40 is differentially expressed in HCC and associated with an aggressive phenotype
In the WCH set, 136 (43%) cases had intratumoral immune cells with OX40 expression. Tumors had a significantly higher number of OX40+ cells than adjacent liver tissues did (P < 0.01; ). Moreover, in the TCGA set, tumors had a significantly higher OX40 mRNA level than paired non-tumor tissues did (). Using single T cell sequencing data from a recent study,Citation16 we found that OX40 was predominantly expressed in tumor infiltrating Tregs (Fig S3). Immunofluorescence microscopy confirmed the presence of OX40 on tumor-infiltrating lymphocytes in HCC, predominantly on the membrane of FOXP3+ Tregs ().
Figure 1. OX40 is differentially expressed in HCC and adjacent liver tissues. (A) Immunohistochemical staining showing higher OX40 expression in HCC than adjacent liver tissues. (Scale bars: 50 μm) (B) Scatter plot showing more OX40 positive cell counts in HCC than adjacent liver tissue from the WCH set; the Y-axis is the number of OX40 positive cells. (C) Scatter plot showing the higher OX40 mRNA level in HCC than in adjacent liver tissue in the TCGA set; the Y-axis is the OX40 mRNA expression measured by RNA sequencing. (D) Three-color immunofluorescence microscopy was used to analyze the distribution of tumor-infiltrating Tregs expressing OX40. Representative images from two cases showing the expression of OX40 (cyan) on FOXP3+ (red) T cells. (Scale bars: 20 μm).
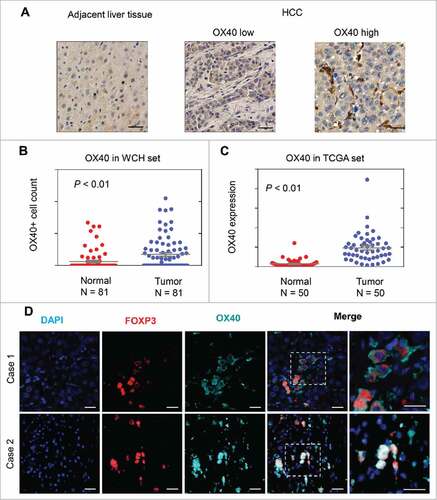
We then assessed the association of OX40 expression with the clinicopathologic features of HCC patients. In the WCH set, OX40 expression was significantly associated with markers of tumor aggressiveness, including AFP level >20 ng/ml (P < 0.01), tumor size >5 cm (P < 0.01), and vascular invasion (P < 0.01). Consistent results were observed in the TCGA set; compared with the low-OX40 expression group, the high-OX40 expression group had higher proportions of patients with an AFP level >20 ng/ml (P = 0.03) and vascular invasion (P = 0.03; ).
Table 1. Comparison of the OX40 expression statuses and clinicopathologic features of patients in the West China Hospital (WCH) and The Cancer Genome Atlas (TCGA) sets.
Expression of OX40 is associated with that of multiple immune-related markers
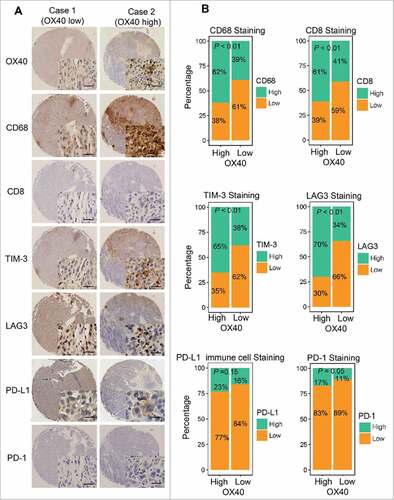
In the WCH set, immunohistochemical analysis revealed that CD8+T cells were present in 96% (304/315) of samples and were the predominant cell type. Positive staining of CD68 and TIM-3 were detected in 49% (154/313) and 50% (154/309) of samples, respectively. Moreover, positive staining of LAG3 was detected in immune cells in 49% (155/312) of samples, some of which had both cytoplasmic and nuclear staining of cancer cells. PD-1+ lymphocytes were observed in 14% (43/315) of samples, with most of the PD-1+ cells in samples with lymphoid aggregate, which was consistent with a previous study's findings.Citation7 Moreover, 19% (55/291) of cases showed positive staining of PD-L1 on tumor-infiltrating immune cells, and 11% (33/291) of cases showed positive staining of tumor cells. More patients in the high-OX40 expression group had high expression of CD8, CD68, LAG3, TIM-3 and PD-1 (). In line with findings in the WCH set, in the TCGA set, the mRNA expression of OX40 was significantly correlated with that of the immune-related markers, except for PD-L1, whose mRNA expression was quite low (Fig S4).
Figure 2. Higher expression of multiple immunomarkers in HCC tissues with high-OX40 expression. (A) Immunohistochemical staining of CD68, CD8, TIM-3, LAG3, PD-L1, and PD-1 in consecutive TMA sections of a tumor with high-OX40 expression (right) and another with low-OX40 expression (left) from 2 patients in the WCH set. (Scale bars: 50 μm) (B) Proportions of WCH patients in high- or low-OX40 expression groups with high or low expression of different immunomarkers.
High-OX40 protein expression is associated with poor survival
In the WCH set, the unadjusted survival curves showed that the low-OX40 expression group had longer OS than the high-OX40 expression group did (P < 0.01). The 5-year OS rate of the low-OX40 expression group (73%; 95% CI, 64% to 82%) was longer than that of the high-OX40 expression group (48%; 95% CI, 38% to 60%). Similarly, the 5-year DFS of the low-OX40 expression group (38%; 95% CI, 27% to 53%) was longer than that of the high-OX40 expression group (21%; 95% CI, 11% to 38%; , Table S3). After adjustment for confounding factors, the multivariate analysis confirmed that patients with high-OX40 expression had shorter OS (adjusted HR, 2.82; 95% CI, 1.78 to 4.47; P < 0.01) and DFS (adjusted HR, 2.26; 95% CI, 1.44 to 3.54; P < 0.01) than patients with low-OX40 expression did. Moreover, independent prognostic factors for OS were CD8 (adjusted HR, 0.31; P < 0.01), PD-L1 on immune cells (adjusted HR, 1.87; P = 0.02) and CD68 (adjusted HR, 1.85; P < 0.01; ).
Figure 3. Prognostic significance of OX40 expression. (A) OS (left) and DFS (right) curves for the high- and low-OX40 expression groups in the WCH set. Log-rank test P values and life tables are also shown. (B) OS (left) and DFS (right) curves for the high- and low-OX40 expression groups in the CMU_HL set. (C) OS (left) and DFS (right) curves for the high- and low-OX40 expression groups in the TCGA set.
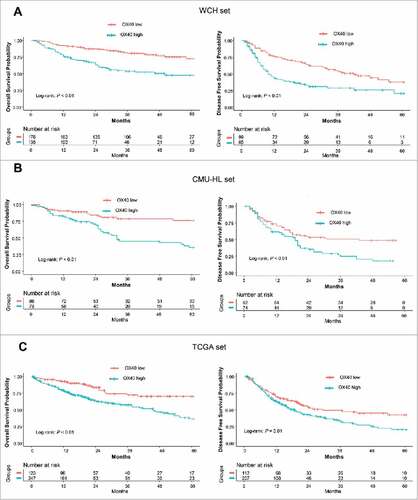
Table 2. Prognostic value of immune-related markers for OS and DFS estimated from multivariable model on WCH set.
To validate these findings, we used another TMA set (combination of CMU set and HLivH090Su01, n = 176), and analyzed the prognostic significance of OX40. In line with results in the WCH set, patients with high-OX40 expression showed poor survival (OS: adjusted HR, 2.39, P < 0.01; DFS, adjusted HR, 1.69; P = 0.03), confirming the results in the WCH set (, Table S4, Table S5)
High-OX40 mRNA expression is associated with poor survival
We then assessed the prognostic significance of OX40 mRNA expression in the TCGA set. The OS and DFS durations of the low-OX40 expression group were significantly longer than those of the high-OX40 expression group (P < 0. 01 and P = 0.01, respectively; , Table S6). The estimated 5-year OS and DFS rates of the patients with low-OX40 expression (70% [95% CI, 61% to 82%] and 43% [95% CI, 32% to 57%], respectively) were higher than those of the patients with high-OX40 expression (36% [95% CI, 28% to 48%] and 19% [95% CI, 9% to 41%], respectively). After controlling for covariates, the differences in survival outcomes according to OX40 expression remained (OS: adjusted HR, 2.57 95% CI, 1.64 to 4.03; P < 0.01; DFS: adjusted HR, 1.72; 95% CI, 1.18 to 2.51; P < 0.01). In addition, independent prognostic factors for OS in the TCGA set were CD8A (adjusted HR, 0.54; P = 0.03), LAG3 (adjusted HR, 0.46; P < 0.01) and CD68 (adjusted HR, 1.69; P = 0.01; Table S7). To validate the prognostic significance of OX40 mRNA expression, we used a HCC microarray dataset (GSE1898) from the GEO database. Four markers (CD8, CD68, LAG3 and OX40) that were significant in the TCGA dataset were assessed for their prognostic significance. As shown in Table S8, high-OX40 expression was significantly associated with poor OS (HR, 2.23, P = 0.04), confirming the results in the TCGA set.
OX40-related cytokines and cytokine receptors
Increasing evidence suggests that pro-inflammatory and anti-inflammatory cytokine imbalances in tumor microenvironment promote HCC carcinogenesis and progression.Citation17,18 We therefore hypothesized that cytokines and cytokine receptors are dysregulated in high-OX40 expression tumors. In line with this notion, we found that many cytokines and cytokine receptors previously shown to promote HCC progression, including PLAU, PLAUR, CCL17, CCL19, CCL20, PGF, TGF-β, and XCL2,Citation19–25 were significantly upregulated in high-OX40 expression tumors (Fig S5A). Among these genes, TGF-β has been reported to play a central role in inducing other cytokines and cytokine receptors such as CCL5 and CXCR4, which were also significantly upregulated. Interestingly, genes that protect against HCC, such as ESR1 and LEP1, were downregulated in tumors with high-OX40 expression. Some cytokine receptors expressed on the surface of Tregs, such as CCR5, CCR8, and IL2RA, were also upregulated. Likewise, dozens of chemokines and interleukins and their receptors were significantly upregulated in high-OX40 expression tumors. In contrast, only IL6R was upregulated in low-OX40 expression tumors (Figs S5B and C).
OX40-related immune cell functions
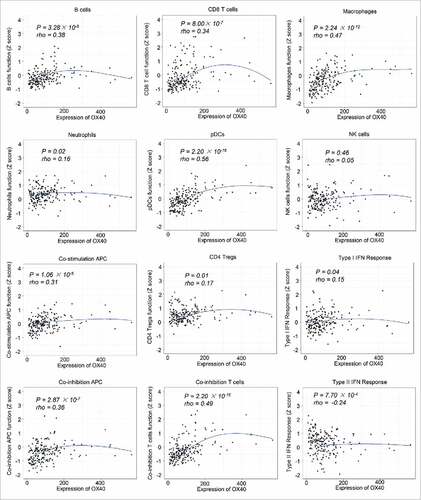
We then sought to determine whether OX40 expression is associated with immune cell function in tumors. We analyzed the enrichment data of 12 immune cell type and function gene sets reported previously.Citation26 Whereas OX40 had moderate correlation with B cells, CD8T cells, and co-stimulation/inhibition antigen-presenting cells, it had the strongest correlation with plasmacytoid dendritic cells (rho = 0.56), macrophages (rho = 0.47), and co-inhibitory T cells (rho = 0.49). Of note, we observed an inverse correlation between OX40 and type II IFN response (rho = -0.24), suggesting the dysfunction of antitumor immunity in high-OX40 expression tumors (). To assess whether high-OX40 expression tumors were associated with defective function of CD8T cells, we analyzed the expression of 82 exhaustion-specific genes in high-vs. low-OX40 expression tumors.Citation16 We found 58 genes were significantly upregulated in high-OX40 expression tumors. Specifically, multiple well-known exhaustion markers including LAYN (adjusted P = 2.54 × 10⁻¹²), HAVCR2 (adjusted P = 1.68 × 10⁻⁵), TIGIT (adjusted P = 1.21 × 10⁻⁵), ENTPD1 (adjusted P = 2.70 × 10⁻⁴), CTLA4 (adjusted P = 3.40 × 10⁻¹⁰), TNFRSF9 (adjusted P = 2.28 × 10⁻³) and CD27 (adjusted P = 2.77 × 10⁻⁵) were significantly upregulated in high-OX40 expression tumors (Table S9).
Figure 4. Local regression curves showing the correlation between OX40 expression and the function of different immune cells (Spearman rank correlation).
To assess whether OX40+ Treg can suppress the function of CD8+ T cells, HCC tissue-derived CD3+ CD8+ Teff cells were cocultured with OX40+ and OX40− Tregs and stimulated, followed by staining of IFN-γ and CD8. As shown in Fig S6, the percent expression of IFNγ+ CD8+ Teff is significantly higher in those cocultured with OX40− Tregs, as compared with those cocultured with OX40+ Tregs (n = 10, P < 0.01), suggesting that OX40+ Tregs were able to suppress the expression of IFN- γ on CD3+ CD8+ Teff cells. These data, together with data from the WCH set, indicate that the functions of CD8+ T cells are defective and multiple immunosuppressive pathways are activated in tumors with high-OX40 expression.
OX40-related mutational events
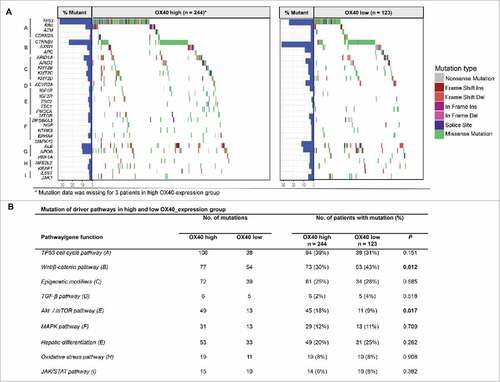
Genetic profiling studies have provided an accurate landscape of the mutations in HCC driver genes and helped identify major pathways that are recurrently mutated in HCC.Citation27 We therefore sought to determine whether OX40 expression is associated with mutated genes and pathways using the TCGA data. Among the 31 driver genes we analyzed, the mutated mTOR gene was significantly associated with high-OX40 expression tumors (P = 0.035), with all the mutations (n = 10) occurring in these tumors. We then determined the association between OX40 expression and 8 pathways that are frequently mutated in HCC. The proportion of patients with AKT/mTOR pathway mutations in the high-OX40 expression group (18%) was significantly higher than that in the low-OX40 expression group (9%; P = 0.017). In addition, the proportion of patients with mutations in Wnt/β-catenin signaling in the low-OX40 expression group (43%) was significantly higher than that of the high-OX40 expression group (30%; P = 0.012; ). These data suggest that high- and low-OX40 expression HCCs have distinct mutated driver genes and pathways, indicating that OX40 might be a marker gene for the molecular classification of HCC.
Figure 5. Pathway-based gene mutations in high- and low-OX40 expression samples. (A) Waterfall plot of mutated genes in high- and low-OX40 expression tumors. Gene mutations were ordered by distinct pathways: A indicates the TP53 cell cycle pathway; B, the Wnt/β-catenin pathway; C, epigenetic modifiers; D, TGF-β signaling; E, the Akt/mTOR pathway; F, the MAPK pathway; G, hepatic differentiation; H, the oxidative stress pathway; and I, JAK/STAT signaling. Each column represents a sample. Boxes with different colors indicate different types of non-synonymous mutations. (B) Numbers of mutations and numbers of patients with or without mutations in high- and low-OX40 expression groups. P values of the univariate analysis are also shown.
Discussion
OX40 is a costimulatory molecular that provides prosurvival signals to T cells during its transient expression following T-cell receptor ligation. However, OX40 expressed on Tregs has been proposed to have both prosurvival and inhibitory functions, suggesting that OX40 has a complicated role in regulating immune mechanisms.Citation11,28–30 In this study, we investigated the expression of OX40 and its association with clinicopathologic characteristics and biologic features in HCC. We found that almost half of HCC samples have OX40 expression, and this expression was predominantly on the membrane of CD4+ FOXP3+ Tregs. Moreover, we found higher expression of OX40 in HCC than in adjacent liver tissue, which is consistent with a previous study's findings.Citation12
We found that in the WCH set, tumors with OX40+ cells had more CD8+ T cell infiltration, and in the TCGA set, OX40 mRNA levels were correlated with CD8A mRNA levels. Moreover, gene enrichment data indicated the activation of CD8+ T cells in high-OX40 expression tumors. These results indicate that high-OX40 expression tumors may have pre-existing antitumor immunity, which is consistent with the notion that inhibitory pathways may serve as negative feedback mechanisms following CD8+ T cell infiltration.Citation31 In addition to identifying markers of T-cell activation, we also found that the function of B cells and costimulatory antigen-presenting cells were more active in high-OX40 expression tumors, which suggests that these tumors have an immune-reactive microenvironment.Citation6,32 However, the presence of CD8+ T cells and B cells do not readily translate into tumor cell killing in patients. There could be at least 2 possible explanations for this. First, in high-OX40 expression tumors, the suppressive OX40+ Tregs dominated the immune microenvironment, and the CD8+ T cells were functionally defective, as reflected by the reduced type II IFN response and expression of exhaustion-specific genes. This notion is consistent with a recent study showing that exhausted CD8+ T cells and Tregs are preferentially enriched and potentially clonally expanded in HCC.Citation16 Second, in addition to Tregs, several other immunosuppressive pathways, including macrophage, plasmacytoid dendritic cell, and immune checkpoint pathways, were activated in the high-OX40 expression tumors and might be harnessed by HCC cells to evade immune surveillance.Citation33–35 These results highlight that high-OX40 expression tumors have multiple immunosuppressive mechanisms and suggest that combinations of targeted therapies could be used effectively against HCC.
In this study, we identified a large number of cytokines and cytokine receptors with higher expression in high-OX40 expression tumors than in low-OX40 expression tumors. IL-2 can upregulate the expression of OX40 on the surface of human Tregs; moreover, IL-2 could interact with OX40 and promote the proliferation of Tregs.Citation36,37 In line with this, we found that all IL-2 receptors were significantly upregulated in high-OX40 expression tumors. Another important cytokine overexpressed in high-OX40 expression tumors was TGF-β. In addition to its immunosuppressive function against effector T cells, TGF-β has been implicated in the plasticity of CD4T cells upon OX40 stimulation.Citation32 Furthermore, CCL5 and CXCR4, 2 cytokines that are induced by TGF-β, were also upregulated in high-OX40 expression tumors. Also, TGF-β upregulation can induce the epithelial-to-mesenchymal transition of HCC,Citation38 this was confirmed in our samples (Figs. S7A and B), further indicating a tumor microenvironment favoring invasiveness. Several other upregulated chemokines and chemokine receptors, such as CCL20, CCR10, and CXCR3, also reportedly contribute to Treg infiltration.Citation18,39 Interestingly, we also found that several interleukins and interleukin receptors that can enhance antitumor immunity, including IL18, IL21R, and IL15RA, were upregulated in the tumors with high-OX40 expression. Although we cannot completely explain the underlying causes of these observations, they reflect that high- and low-OX40 expression tumors have distinct immune microenvironments. Future studies of the interaction between cytokines and OX40 may help elucidate the immunosuppressive mechanisms in HCC.
Our analysis of high-throughput sequencing data indicated that high- and low-OX40 expression tumors had distinct mutation signature. Analyses of cumulative data from high-throughput sequencing have identified a small number of mutated HCC driver genes. These driver genes belong to key signaling pathways that are involved in HCC development and progression. Based on these molecular events, HCC can be roughly divided into proliferation and nonproliferation subclasses.Citation27,40 Our results linked high-OX40 expression tumors to the proliferation subclass of HCC, which is characterized by activating mutations that affect AKT/mTOR signaling and is generally associated with a more aggressive phenotype and poor prognosis. In contrast, low-OX40 expression tumors were more closely linked to the nonproliferation subclass, whose members are dominated by the activation of Wnt signaling, resemble normal hepatic physiology, and have a less aggressive phenotype. These results suggest that OX40 expression could be used to help define a subpopulation of HCC patients with distinct molecular and clinical features.
Wnt/β-catenin signaling plays an important role in the proliferation, maturation and differentiation of T cell and dendritic cells, but the role of tumor intrinsic Wnt signaling in immune microenvironment regulation has only recently emerged. Spranger et al. reported that constitutively high β-catenin activity could impair the anti-tumor immunity through defecting recruitment of dendritic cells.Citation41,42 This failed recruitment of dendritic cells was due to defective production of chemokine CCL4 by tumor intrinsic β-catenin activation. Increased β-catenin signaling can also impair dendritic cells function by upregulation of IL-12 production.Citation43 However, evidence also proved that inhibition of Wnt signaling in tumor cells could induce proliferative quiescence which enabled the tumor cells to evade the innate immunity,Citation44 adding to the complexity of this topic. Our results linked decreased proportion of Wnt/β-catenin mutations with high-OX40 expression in HCC, suggesting an immunosuppression microenvironment in tumor with decreased activity of the Wnt/β-catenin signaling.
OX40 has inconsistent prognostic significance across cancers, indicating superior prognosis in melanoma, lung cancer and colorectal cancer,Citation45–47 but inferior prognosis in cutaneous squamous cell carcinoma.Citation48 Our results from multiple datasets indicated that OX40 is an independent predictor of survival, with low-OX40 expression predicting longer survival, in patients with HCC. Given the size of the datasets and the set of factors included in the multivariate analysis, the current study provides reliable evidence of the prognostic significance of OX40 in HCC. In addition, CD8 and CD68 also had independent prognostic significance in multiple datasets, whereas PD-1, TIM-3, and LAG3 did not. High-PD-L1 expression in immune cells was associated with poor survival in the WCH set. However, the absence of the prognostic significance of these markers may not limit their potential roles as predictive biomarkers for immunotherapy. Our study is limited by the number of immune markers analyzed; interrogation of more immune-related markers could potentially yield more prognostic markers for clinical use. Another limitation is the retrospective design of the study.
Our study raised several questions for future research. Does tumor intrinsic mutation contribute to the immunosuppression in HCC? Is there any interplay between the OX40 and the dysregulated cytokines (receptors) and how this impacts the HCC immune microenvironment? Can these prognostic immune markers be incorporated with standard prognostic variables (e.g. BCLC staging system) and improve the prognostic significance of the existing criteria in HCC? Can targeting rather than triggering OX40 improve clinical outcome in HCC?
In summary, this study demonstrates that OX40 is differentially expressed in HCC and normal liver tissue. High-OX40 expression is associated with a more aggressive phenotype, the activation of multiple immunosuppressive pathways, and a distinct mutational signature. OX40, together with CD8 and CD68, are independent prognostic factors in HCC patients. This study highlights the immunosuppressive burden conveyed by HCC with high-OX40 expression and justifies modifying these factors to improve immunotherapy for HCC.
Disclosure of potential conflicts of interest
No potential conflicts of interest were disclosed.
2017ONCOIMM0630R1-f02-z-4c.docx
Download MS Word (9.6 MB)Acknowledgments
We thank the TCGA working group for generating publicly available data.
Additional information
Funding
References
- Llovet JM, Zucman-Rossi J, Pikarsky E, Sangro B, Schwartz M, Sherman M, Gores G. Hepatocellular carcinoma. Nat Rev Dis Primers. 2016;2:16018. doi:10.1038/nrdp.2016.18. PMID:27158749.
- Cheng AL, Kang YK, Chen Z, Tsao CJ, Qin S, Kim JS, Luo R, Feng J, Ye S, Yang TS, et al. Efficacy and safety of sorafenib in patients in the Asia-Pacific region with advanced hepatocellular carcinoma: a phase III randomised, double-blind, placebo-controlled trial. Lancet Oncol. 2009;10:25–34. doi:10.1016/S1470-2045(08)70285-7. PMID:19095497.
- Llovet JM, Ricci S, Mazzaferro V, Hilgard P, Gane E, Blanc JF, de Oliveira AC, Santoro A, Raoul JL, Forner A, et al. Sorafenib in advanced hepatocellular carcinoma. N Engl J Med. 2008;359:378–390. doi:10.1056/NEJMoa0708857. PMID:18650514.
- Rizvi NA, Mazieres J, Planchard D, Stinchcombe TE, Dy GK, Antonia SJ, Horn L, Lena H, Minenza E, Mennecier B, et al. Activity and safety of nivolumab, an anti-PD-1 immune checkpoint inhibitor, for patients with advanced, refractory squamous non-small-cell lung cancer (CheckMate 063): a phase 2, single-arm trial. Lancet Oncol. 2015;16:257–265. doi:10.1016/S1470-2045(15)70054-9. PMID:25704439.
- Brahmer JR, Tykodi SS, Chow LQ, Hwu WJ, Topalian SL, Hwu P, Drake CG, Camacho LH, Kauh J, Odunsi K, et al. Safety and activity of anti-PD-L1 antibody in patients with advanced cancer. N Engl J Med. 2012;366:2455–2465. doi:10.1056/NEJMoa1200694. PMID:22658128.
- Topalian SL, Taube JM, Anders RA, Pardoll DM. Mechanism-driven biomarkers to guide immune checkpoint blockade in cancer therapy. Nat Rev Cancer. 2016;16:275–287. doi:10.1038/nrc.2016.36. PMID:27079802.
- Calderaro J, Rousseau B, Amaddeo G, Mercey M, Charpy C, Costentin C, Luciani A, Zafrani ES, Laurent A, Azoulay D, et al. Programmed death ligand 1 expression in hepatocellular carcinoma: Relationship with clinical and pathological features. Hepatology. 2016;64:2038–2046. doi:10.1002/hep.28710. PMID:27359084.
- Harding JJ, El Dika I, Abou-Alfa GK. Immunotherapy in hepatocellular carcinoma: Primed to make a difference? Cancer. 2016;122:367–377. doi:10.1002/cncr.29769. PMID:26540029.
- Sideras K, Biermann K, Verheij J, Takkenberg BR, Mancham S, Hansen BE, Schutz HM, de Man RA, Sprengers D, Buschow SI, et al. PD-L1, Galectin-9 and CD8+ tumor-infiltrating lymphocytes are associated with survival in hepatocellular carcinoma. Oncoimmunology. 2017;6:e1273309. doi:10.1080/2162402X.2016.1273309. PMID:28344887.
- Chen CL, Pan QZ, Zhao JJ, Wang Y, Li YQ, Wang QJ, Pan K, Weng DS, Jiang SS, Tang Y, et al. PD-L1 expression as a predictive biomarker for cytokine-induced killer cell immunotherapy in patients with hepatocellular carcinoma. Oncoimmunology. 2016;5:e1176653. doi:10.1080/2162402X.2016.1176653. PMID:27622026.
- Ward-Kavanagh LK, Lin WW, Sedy JR, Ware CF. The TNF receptor superfamily in Co-stimulating and Co-inhibitory responses. Immunity. 2016;44:1005–1019. doi:10.1016/j.immuni.2016.04.019. PMID:27192566.
- Piconese S, Timperi E, Pacella I, Schinzari V, Tripodo C, Rossi M, Guglielmo N, Mennini G, Grazi GL, Di Filippo S, et al. Human OX40 tunes the function of regulatory T cells in tumor and nontumor areas of hepatitis C virus-infected liver tissue. Hepatology. 2014;60:1494–1507. doi:10.1002/hep.27188. PMID:24756990.
- Camp RL, Dolled-Filhart M, Rimm DL. X-tile: a new bio-informatics tool for biomarker assessment and outcome-based cut-point optimization. Clin Cancer Res. 2004;10:7252–7259. doi:10.1158/1078-0432.CCR-04-0713. PMID:15534099.
- Lee JS, Heo J, Libbrecht L, Chu IS, Kaposi-Novak P, Calvisi DF, Mikaelyan A, Roberts LR, Demetris AJ, Sun Z, et al. A novel prognostic subtype of human hepatocellular carcinoma derived from hepatic progenitor cells. Nat Med. 2006;12:410–416. doi:10.1038/nm1377. PMID:16532004.
- McShane LM, Altman DG, Sauerbrei W, Taube SE, Gion M, Clark GM. Reporting recommendations for tumor marker prognostic studies. J Clin Oncol. 2005;23:9067–9072. doi:10.1200/JCO.2004.01.0454. PMID:16172462.
- Zheng C, Zheng L, Yoo JK, Guo H, Zhang Y, Guo X, Kang B, Hu R, Huang JY, Zhang Q, et al. Landscape of infiltrating T cells in liver cancer revealed by single-cell sequencing. Cell 2017;169:1342–1356. e1316. doi:10.1016/j.cell.2017.05.035. PMID:28622514.
- Budhu A, Wang XW. The role of cytokines in hepatocellular carcinoma. J Leukocyte Biol. 2006;80:1197–1213. doi:10.1189/jlb.0506297. PMID:16946019.
- Marra F, Tacke F. Roles for chemokines in liver disease. Gastroenterology. 2014;147:577–594. e571. doi:10.1053/j.gastro.2014.06.043. PMID:25066692.
- Chan CF, Yau TO, Jin DY, Wong CM, Fan ST, Ng IO. Evaluation of nuclear factor-kappaB, urokinase-type plasminogen activator, and HBx and their clinicopathological significance in hepatocellular carcinoma. Clin Cancer Res. 2004;10:4140–4149. doi:10.1158/1078-0432.CCR-03-0574. PMID:15217951.
- Zhou SL, Zhou ZJ, Hu ZQ, Huang XW, Wang Z, Chen EB, Fan J, Cao Y, Dai Z, Zhou J. Tumor-associated neutrophils recruit macrophages and T-regulatory cells to promote progression of hepatocellular carcinoma and resistance to Sorafenib. Gastroenterology. 2016;150:1646–1658. e1617. doi:10.1053/j.gastro.2016.02.040. PMID:26924089.
- Shi JY, Yang LX, Wang ZC, Wang LY, Zhou J, Wang XY, Shi GM, Ding ZB, Ke AW, Dai Z, et al. CC chemokine receptor-like 1 functions as a tumour suppressor by impairing CCR7-related chemotaxis in hepatocellular carcinoma. J Pathol. 2015;235:546–558. doi:10.1002/path.4450. PMID:25255875.
- Ye LY, Chen W, Bai XL, Xu XY, Zhang Q, Xia XF, Sun X, Li GG, Hu QD, Fu QH, et al. Hypoxia-induced Epithelial-to-Mesenchymal transition in hepatocellular carcinoma induces an immunosuppressive tumor microenvironment to promote metastasis. Cancer Res. 2016;76:818–830. doi:10.1158/0008-5472.CAN-15-0977. PMID:26837767.
- Xu HX, Zhu XD, Zhuang PY, Zhang JB, Zhang W, Kong LQ, Wang WQ, Liang Y, Wu WZ, Wang L, et al. Expression and prognostic significance of placental growth factor in hepatocellular carcinoma and peritumoral liver tissue. Int J Cancer. 2011;128:1559–1569. doi:10.1002/ijc.25492. PMID:20521248.
- Yang JD, Nakamura I, Roberts LR. The tumor microenvironment in hepatocellular carcinoma: current status and therapeutic targets. Semin Cancer Biol. 2011;21:35–43. doi:10.1016/j.semcancer.2010.10.007. PMID:20946957.
- Zimmerman JW, Pennison MJ, Brezovich I, Yi N, Yang CT, Ramaker R, Absher D, Myers RM, Kuster N, Costa FP, et al. Cancer cell proliferation is inhibited by specific modulation frequencies. Br J Cancer. 2012;106:307–313. doi:10.1038/bjc.2011.523. PMID:22134506.
- Rooney MS, Shukla SA, Wu CJ, Getz G, Hacohen N. Molecular and genetic properties of tumors associated with local immune cytolytic activity. Cell. 2015;160:48–61. doi:10.1016/j.cell.2014.12.033. PMID:25594174.
- Zucman-Rossi J, Villanueva A, Nault JC, Llovet JM. Genetic landscape and biomarkers of hepatocellular carcinoma. Gastroenterology. 2015;149:1226–1239. e1224. doi:10.1053/j.gastro.2015.05.061. PMID:26099527.
- Woods DM, Ramakrishnan R, Sodré AL, Berglund A, Weber J. Abstract A067: PD-1 blockade enhances OX40 expression on regulatory T-cells and decreases suppressive function through induction of phospho-STAT3 signaling. Cancer Immunology Research. 2016;4(11 Supplement):A067–A067. AACR.
- Bulliard Y, Jolicoeur R, Zhang J, Dranoff G, Wilson NS, Brogdon JL. OX40 engagement depletes intratumoral Tregs via activating FcγRs, leading to antitumor efficacy. Immunol Cell Biol. 2014;92:475–480. doi:10.1038/icb.2014.26. PMID:24732076.
- Voo KS, Foglietta M, Percivalle E, Chu F, Nattamai D, Harline M, Lee ST, Bover L, Lin HY, Baladandayuthapani V, et al. Selective targeting of Toll-like receptors and OX40 inhibit regulatory T-cell function in follicular lymphoma. Int J Cancer. 2014;135:2834–2846. doi:10.1002/ijc.28937. PMID:24771328.
- Spranger S, Spaapen RM, Zha Y, Williams J, Meng Y, Ha TT, Gajewski TF. Up-regulation of PD-L1, IDO, and Tregs in the melanoma tumor microenvironment is driven by CD8+ T cells. Sci Translational Med. 2013;5:200ra116–200ra116. doi:10.1126/scitranslmed.3006504.
- Garnelo M, Tan A, Her Z, Yeong J, Lim CJ, Chen J, Lim KH, Weber A, Chow P, Chung A, et al. Interaction between tumour-infiltrating B cells and T cells controls the progression of hepatocellular carcinoma. Gut. 2017;66:342–351. doi:10.1136/gutjnl-2015-310814. PMID:26669617.
- Kalathil SG, Thanavala Y. High immunosuppressive burden in cancer patients: a major hurdle for cancer immunotherapy. Cancer Immunol Immunother. 2016;65:813–819. doi:10.1007/s00262-016-1810-0. PMID:26910314.
- Pedroza-Gonzalez A, Zhou G, Vargas-Mendez E, Boor PP, Mancham S, Verhoef C, Polak WG, Grunhagen D, Pan Q, Janssen H, et al. Tumor-infiltrating plasmacytoid dendritic cells promote immunosuppression by Tr1 cells in human liver tumors. Oncoimmunology. 2015;4:e1008355. doi:10.1080/2162402X.2015.1008355. PMID:26155417.
- Yan W, Liu X, Ma H, Zhang H, Song X, Gao L, Liang X, Ma C. Tim-3 fosters HCC development by enhancing TGF-beta-mediated alternative activation of macrophages. Gut. 2015;64:1593–1604. doi:10.1136/gutjnl-2014-307671. PMID:25608525.
- Piconese S, Barnaba V. Stability of regulatory T cells undermined or endorsed by different Type-1 cytokines. Adv Exp Med Biol. 2015;850:17–30. doi:10.1007/978-3-319-15774-0_2. PMID:26324343.
- Piconese S, Pittoni P, Burocchi A, Gorzanelli A, Care A, Tripodo C, Colombo MP. A non-redundant role for OX40 in the competitive fitness of Treg in response to IL-2. Eur J Immunol. 2010;40:2902–2913. doi:10.1002/eji.201040505. PMID:20806292.
- Turley SJ, Cremasco V, Astarita JL. Immunological hallmarks of stromal cells in the tumour microenvironment. Nat Rev Immunol. 2015;15:669–682. doi:10.1038/nri3902. PMID:26471778.
- Nishikawa H, Sakaguchi S. Regulatory T cells in cancer immunotherapy. Curr Opin Immunol. 2014;27:1–7. doi:10.1016/j.coi.2013.12.005. PMID:24413387.
- Schulze K, Nault JC, Villanueva A. Genetic profiling of hepatocellular carcinoma using next-generation sequencing. J Hepatol. 2016;65:1031–1042. doi:10.1016/j.jhep.2016.05.035. PMID:27262756.
- Spranger S, Bao R, Gajewski TF. Melanoma-intrinsic beta-catenin signalling prevents anti-tumour immunity. Nature. 2015;523:231–235. doi:10.1038/nature14404. PMID:25970248.
- Spranger S, Gajewski TF. Tumor-intrinsic oncogene pathways mediating immune avoidance. Oncoimmunology. 2016;5:e1086862. doi:10.1080/2162402X.2015.1086862. PMID:27141343.
- Yaguchi T, Goto Y, Kido K, Mochimaru H, Sakurai T, Tsukamoto N, Kudo-Saito C, Fujita T, Sumimoto H, Kawakami Y. Immune suppression and resistance mediated by constitutive activation of Wnt/beta-catenin signaling in human melanoma cells. J Immunol. 2012;189:2110–2117. doi:10.4049/jimmunol.1102282. PMID:22815287.
- Malladi S, Macalinao DG, Jin X, He L, Basnet H, Zou Y, de Stanchina E, Massague J. Metastatic latency and immune evasion through autocrine inhibition of WNT. Cell. 2016;165:45–60. doi:10.1016/j.cell.2016.02.025. PMID:27015306.
- Petty JK, He K, Corless CL, Vetto JT, Weinberg AD. Survival in human colorectal cancer correlates with expression of the T-cell costimulatory molecule OX-40 (CD134). Am J Surg. 2002;183:512–518. doi:10.1016/S0002-9610(02)00831-0. PMID:12034383.
- Ladanyi A, Somlai B, Gilde K, Fejos Z, Gaudi I, Timar J. T-cell activation marker expression on tumor-infiltrating lymphocytes as prognostic factor in cutaneous malignant melanoma. Clin Cancer Res. 2004;10:521–530. doi:10.1158/1078-0432.CCR-1161-03. PMID:14760073.
- Massarelli E, Parra ER, Rogriguez-Canales J, Behrens C, Diao L, Blando J, Wang J, Byers LA, Wistuba II, Sharma P. Abstract A084: High OX-40 expression on the tumor immune infiltrate is a prognostic factor of better survival in non-small cell lung cancer. Cancer Immunology Research, 2016;4(11 Supplement):A084–A084. AACR.
- Lai C, August S, Albibas A, Behar R, Cho SY, Polak ME, Theaker J, MacLeod AS, French RR, Glennie MJ, et al. OX40+ regulatory T cells in cutaneous squamous cell carcinoma suppress effector T-cell responses and associate with metastatic potential. Clin Cancer Res. 2016;22:4236–4248. doi:10.1158/1078-0432.CCR-15-2614. PMID:27034329.