
ABSTRACT
Background: Tumor microenvironment may have a key role in providing immunological markers that can help predict clinical response to treatment with checkpoint inhibitors. We investigated whether the baseline expression of PD-L1 in advanced melanoma patients treated with ipilimumab may correlate with clinical outcome.
Methods: PD-L1 expression was assessed in 114 patients with advanced melanoma treated with ipilimumab and, in a cohort of 77 patients, a comprehensive assessment using multispectral imaging to assess the presence and distribution of CD3+, CD8+, CD163+, FOXP3+ and PD-L1+ cells inside and at periphery of the tumor was performed.
Results: PD-L1 status alone was not a predictive biomarker for response or survival. There was an association between clinical benefit from ipilimumab therapy with the coexistence of low densities of CD8+ and high densities of CD163+ PD-L1+ cells at the periphery of the tumor.
Conclusions: To explain the association of this peculiar microenvironment with clinical benefit from ipilimumab, we proposed a model where baseline CD8 cells levels are low due to inhibitory effect of Tregs and to pro-tumor activity of TAM M2 (CD163+ PD-L1+ cells). Ipilimumab treatment causes a decrease of Treg cells, mediated by ADCC from macrophages, with a concomitant change in TAM polarization that switches from M2 to M1 with a subsequent attraction of CD8 cells and the increase of antitumor response.
Background
The immune system has a crucial role in melanoma, with substantial evidence supporting the role of immune populations in tumor immunoediting.Citation1 Inhibitory checkpoints are used to regulate T-cell activation and consequently modulate immune responses. Immunotherapy has long been recognized as a promising approach to anticancer treatmentCitation2 and recent discoveries in basic immunology have resulted in the development of novel immunomodulating agents, including those that target specific immune regulatory checkpoints.Citation3 In particular, two immune inhibitory molecules that have been extensively studied are cytotoxic T-lymphocyte-associated antigen-4 (CTLA-4) and programed death-1 (PD-1). CTLA-4 is expressed after the binding of B7 molecules on antigen-presenting cells (APCs) to the CD28 receptor on naïve T cells and helps to extinguish the immune activator signal induced by B7 and CD28.Citation4 PD-1 is a co-receptor expressed on activated and exhausted T and B cells that negatively regulates T cell activation. PD-1 interacts with two ligands: B7-H1 (PD-L1), the main mediator of the immunosuppressive response, and B7-H2 (PD-L2). Binding of PD-1 by its ligands leads to T-cell inactivation and inhibition of effector function.Citation5,Citation6
Tumor cells can use these physiological checkpoints in their favor and, in addition, many tumor cells can increase expression of PD-L1 in response to secretion of interferon (IFN)-γ by tumor-reactive T cells infiltrating the tumor, increasing these inhibitory molecules precisely at sites of effector T cell attack.Citation7,Citation8 From this evidence was born the idea that specific antibodies directed to suppress this increased inhibition of the immune system in the cancer microenvironment could reinvigorate T cells and mediate cancer eradication by preventing the inactivation of an effector anti-tumor immune response.Citation9
Ipilimumab, a monoclonal antibody (IgG1) directed against CTLA-4, is able to restore the co-stimulatory activity of CD28, thereby increasing the number of activated T cells that can migrate to the tumor and mediate therapeutic effects. It was the first immunotherapy for metastatic melanoma to show a benefit in overall survival (OS) in a randomized phase III trial.Citation10 However, a major limitation of ipilimumab is the lack of a prognostic marker that can identify the 20% of patients likely to benefit from treatment, as the expression of the drug target (CTLA-4) at the tumor site does not appear to be able to predict response.Citation11
Other immunomodulating antibodies, such as nivolumab, target the PD-1/PD-L1 pathway and reactivate T cell-mediated and innate anti-tumor immunity,Citation12 thereby eliciting objective responses in a substantial percentage of patients with melanoma.Citation13 In contrast to CTLA-4, PD-L1 expression on tumor cells in patients with melanoma or non-small cell lung cancer (NSCLC) does offer a clinically relevant predictive marker of response to therapy.Citation14,Citation15
Unfortunately, the absence of biomarkers that may predict treatment response to ipilimumab, as monotherapy or in combination, remains a major limitation in the management of patients with melanoma.Citation16 However, recent appreciation of the importance of the relative frequencies of antitumoral effector immune cells (CD8+ lymphocytes) to their inhibitors, specifically cells expressing FoxP3 and PD-L1 within and at the periphery of the tumor, suggests that careful evaluation of the host-immune reaction to melanoma may be a critical element in predicting response. Thus, the local tumor microenvironment may be the key in providing molecular or immunological markers that predict clinical response to different treatments. As such, identifying specific biomarker patterns may result in effective treatment allocation.
Given the role of PD-L1 expression in treatment with anti-PD-1/PD-L1 inhibitors and based on the premise that CTLA-4 and PD-L1 play different but complementary roles in the regulation of adaptive immunity, we retrospectively investigated whether the expression of PD-L1 could predict response to ipilimumab treatment by evaluating possible correlations between baseline levels of PD-L1 and clinical outcomes in a cohort of melanoma patients. Baseline characteristic of the tumor microenvironment were also evaluated for a predictive/prognostic role.
Methods
Patients, treatment and clinical assessment
From June 2010 to January 2013, 114 patients with advanced-stage IV melanoma received ipilimumab monotherapy as part of an Expanded Access Program (EAP)Citation17 at the National Cancer Institute “G. Pascale” in Naples, Italy. The study was approved by the internal ethics board of the National Cancer Institute “G. Pascale” and all patients provided written informed consent at time of biopsy. All patients were treated with ipilimumab 3 mg/kg administered intravenously over 90 minutes, every 3 weeks for four doses. Disease evaluation was performed at baseline and after completion of induction therapy using immune-related response criteria (irRC).Citation18 Clinical response was defined as immune-related complete response (CR), partial response (PR), stable disease (SD) or progressive disease. Immune-related disease control rate (DCR) was defined as an CR, PR or SD lasting ≥3 months.
Immunohistochemistry
FFPE (formalin-fixed, paraffin-embedded) tissue blocks of melanoma biopsies performed (from 2005 to 2011) were retrieved from the pathology archives at the National Cancer Institute “G. Pascale”. Approximately 200 FFPE samples were collected from 114 patients with metastatic melanoma, all of whom were subsequently treated with ipilimumab.Citation19 Baseline PD-L1 expression was measured by means of immunohistochemical (IHC) testing of FFPE tumor sections with the use of a rabbit monoclonal anti-human PD-L1 antibody (clone 28-8) and an automated assay developed by Dako. PD-L1 expression quantification and a re-review of the tumor histology were independently performed by two pathologists with extensive experience with the Dako assay. All standard IHC assessments of PD-L1 were performed by Dako. The assay quantitatively assessed PD-L1 expression on the surface of tumor cells only, although expression of PD-L1 on tumor-associated lymphocytes and macrophages was qualitatively described as either present or absent.Citation20 The percentage of tumor cell surface marker expression was correlated with clinical outcomes.
Multispectral imaging
Sections (4 µm thickness) of FFPE blocks identified above were prepared and stained using antibodies specific for CD3, CD8, CD163, PD-L1 and FoxP3. Antibody staining was visualized using the PerkinElmer Opal™ kit following the recently reported protocol.Citation21 Slides were scanned using a PerkinElmer Vectra® and resulting images were evaluated using PerkinElmer InForm® software. InForm® software was used to characterize cell populations for multiple markers. The software was also used to count cells in areas of the invasive margin or center of the tumor and to assess relative ratios of cell populations.
Statistical analysis
The association between overall response and PD-L1 expression was evaluated with the chi-square test. Survival curves were estimated by the Kaplan-Meier method and the log-rank test was used to investigate differences between groups. Results from this retrospective study should mainly be considered as exploratory, so no correction for multiple testing was applied. All analyses were performed with the IBM-SPSS statistical software v. 21.0. Unsupervised hierarchical clustering analysis was performed using the TIBCO Spotfire®, UPGMA clustering method.
Results
Patient characteristics and efficacy
The medium age of the 114 patients was 61 years (range 25–90) and there were equal numbers of male and female patients (n = 57). The majority of patients (n = 66, 57.9%) were BRAF V600E negative; 37 (32.5%) were BRAF V600E positive and 11 (9.6%) had an unknown BRAF status. Eight patients were NRAS mutation positive. Fifteen patients (13.1%) had received no previous treatment, 83 (72.8%) had received one previous treatment, while the remaining 16 (14.1%) had received two treatments. None had received three or more previous therapies. The most frequent previous therapies were vemurafenib (n = 25), cisplatin plus temozolomide (n = 24), dacarbazine (n = 23), fotemustine (n = 9), temozolamide (n = 8), binimetinib (n = 6), bleomycin plus electroporation (n = 6) and dabrafenib (n = 5). A total of 75 (65.8%) patients had received four cycles of ipilimumab, 16 (14.0%) patients received three cycles (two stopped at the third cycle because of toxicity), 14 (12.3%) received two cycles and nine (7.9%) received just a single cycle; one patient was not evaluable due to a rapid disease progression. Immuno-related DCR was 23% (n = 25); 11 patients achieved a complete response (CR; 10.1%), four patients had partial responses (PR; 3.7%), and 10 patients maintained stable disease (SD; 9.2%) while 84 patients had progressive disease (PD; 77%).
Correlation of PD-L1 expression with response and overall survival
PD-L1 expression by standard IHC analysis was evaluable for 109 patients: 52 biopsies were from lymph nodes, 45 from skin, six from subcutaneous tissue and one from each of the spleen, muscle, liver, gallbladder, bowel and brain. FFPE tissue blocks of melanoma biopsies were obtained on patients up to 72 months prior to initiation of ipilimumab; 67 were from 1–12 months, 21 from 13–24 months, and 16 from 25–72 months (5 unknown).
Response to ipilimumab by PD-L1 status is shown in . Using a 5% PD-L1 tumor cell expression threshold value to define status, patients with negative PD-L1 expression had 10.2% CR, 2.3% PR, 11.4% SD and 76.1% PD, while PD-L1-positive patients had 9.5% CR, 9.5% PR, 0% SD and 81% PD (p = 0.18). Using a 1% PD-L1 tumor expression cut-off, patients with negative PD-L1 expression had 10.8% CR, 2.7% PR, 12.2% SD and 74.3% PD while patients with positive PD-L1 expression had 8.6% CR, 5.7% PR, 2.9% SD and 82.9% PD (p = 0.37). Thus, no significant correlation between the levels of PD-L1 and overall response were observed using either a 5% or a 1% tumor cell expression threshold to define PD-L1 expression status.
Table 1. Correlation between PD-L1 status and overall response (OR).
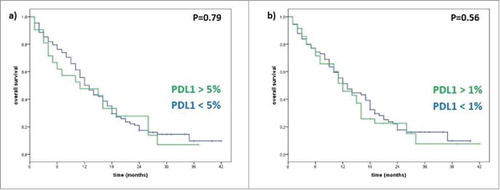
With regard to survival, median OS was 11 months for patients with positive PD-L1 expression and 12 months (p = 0.79) for patients with negative PD-L1 expression when using a 5% PD-L1 tumor expression cut-off. Using a 1% PD-L1 tumor expression threshold, median OS for PD-L1 positive patients was 12 months, versus 13 months for patients with negative PD-L1 expression (p = 0.56). Thus, no statistically significant difference between the two groups of patients was observed with no correlation between PD-L1 status and OS ().
Figure 1. Correlation between PD-L1 status and Overall Survival (OS). (a) Using 5% PD-L1 tumor cells expression cut-off to define negative/positive status, for patient >5% the median OS is 11 months, meanwhile for patients <5% the median OS is 12 months (p-value 0.79). (b) Using 1% PD-L1 tumor cells expression cut-off to define negative/positive status, for patient >1% the median OS is 12 months, meanwhile for patients <1% the median OS is 13 months (p-value 0.56).
Baseline PD-L1 expression was further evaluated by factoring in the site of origin of the tumor sample and comparing nodal and skin melanoma excisions (Supplementary Fig. S1). In nodal excisions, based on 5% tumor expression, median OS was 11 months for PD-L1 negative patients and 5 months for PD-L1 positive patients (p = 0.86). Using 1% tumor expression, there was a median OS of 11 months in both groups (p = 0.92). In skin excisions, there was a median OS of 14 versus 15 months for PD-L1 negative patients and PD-L1 positive patients (p = 0.76) when using a 5% tumor expression threshold, while median OS was 16 months for PD-L1 negative patients and 14 months for PD-L1 positive patients (p = 0.73) using a 1% threshold. No clear correlations between the levels of PD-L1 in these two different sites of tumor involvement and OS were identified.
The possibility that time between biopsy/resection and start of ipilimumab treatment may have an effect on the correlation between expression of PD-L1 in the tumor lesions and outcomes was also investigated. Impact of the time interval between time of the biopsy used for the assessment of PD-L1 status and beginning ipilimumab treatment was assessed by separately analyzing 6, 9 and 12 months' biopsy-therapy interval groups (Supplementary Fig. S2). Median OS was 12 versus 13 months for lesions excised ≤6 or >6 months before ipilimumab treatment (p = 0.61), 14 versus 12 months for lesions excised ≤9 or >9 months before (p = 0.45), and 14 versus 12 months for lesions excised ≤ 12 or >12 months before (p = 0.53). Thus, there was no evidence of a correlation between the time interval from excision of the evaluated tumor sample and the start of ipilimumab treatment and OS.
Impact of mutational status was evaluated by stratifying patients into three groups: BRAF wild-type (WT), BRAF V600E mutant, and NRAS-mutant (Supplementary Fig. S3). OS was 17 months for BRAF-WT, 11 months for BRAF V600E and 16 months for NRAS-mutant patients (p = 0.05). When these three groups were further stratified by PD-L1 status using a 5% cut-off, median OS was 26 months for BRAF-WT, 15 months for BRAF V600E and 5 months for NRAS-mutant in PD-L1 positive patients (p = 0.04). In PD-L1 negative patients, median OS was 14 months for BRAF-WT, 11 months for BRAF V600E and 18 months for NRAS-mutant groups (p = 0.21). Using 1% cut-off, median OS was 15 months for BRAF-WT, 10 months for BRAF V600E and 5 months for NRAS-mutant groups in PD-L1 positive patients (p = 0.07) and 13 months for BRAF-WT, 11 months for BRAF V600E and 18 months for NRAS-mutant groups in PD-L1 negative patients (p = 0.32). This analysis indicates that a positive PD-L1 status is associated with a better OS both for BRAF-WT and BRAF V600E mutant patients while a positive PD-L1 status in NRAS-mutant patients is associated with a worse OS. These findings were statistically significant in the NRAS-mutant group, with a better OS in negative PD-L1 patients, but the relevance of this association is limited due to the presence of only a few NRAS-mutant patients in this cohort.
Correlation of PD-L1 expression and other immune markers
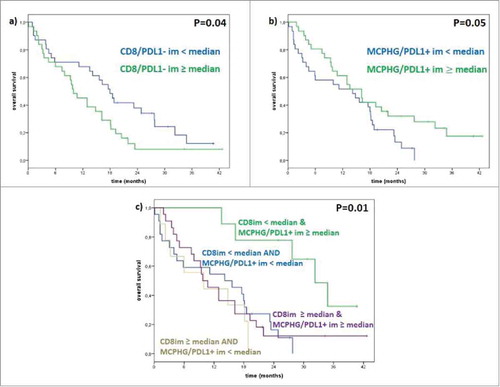
Density of CD8+ T cells was quantified and the median density number determined. Patients with lower than median number of CD8+ T cells had a significantly longer median OS than patients with higher numbers of CD8+ T cells (18 versus 10 months; p < 0.04) (). Patients that were at or above the median density for CD163+ macrophages expressing PD-L1+ had a significantly improved median OS compared to patients with a lower density of PD-L1+ macrophages (16 versus 14 months; p < 0.05). Interestingly, the cohort with the highest density of CD163+ PD-L1+ cells contained all of the long-term survivors. We also combined the evaluation of CD8+ T cell numbers at the invasive margin (< or ≥ median) with the evaluation of CD163+ PD-L1+ expressing cells (< or ≥ median); while the numbers were small, patients with less than the median number of CD8+ T cells at the invasive margin combined with higher numbers of CD163+ PD-L1+ at the invasive margin survived significantly longer after ipilimumab therapy than any other group (median OS of 32 months; p < 0.01).
Figure 2. Correlation between PD-L1 status with CD8 and CD163. (a) Median OS in patients with low CD8+/PD-L1- is 18 months and in patients with high CD8+/PD-L1- is 10 months (p-value 0.04); (b) median OS in patients with low CD163+PD-L1+ is 14 months and in patients with high CD163+PD-L1+ is 16 months (p-value 0.05); (c) median OS in patients with a low CD8+/PD-L1- and high CD163+/PD-L1+ in invasive margin is 32 months, in patients with a low CD8+/PD-L1- and low CD163+/PD-L1+ in invasive margin is 16 months in patients with a high CD8+/PD-L1- and high CD163+/PD-L1+ in invasive margin is 11 months, in patients with a high CD8+/PD-L1- and low CD163+/PD-L1+ in invasive margin is 6 months (p-value 0.01).
Ratio of CD8:FoxP3+ and CD8:PD-L1+ cells does not correlate with response
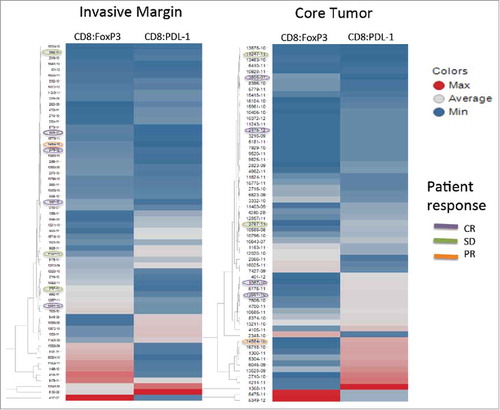
Recently we reported that the co-evaluation of CD8+ T cells, FoxP3+ cells and PD-L1+ cells using multispectral imaging allowed us to identify cell-cell relationships, specifically CD8:FoxP3 and CD8:PD-L1 ratios that, when analyzed using unsupervised hierarchical clustering algorithms, correlated with the ability to isolate tumor-reactive T cells from a viably processed piece of the same tissue used for multispectral imaging. Thus, we hypothesized that, by applying that strategy to the patients studied here, we might find a correlation between those ratios and objective response. As shown in , the unsupervised hierarchical clustering did not enrich for patients who experienced a response to ipilimumab. Unexpectedly, there were no objective responses in the patients with the highest ratios of CD8+:FoxP3 or CD8+:PD-L1.
Figure 3. Unsupervised hierarchical clustering. Unsupervised hierarchical clustering of CD8+:FoxP3+ and CD8+:PD-L1+ ratios for the invasive margin (left) and the center of the tumor (right). The color is a continuing spectrum with dark red indicating the maximum ratio and dark blue indicating the lowest ratio. Patient identifiers are shown to the right of each column with patients experiencing either a CR, PR or SD circled with the corresponding color.
Discussion
PD-L1 is a potential predictive biomarker of response to anti-PD-1 monotherapy in patients with advanced melanoma. Multiple anti-PD-1 studies have shown a better response rate in patients with positive PD-L1 expression compared with PD-L1 negative patients, although the limited value of a negative finding is well recognized. In fact, depending on the study, it appears that between 20–40% of melanoma patients that are defined as PD-L1 negative may experience benefits from anti-PD-1 therapy.Citation22
Based on the complementary roles of CTLA-4 and PD-L1 in regulating adaptive immunity, we evaluated whether there is a correlation between pre-treatment tumor expression of PD-L1 and ipilimumab-related outcomes. Our analysis shows that PD-L1 status does not correlate with and is not a predictive biomarker for response or survival in patients with advanced melanoma treated with ipilimumab monotherapy. These initial data suggest that the treatment outcome with ipilimumab is not influenced by the state of the immunological checkpoint operated by PD-L1, unlike in the case of treatment with anti-PD-1s. The finding is not entirely surprising, as ipilimumab and anti-PD-1 agents have different mechanisms of action and are believed to primarily act in two distinct immunological environments. Anti-PD1s such as nivolumab exert their action by interfering with checkpoints controlled by PD-L1 and PD-L2 during the effector phase of T cell-mediated tumor destruction and directly in the tumor microenvironment, while ipilimumab is thought to act primarily during the priming phase in peripheral immune compartments and possibly through an effect on regulatory T cells. Another factor that may help explain our findings is that PD-L1 is a protein expressed on the surface of cells whose expression can be influenced by several factors. In some cases, PD-L1 may be constitutively expressed, while in other cases its expression level may continuously vary, especially in tumor environments where the immune system provides multiple stresses.Citation23-Citation25
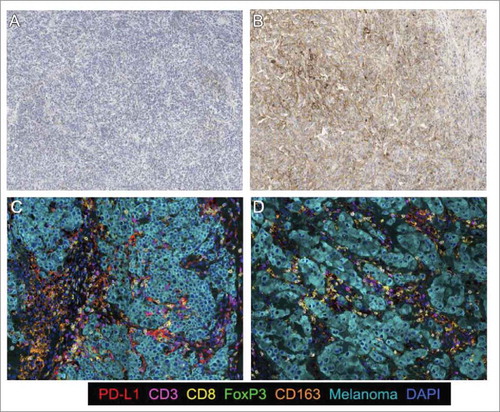
Preliminary data, obtained using an immunoprofiling approach, have shown the possibility that taking into consideration the distribution of immune populations in the melanoma microenvironment may provide useful information about the prediction of response to ipilimumab therapy.Citation19,Citation26 Based on our initial findings and, in view of the inability of PD-L1 expression to predict outcomes to ipilimumab therapy, we performed a comprehensive assessment of the tumor immune microenvironment using multispectral imaging to extend the analysis and capture the relationships and distribution of CD3+, CD8+, CD163+, FOXP3+ and PD-L1+ cells, expecting that a model incorporating more than one immunologic factor may better capture the complexities of the tumor microenvironment (). The findings of these analyses demonstrated an association between response to ipilimumab and the coexistence of low densities of CD8+ and high densities of CD163+ PD-L1+ cells at the tumor invasive margin.
Figure 4. Immunohistochemical stain for melanoma tumor samples. PD-L1 chromogenic staining. a) Tumor with low PD-L1 expression and b) Tumor with high PD-L1 expression; Multiplexed IHC for the following markers: PD-L1, CD3, CD8, FoxP3, CD163 and Melanoma cocktail and DAPI as a counterstain; c) Short survival (PD): high CD8/CD163PDL1 and CD8/FoxP3 expression. d) Long survival (CR): low CD8/CD163PDL1 and CD8/FoxP3 expression;
These results are somewhat surprising, as they differ from commonly observed relationships between CD8+ cells and outcomes, where higher densities of CD8+ cells, both intratumoral and at the invasive margin, are typically associated with better outcomes in many types of cancer.Citation27 Possible reasons for the discrepancy may include, among others, the nature of the cohort that consisted of patients with metastatic disease, who had failed other therapies and already successfully escaped immune surveillance, the biology of the response mechanism to ipilimumab and the possibility that different tumor compartments (intra- and peritumoral) may play different roles. Additionally, the length of the time interval between when the tumor sample was obtained and when the patient ultimately received ipilimumab, as well as the potential heterogeneity of the metastatic disease, could have contributed to these findings. Furthermore, the data differ from described relationships between response to anti-PD-1/PD-L1 therapies and effector T-cells at the invasive margin,Citation28 where high densities of T-cells, often associated with an adaptive expression of PD-L1, correlate with response to anti-PD-1/PD-L1 therapies.
These results are, however, compatible with previous findingsCitation29 which indicated that an increase of tumor-infiltrating lymphocytes (TILs) in the tumor from baseline to the third week of treatment with ipilimumab was related to a better outcome in patients and that baseline high expression of T-cell suppressive factors such as FoxP3 and IDO is associated with better outcomes with ipilimumab.Citation29 A possible mechanism underlying this paradoxical relationship could reflect the ability of ipilimumab to reverse FOXP3+ regulatory T cell-mediated active suppression of T-effector cells. In this model, the identified low CD8+ densities at the tumor invasive margin would represent a marker of a highly immunosuppressive microenvironment established and maintained by ongoing Treg mediated T-effector cell inhibition, while the high density of CD163+ macrophages would represent a marker of the potential reversibility of this inhibition via an antibody-dependent cell-mediated cytotoxicity (ADCC) macrophage ipilimumab-mediated depletion of FOXP3 ;T-effector suppressing Tregs. Of note, this model is consistent with the recent finding that ipilimumab responders have higher CD68+:CD163+ macrophage ratios at baseline in the tumor microenvironment and show decreased Treg infiltration after treatment as well as with the demonstration of ADCC-mediated lysis of Tregs via the engagement of FcγRIIIA expressing monocytes.Citation30
Novel proposals on the classification of the tumor based on TILs and different biomarker expression are currently being advanced.Citation27,Citation31 Among these is a model that classifies tumors in four groups based on the expression of PD-L1 and the presence or absence of TILs: adaptive immune resistance (PD-L1-positive and TIL-positive), immune ignorance (PD-L1-negative and no TIL), intrinsic induction (PD-L1-positive and no TIL), and immune tolerance (PD-L1-negative and TIL-positive).Citation32 Based on this framework, we have tried to propose a model that can explain our results ().
Figure 5. Model of tumor microenviroment (TME). Prior the ipilimumab treatment we have low levels of CD8 cells due to the inhibitory effect of Treg and powered by the pro tumor activity of tumor associated macrophages M2 (TAM M2). After treatment, we have a decrease of Treg, a change in TAM polarization that switch from M2 to M1, and a raise of CD8 cells that mediate an increase of antitumor response.
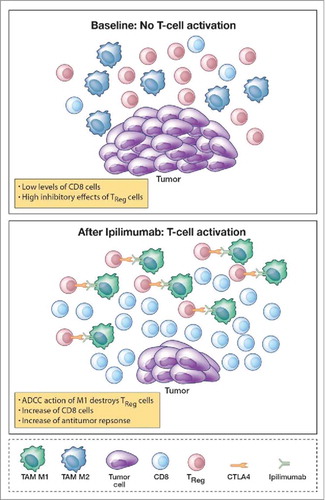
Prior to ipilimumab treatment, low levels of CD8+ cells are caused, in responders, by the inhibitory effects of Tregs and pro-tumoral tumor-associated macrophages M2 (TAM M2). Treatment with ipilimumab results in a decrease in Tregs and possibly a switch from M2 to M1 in TAM polarization.Citation33,Citation34 Possible mechanistic pathways mediating these effects, in addition to a direct ADCC macrophage ipilimumab-mediated depletion of FoxP3 T-effector suppressing Tregs, include the blockade of CTLA-4, directly inducing a down-regulation of Treg function and the increase of IFN-γ produced by CD4+ICOShi cells,Citation35 one of the actors that mediate the repolarization from TAM M2 phenotypes to TAM M1 phenotypes.Citation36 These events, induced by ipilimumab treatment, may ultimately mediate an increased antitumor response due to an increase in the number of CD8 T cells and M1 macrophages that drive the antitumor effect.
Due to the limitations in the current study, which was based on a retrospective cohort and assessment of pre-treatment tumor samples only, which were often obtained a considerable time before the initiation of ipilimumab therapy, confirmation of this model is required in prospective studies and through the analysis of mechanistic models. The findings highlight, however, the inability of PD-L1 expression alone to predict outcomes in ipilimumab-treated patients, the unique biology of the CTLA-4 immune checkpoint, and the urgent need for novel mechanism-driven comprehensive biomarkers assessment incorporating the immunoprofiling of the tumor microenvironment to guide rational checkpoint blockade therapy.Citation37,Citation38
Financial support
The study was supported by Bristol Myers Squibb with a dedicated fund coming from the BMS Immuno-oncology network.
Conflict of interest
Ester Simeone received honoraria from Bristol-Myers Squibb, Novartis and Roche Genentech. Ester Simeone had consultant/advisory role for Bristol-Myers Squibb. Antonio M. Grimaldi received honoraria from Bristol-Myers Squibb, Merck Sharp & Dohme, Novartis and Roche Genentech, and had consultant/advisory role for Merck Sharp & Dohme and Novartis. Paolo A Ascierto received research funding from Bristol-Myers Squibb, Roche-Genentech, Array Biopharma, and had consulting/advisory role for Bristol-Myers Squibb, Roche-Genentech, Merck Sharp & Dohme, Novartis, Array Biopharma, Amgen, Merck Serono, Pierre Fabre. Carlo B Bifulco had consultant/advisory role for Bristol-Myers Squibb. Bernie A Fox received research support from and served on advisory boards for BMS, PerkinElmer, Ventana-Roche and Definiens. The remaining authors declare no conflict of interest.
Statement of translational relevance
A major limitation of ipilimumab in the treatment of patients with advanced melanoma is the lack of a prognostic marker that can identify the 20% of patients likely to benefit from treatment, as the expression of the drug target (CTLA-4) at the tumor site does not appear to be able to predict response. In this retrospective analysis, PD-L1 status alone was not a predictive biomarker for response or survival to treatment with ipilimumab in patients with stage IV melanoma. However, there was an association between clinical benefit from ipilimumab therapy and the coexistence of low densities of CD8+ and high densities of CD163+ PD-L1+ cells at the periphery of the tumor. These data may contribute to the development of novel mechanism-driven comprehensive biomarkers assessments that incorporate immunoprofiling of the tumor microenvironment in order to help guide rational checkpoint blockade therapy.
Madonna_et_al._supplementary_figure__and_legend.pdf
Download PDF (379.7 KB)Acknowledgements
The authors extend special thanks to the International Immuno-Oncology Network (II-ON) of Bristol-Myers Squibb and Alessandra Trocino for providing excellent service and assistance.
Funding
Bristol-Myers Squibb (BMS), II-ON TM5
References
- Aris M, Barrio MM, Mordoh J. Lessons from cancer immunoediting in cutaneous melanoma. Clin Dev Immunol. 2012;2012:192719. doi:10.1155/2012/192719. PMID:22924051.
- Lesterhuis WJ, Haanen JB, Punt CJ. Cancer immunotherapy – revisited. Nat Rev Drug Discov. 2011;10:591–600. doi:10.1038/nrd3500. PMID:21804596.
- Ascierto PA, Marincola FM. What have we learned from cancer immunotherapy in the last 3 years? Journal of Translational Medicine. 2014;12:141. doi:10.1186/1479-5876-12-141. PMID:24886164.
- McCoy KD, Le Gros G. The role of CTLA-4 in the regulation of T cell immune responses. Immunol Cell Biol. 1999;77:1–10. doi:10.1046/j.1440-1711.1999.00795.x. PMID:10101680.
- Okazaki T, Honjo T. PD-1 and PD-1 ligands: from discovery to clinical application. Int Immunol. 2007;19:813–24. doi:10.1093/intimm/dxm057. PMID:17606980.
- Topalian SL, Drake CG, Pardoll DM. Targeting the PD-1/B7-H1(PD-L1) pathway to activate antitumor immunity. Curr Opin Immunol. 2012;24:207–12. doi:10.1016/j.coi.2011.12.009. PMID:22236695.
- Leach DR, Krummel MF, Allison JP. Enhancement of antitumor immunity by CTLA-4 blockade. Science 1996;271:1734–6. doi:10.1126/science.271.5256.1734. PMID:8596936.
- Dong H, Strome SE, Salomao DR, Tamura H, Hirano F, Flies DB, Roche PC, Lu J, Zhu G, Tamada K, et al. Tumor-associated B7-H1 promotes T-cell apoptosis a potential mechanism of immune evasion. Nat Med. 2002;8:793–800. doi:10.1038/nm0902-1039c. PMID:12091876.
- Pardoll DM. The blockade of immune checkpoints in cancer immunotherapy. Nat Rev Cancer. 2012, 22:252–64. doi:10.1038/nrc3239.
- Hodi FS, O'Day SJ, McDermott DF, Weber RW, Sosman JA, Haanen JB, et al. Improved survival with ipilimumab in patients with metastatic melanoma. N Engl J Med. 2010;363:711–23. doi:10.1056/NEJMoa1003466. PMID:20525992.
- Buchbinder EI, Desai A. CTLA-4 and PD-1 Pathways: Similarities, Differences, and Implications of Their Inhibition. Am J Clin Oncol. 2016;39:98–106. doi:10.1097/COC.0000000000000239. PMID:26558876.
- Topalian SL, Drake CG, Pardoll DM. Targeting the PD-1/B7-H1 (PD-L1) pathway to activate antitumor immunity. Curr Opin Immunol. 2012;24:207–12. doi:10.1016/j.coi.2011.12.009. PMID:22236695.
- Brahmer JR Drake CG, Wollner I, Powderly JD, Picus J, Sharfman WH, Stankevich E, Pons A, Salay TM, McMiller TL, et al. Phase I study of single-agent anti-programmed death-1 (MDX-1106) in refractory solid tumors: safety, clinical activity, pharmacodynamics, and immunologic correlates. J Clin Oncol. 2010;28:3167–75. doi:10.1200/JCO.2009.26.7609. PMID:20516446.
- Carbognin L, Pilotto S, Milella M, Vaccaro V, Brunelli M, Caliò A, et al. Differential activity of nivolumab, pembrolizumab and MPDL3280░A according to the tumor expression of programmed death-ligand-1 (PD-L1): Sensitivity analysis of trials in melanoma, lung and genitourinary cancer. PLoS One. 2015;10:e0130142. doi:10.1371/journal.pone.0130142. PMID:26086854.
- Topalian SL, Sznol M, Brahmer JR, et al. Nivolumab (anti-PD-1; BMS-936558; ONO-4538) in patients with advanced solid tumors: Survival and long-term safety in a phase I trial. J Clin Oncol. 2013;31, suppl; p. 3002.
- Ascierto PA, Kalos M, Schaer DA, Callahan MK, Wolchok JD. Biomarkers for immunostimulatory monoclonal antibodies in combination strategies for melanoma and other tumor types. Clin Cancer Res. 2013;19:1009–20. doi:10.1158/1078-0432.CCR-12-2982. PMID:23460532.
- Simeone E, Gentilcore G, Giannarelli D, Grimaldi AM, Caracò C, Curvietto M, Esposito A, Paone M, Palla M, Cavalcanti E, et al. Immunological and biological changes during ipilimumab treatment and their potential correlation with clinical response and survival in patients with advanced melanoma. Cancer Immunol Immunother. 2014;63:675–83. doi:10.1007/s00262-014-1545-8. PMID:24695951.
- Wolchok JD, Hoos A, O'Day S, Weber JS, Hamid O, Lebbé C, Maio M, Binder M, Bohnsack O, Nichol G, et al. Guidelines for the evaluation of immune therapy activity in solid tumors: immune-related response criteria. Clin Cancer Res. 2009, 15:7412–20. doi:10.1158/1078-0432.CCR-09-1624. PMID:19934295.
- Bifulco C, Capone M, Feng Z, et al. MISIPI study: Melanoma ImmunoScore evaluation in patients treated with IPIlimumab. J Transl Med. 2014; 12(Suppl 1): P11. doi:10.1186/1479-5876-12-S1-P11..
- Wolchok JD, Kluger H, Callahan MK, Postow MA, Rizvi NA, Lesokhin AM, et al. Nivolumab plus ipilimumab in advanced melanoma. N Engl J Med. 2013;369:122–33. doi:10.1056/NEJMoa1302369. PMID:23724867.
- Feng Z, Puri S, Moudgil T, Wood W, Hoyt CC, Wang C, et al. Multispectral imaging of formalin-fixed tissue predicts ability to generate tumor-infiltrating lymphocytes from melanoma. J Immunother Cancer. 2015;3:47. doi:10.1186/s40425-015-0091-z. PMID:26500776.
- Festino L, Botti G, Lorigan P, Masucci GV, Hipp JD, Horak CE, Melero I, Ascierto PA. Cancer treatment with anti-PD-1/PD-L1 agents: Is PD-L1 expression a biomarker for patient selection? Drugs. 2016;76:925–45. doi:10.1007/s40265-016-0588-x. PMID:27229745.
- Sharma P, Allison JP. The future of immune checkpoint therapy. Science. 2015;348:56–61. doi:10.1126/science.aaa8172. PMID:25838373.
- Sharma P, Allison JP. Immune checkpoint targeting in cancer therapy: toward combination strategies with curative potential. Cell. 2015;161:205–14. doi:10.1016/j.cell.2015.03.030. PMID:25860605.
- Twyman-Saint\sVictor C, Rech AJ, Maity A, Rengan R, Pauken KE, Stelekati E, Benci JL, Xu B, Dada H, Odorizzi PM, et al. Radiation and dual checkpoint blockade activate non-redundant immune mechanisms in cancer. Nature. 2015;520:373–7. doi:10.1038/nature14292. PMID:25754329.
- Ascierto PA, Capone M, Urba WJ, Bifulco CB, Botti G, Lugli A, Marincola FM, Ciliberto G, Galon J, Fox BA. The additional facet of immunoscore: immunoprofiling as a possible predictive tool for cancer treatment. J Transl Med. 2013;11:54. doi:10.1186/1479-5876-11-54. PMID:23452415.
- Galon J, Mlecnik B, Bindea G, Angell HK, Berger A, Lagorce C, Lugli A, Zlobec I, Hartmann A, Bifulco C, et al. Towards the introduction of the ‘Immunoscore’ in the classification of malignant tumours. J Pathol. 2014;232:199–209. doi:10.1002/path.4287. PMID:24122236.
- Herbst RS, Soria JC, Kowanetz M, Fine GD, Hamid O, Gordon MS, Sosman JA, McDermott DF, Powderly JD, Gettinger SN, et al. Predictive correlates of response to the anti-PD-L1 antibody MPDL3280A in cancer patients. Nature. 2014;515:563–7. doi:10.1038/nature14011. PMID:25428504.
- Hamid O1, Schmidt H, Nissan A, Ridolfi L, Aamdal S, Hansson J, Guida M, Hyams DM, Gómez H, Bastholt L, et al. A prospective phase II trial exploring the association between tumor microenvironment biomarkers and clinical activity of ipilimumab in advanced melanoma. J Transl Med. 2011;9:204. doi:10.1186/1479-5876-9-204. PMID:22123319.
- Romano E, Kusio-Kobialka M, Foukas PG, Baumgaertner P, Meyer C, Ballabeni P, Michielin O, Weide B, Romero P, Speiser DE. Ipilimumab-dependent cell-mediated cytotoxicity of regulatory T cells ex vivo by nonclassical monocytes in melanoma patients. Proc Natl Acad Sci U S A. 2015;112:6140–5. doi:10.1073/pnas.1417320112. PMID:25918390.
- Taube JM, Anders RA, Young GD, Xu H, Sharma R, McMiller TL, Chen S, Klein AP, Pardoll DM, Topalian SL, et al. Colocalization of inflammatory response with B7-h1 expression in human melanocytic lesions supports an adaptive resistance mechanism of immune escape. Sci Transl Med. 2012;4:127ra37. doi:10.1126/scitranslmed.3003689. PMID:22461641.
- Teng MW, Ngiow SF, Ribas A, Smyth MJ. Classifying Cancers Based on T-cell Infiltration and PD-L1. Cancer Res. 2015;75:2139–45. doi:10.1158/0008-5472.CAN-15-0255. PMID:25977340.
- Sica A, Mantovani A. Macrophage plasticity and polarization: in vivo veritas. J Clin Invest. 2012;122:787–95. doi:10.1172/JCI59643. PMID:22378047.
- Wang YC, He F, Feng F, Liu XW, Dong GY, Qin HY, Hu XB, Zheng MH, Liang L, Feng L, et al. Notch signaling determines the M1 versus M2 polarization of macrophages in antitumor immune responses. Cancer Res. 2010;70:4840–9. doi:10.1158/0008-5472.CAN-10-0269. PMID:20501839.
- Liakou CI, Kamat A, Tang DN, Chen H, Sun J, Troncoso P, Logothetis C, Sharma P. CTLA-4 blockade increases IFNgamma-producing CD4+ICOShi cells to shift the ratio of effector to regulatory T cells in cancer patients. Proc Natl Acad Sci U S A. 2008;105:14987–92. doi:10.1073/pnas.0806075105. PMID:18818309.
- Wang N, Liang H, Zen K. Molecular mechanisms that influence the macrophage m1-m2 polarization balance. Front Immunol. 2014;5:614. doi:10.3389/fimmu.2014.00614. PMID:25506346.
- Topalian SL, Taube JM, Anders RA, Pardoll DM. Mechanism-driven biomarkers to guide immune checkpoint blockade in cancer therapy. Nat Rev Cancer. 2016;16:275–87. doi:10.1038/nrc.2016.36. PMID:27079802.
- Yuan J, Hegde PS, Clynes R, Foukas PG, Harari A, Kleen TO, Kvistborg P, Maccalli C, Maecker HT, Page DB, et al. Novel technologies and emerging biomarkers for personalized cancer immunotherapy. J Immunother Cancer. 2016;4:3. doi:10.1186/s40425-016-0107-3. PMID:26788324.