
ABSTRACT
The B16F10 murine melanoma cell line displays a low expression of MHC class I molecules favoring immune evasion and metastases in immunocompetent C57 BL/6 wild-type mice. Here, we generated metastases to the liver, an organ that is skewed towards immune tolerance, by intrasplenic injection of B16F10 cells in syngeneic C57 BL/6 compared to allogeneic Balb/c mice. Surprisingly, Balb/c mice, which usually display a pronounced M2 macrophage and Th2 T cell polarization, were ∼3 times more susceptible to metastasis than C57 BL/6 mice, despite a much higher M1 and Th1 T cell immune response. The anti-metastatic advantage of C57 BL/6 mice could be attributed to a more potent NK-cell mediated cytotoxicity against B16F10 cells. Our findings highlight the role of NK cells in innate anti-tumor immunity in the context of the liver – particularly against highly aggressive MHC I-deficient cancer cells. Moreover, the B16F10 model of melanoma liver metastasis is suited for developing novel therapies targeting innate NK cell related immunity in liver metastases and liver cancer.
Introduction
Metastases are key contributors to morbidity and mortality in cancer. Liver metastases in particular are limiting survival in a broad range of malignancies. In melanoma, liver metastasis frequently occurs during disease progression and is associated with a poor prognosis.Citation1
The immune system usually protects against carcinogenesis by immunosurveillance.Citation2 However, through a process known as immunoediting, malignant cells are first eliminated, then exist in equilibrium and finally escape the anti-tumor immune response.Citation3 In melanoma, the immune escape is facilitated by a tolerogenic, immunosuppressive tumor microenvironment which is constituted of regulatory T-cells (Tregs), myeloid derived suppressor cells (MDSC) and tumor-associated macrophages (TAM).Citation4,Citation5 Cancer immunotherapy aims at preventing or reversing such immunoediting and melanoma is generally considered to be a susceptible cancer entity.Citation6 Indeed, so called checkpoint inhibitors, which target PD1/PD-L1 or CTLA4, have recently achieved impressive responses in melanoma patients.Citation7 However, the immunology of cancer is far from being fully understood and only a fraction of patients responds to the currently available therapies which makes studies on (metastatic) melanoma a necessity.
One reason for the failure of checkpoint inhibitors in the treatment of some melanoma patients is a (strongly) reduced immunogenicity of the respective melanoma cells which prevents the induction of an effective adaptive immune response. Moreover, the immune system of the liver is usually primed for tolerance, e.g., towards neoantigens derived from nutrition.Citation8 In order to better understand the insufficient immune response to low immunogenic melanoma liver metastasis, we have employed the B16F10 cell line which has been derived from the melanoma of a C57 BL/6 mouse and which displays a highly metastatic potential in immunocompetent syngeneic mice.Citation9 This cell line has been used successfully for modeling human melanoma metastasis to skin and lung, and for anti-cancer drug development,Citation10-13 whereas liver metastasis has been little studied.Citation14,Citation15 Since the B16F10 cell line has a very low expression of MHC class I molecules,Citation16 it is predestined for studying the immunology of low immunogenic melanoma and cancer in general. An example is a recent analysis exploring a mutanome-based individualized peptide immunization which achieved in vivo tumor control in tumor transplant models.Citation17
To estimate the effectiveness of adaptive and innate immunity in such a setting, we challenged animals from two different immunocompetent wild-type mouse strains: syngeneic C57 BL/6 and allogeneic Balb/c mice that represent two extremes of a Th1 T cell/M1 macrophage and Th2 T cell/M2 macrophage weighted immune system, respectively.Citation18-20
Results
Liver and lung metastases in C57 BL/6 vs Balb/c mice
After intrasplenic injection of B16F10luc cells, both C57 BL/6 and Balb/c mice developed liver metastases (). While the metastatic burden was considerable in allogeneic Balb/c mice after injection of 100,000 cells, syngeneic C57 BL/6 mice required approximately 300,000 cells to reach equivalent levels (). The degree of metastasis was reflected by an increase in liver weight, an increase in the liver to body weight ratio and by a larger number of metastatic lesions counted on the liver surface. 14 days after injection, liver weight increased from 1.3 g (sham-treated animals) to 3.3 g in Balb/c mice and from 1.2 g to 3.5 g in C57 BL/6 mice, which had received 300,000 cells. Liver to body weight ratios increased as well: from 5.5 % to 10.9 % in Balb/c mice and from 4.4 % to 13.5 % in C57 BL/6 mice (300,000 cells). In C57 BL/6 mice which had received 100,000 cells, liver weight as well as liver to body weight ratios remained unchanged (1.2 g and 4.4%, respectively). The mean count of metastases on the liver surface was 250 in Balb/c and 47/190 in C57 BL/6 mice (100,000/300,000 cells). Of note, the macroscopic aspect of liver metastases was different between the two strains: While the liver surface of Balb/c mice was evenly covered with a high number of small metastases (1 to 2 mm in size), metastases in C57 BL/6 mice tended to be larger (>3 mm) and confluent, leaving areas of the liver surface unaffected (Fig. 1B and Supplementary Fig. 1). The degree of metastasis was also reflected by comparable differences in the measured bioluminescence (Supplementary Fig. 2) and in the expression of melanoma cell-associated luciferase (Supplementary Fig. 3). The approximately 3-fold higher susceptibility of Balb/c mice for B16F10 cell metastasis was also observed in the lungs after intravenous injection (Fig. 1D-F and Supplementary Fig. 1).
Figure 1. Balb/c mice are highly susceptible to B16F10 liver metastasis compared to C57 BL/6 mice. (A-C) Balb/c mice (Bc) received intrasplenic injections of 100,000 B16F10luc cells (“100 k”), whereas C57 BL/6 mice (B6) received either 100,000 or 300,000 cells (“100 k” or “300 k”). Control animals were treated equally but received injections of PBS. Bioluminescence was recorded 7 and 14 days after intrasplenic injection of B16F10luc cells (A). Livers were harvested 14 days after injection of cells to assess metastatic spread (representative images are shown) (B). Biometric data (liver weight, liver to body weight ratio, number of metastatic nodules on the liver surface with 250 being the upper limit) were recorded and analyzed (C). (D-F) 100,000 B16F10luc cells (“100 k”) were injected in the tail vains of Balb/c and C57 BL/6 mice. Control animals were treated equally but received injections of PBS. Bioluminescence was recorded 7 and 14 days after intravenous injection of B16F10luc cells (D). Lungs were harvested 14 days after injection of cells and photographs were taken (representative images are shown) (E). Biometric data (lung weight, lung to body weight ratio, number of metastatic nodules on the lung surface with 250 being the highest number) were recorded and analyzed (F). Individual and mean values ± SD are shown. The number of samples per group is indicated above the corresponding column. One-way ANOVA; statistical significance was assessed using either the Sidak's multiple comparisons test or in case of metastatic nodules the Mann-Whitney test with Bonferroni correction.
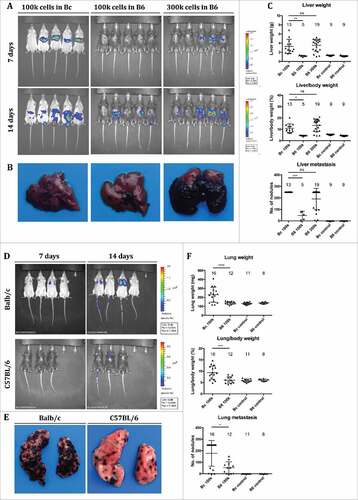
Figure 2. Murine livers with B16F10 metastases show strong myeloid and T cell immune cell infiltration. (A-C) Sections of metastasized livers from Balb/c and C57 BL/6 mice harvested 14 days after intrasplenic injection of B16F10 cells were stained with HE or antibodies against CD68 or CD3. Bars represent 200 µm (A) and 100 µm (B-C), respectively. Metastatic nodules are highlighted by white arrows. (D) Non-parenchymal cells were isolated from metastasized livers, dead cells excluded and the frequency of CD45+ cells determined by FACS. Individual and mean values ± SD are shown (n = 5 per group). (E) The number of cells per mm2 in sections stained with antibodies against CD68 or CD3 was quantified. Individual and mean values ± SD are shown (n ≥ 4 per group).
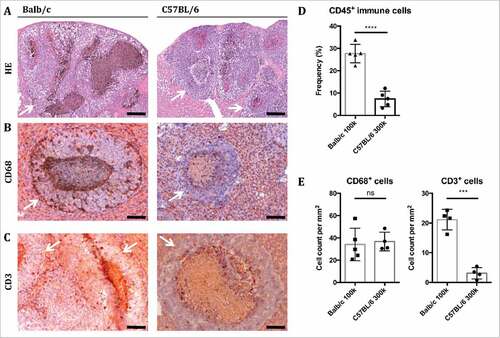
Figure 3. Balb/c but not C57 BL/6 mice launch a M1-polarized innate and T cell-dependent adaptive immune response against B16F10 liver metastases. (A) Non-parenchymal cells were isolated from metastasized livers from Balb/c and C57 BL/6 mice 14 days after intrasplenic injection of B16F10 cells, and the frequencies of macrophages (CD45+/ CD11b+/ F4/80+ cells), dendritic cells (CD45+/ CD11b−/ CD11 c+/ F4/80−), T killer cells (CD45+/CD8+), T helper cells (CD45+/CD4+) and B cells (CD45+/CD19+) as well as the strength of Ly6 c-expression on macrophages (MFI = mean fluorescence intensity) were determined by FACS. In addition, sections of metastasized livers were stained with the NK cell marker NKp46, and the number of positively stained cells per mm2 were quantified. Individual and mean values ± SD are shown (n = 5 per group). (B) Expression of selected immune genes (grouped for function or dominant immune cell type) in metastatic livers of Balb/c vs C57 BL/6 mice as determined by RNA-Seq (n = 3 in each group). Gene expression is normalized to Reads Per Kilobase per Million mapped reads (RPKM). For better visualization the y-axis is log10-scaled. False discovery rates (FDR) smaller than 0.01 for the differential gene expression between Balb/c and C57 BL/6 mice are indicated above the corresponding boxes.
B16F10 metastasized livers display enhanced immune cell infiltration
Liver sections revealed the morphology of liver metastases (). Depending on the extent of B16F10luc cell engraftment and growth, healthy liver tissue was replaced by metastatic lesions leaving only small streaks of normal tissue in advanced metastasis. Immunohistochemistry revealed that the tissue surrounding the metastases was infiltrated by macrophages (CD68+; & ) as quantified by flow cytometry below and to a lesser degree T cells (CD3+; & ). Flow cytometry showed a significant increase in immune cells in livers of Balb/c compared to C57 BL/6 mice, as demonstrated by the frequencies of CD45+ cells (). In stained sections, the frequencies of CD68+ cells were similar between Balb/c and C57 BL/6 mice, while there was a significant increase in CD3+ cells in Balb/c mice (E).
A more vigorous innate and adaptive immune response does not protect Balb/c mice from B16F10 liver metastasis
Further studies on the tumor microenvironment of B16F10 liver metastasis revealed striking differences between Balb/c and C57 BL/6 mice ( & ).
Figure 4. Analysis of the transcriptome maps the distinct differences in the immune responses against B16F10 metastases between Balb/c and C57 BL/6 mice. (A) MA-plot and numbers of differentially expressed genes between livers from Balb/c and C57 BL/6 mice with B16F10 metastasis (genes with log2-fold change (log2 FC ≥ 1 or ≤ −1) and false discovery rate (FDR) ≤ 0.01 are highlighted in red). (B-C) An IPA® was performed on genes differentially expressed between Balb/c and C57 BL/6 metastasized livers (log2 FC > 1 or < −1). The top regulators identified for each strain along with the corresponding p-value are listed (B). Selected immune-related signaling pathways which were found to be significantly enriched in the data set by IPA® are shown with significantly different activation levels between Balb/c and C57 BL/6 mice (C; the bars represent a multiple testing corrected p value using the Benjamini-Hochberg method; the ratio value [depicted by the yellow line with boxes] tells the proportion of molecules in a given pathway that meet the cutoff criteria).
![Figure 4. Analysis of the transcriptome maps the distinct differences in the immune responses against B16F10 metastases between Balb/c and C57 BL/6 mice. (A) MA-plot and numbers of differentially expressed genes between livers from Balb/c and C57 BL/6 mice with B16F10 metastasis (genes with log2-fold change (log2 FC ≥ 1 or ≤ −1) and false discovery rate (FDR) ≤ 0.01 are highlighted in red). (B-C) An IPA® was performed on genes differentially expressed between Balb/c and C57 BL/6 metastasized livers (log2 FC > 1 or < −1). The top regulators identified for each strain along with the corresponding p-value are listed (B). Selected immune-related signaling pathways which were found to be significantly enriched in the data set by IPA® are shown with significantly different activation levels between Balb/c and C57 BL/6 mice (C; the bars represent a multiple testing corrected p value using the Benjamini-Hochberg method; the ratio value [depicted by the yellow line with boxes] tells the proportion of molecules in a given pathway that meet the cutoff criteria).](/cms/asset/e6d0c822-ec93-4924-a86f-c5c6d94fae65/koni_a_1409929_f0004_oc.jpg)
FACS analysis of liver immune cells showed that the frequency of macrophages was similar in both strains (), whereas cells expressing Ly6 c, a marker of freshly recruited monocytes-macrophages, were significantly increased in Balb/c vs C57 BL/6 mice (). Furthermore and unexpectedly, the frequency of dendritic and CD8+ cells was significantly higher in Balb/c mice. However, the frequencies of CD4+ T cells and B cells and NK cells were not markedly different between both strains ().
RNA-sequencing (RNA-Seq) was performed on representative samples from B16F10luc liver metastases to gain further insight into the differences in anti-tumor immune activity of both strains. On a single gene expression level, the results from the IHC and FACS analyses were confirmed by gene expression profiles for inflammatory molecules, markers of M1 macrophage polarization or specific markers of different immune cell subpopulations (namely T cells and dendritic cells) which were significantly higher expressed in metastatic livers from Balb/c mice relative to C57 BL/6 mice (B and Supplementary Data). Notably, several genes associated with the histocompatibility complex and thus antigen presentation as well as cytolytic activity (particularly granzyme B and perforin 1) were significantly upregulated in Balb/c mice (Supplementary Fig. 4). Gene expression of selected immune genes in metastatic and sham-treated livers of Balb/c and C57 BL/6 was corroborated by QPCR (Supplementary Fig. 5).
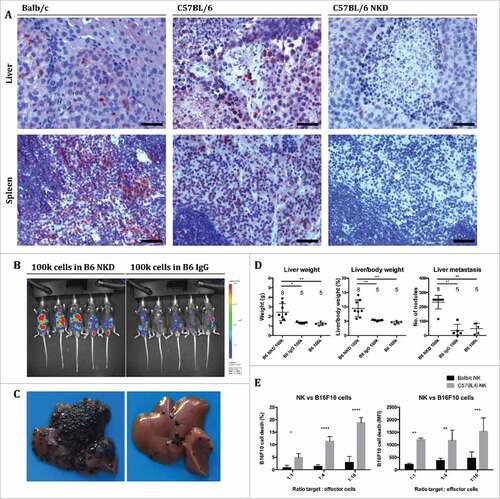
Figure 5. Cytotoxic NK cells endow C57 BL/6 mice with immunity against B16F10 cells compared to Balb/c mice. (A) Sections of metastasized livers and spleens from Balb/c, C57 BL/6 and NK cell depleted (NKD) C57 BL/6 mice were stained with an antibody against NKp46. Spleens were harvested 10 minutes and livers 14 days after intrasplenic injection of B16F10 cells. Bars represent 50 µm. (B-D) Mice were treated as in except that C57 BL/6 mice received intraperitoneal injections of anti-asialo GM1 antibody for NK cell-depletion (NKD) or injections of control IgG. Bioluminescence was recorded 14 days after intrasplenic injection of B16F10luc cells (A), followed by harvesting of livers for macroscopic metastasis assessment (B; representative images). Biometric data (liver weight, liver to body weight ratio, number of metastatic nodules on the liver surface) were recorded and analyzed (C). Individual and mean values ± SD are shown (the number of mice per group is indicated above the corresponding column). One-way ANOVA; statistical significance was assessed using either the Sidak's multiple comparisons test or in case of metastatic nodules the Mann-Whitney test with Bonferroni correction. (E) NK cells were isolated from the spleens of Balb/c and C57 BL/6 mice, respectively, by using indirect magnetic labeling with anti-NKp46 microbeads and subsequent magnetic separation, and incubated with B16F10 cells labeled with eFluor 670 in vitro. Cells were analyzed by FACS, and cytotoxicity was determined by measuring the extent of 7-AAD staining of B16F10 cells normalized to control cultures without effector cells. Mean values ± SD of the frequency of dead cells and of the MFI are shown (n = 4; MFI = mean fluorescent intensity). Two-way ANOVA; statistical significance was assessed using the Sidak's multiple comparisons test.
Differential gene expression analysis revealed 506 upregulated genes in Balb/c and 221 upregulated genes in C57 BL/6 mice (; FC >1, FDR <0.01). Ingenuity pathway analysis® (IPA®) identified the Interferon-γ, LPS and Stat-1 pathway as prominent signaling pathways in Balb/c mice and the Tgf-β1 as well as GM-Csf signaling pathway as prominent signaling pathways in C57 BL/6 mice (B). An analysis of immunological pathways revealed highly upregulated activity in Balb/c vs C57 BL/6 mice regarding antigen presentation, communication between innate and adaptive immune cells, allograft rejection pathways, crosstalk between dendritic and natural killer cells, interferon signaling and cytotoxic T lymphocyte-mediated apoptosis of target cells (C & Supplementary Fig. 6).
Final confirmation was obtained by gene set enrichment analysis (GSEA) and in silico estimation of relative abundances of immune cell populations which produced similar results identifying gene sets associated with the interferon gamma response, the inflammatory response, allograft rejection and macrophage M1-polarization as well as CD8 T cells (naïve) and M1 macrophages as being highly enriched in samples from Balb/c metastatic livers (Supplementary Fig. 7 & 8). On a side-note, the low frequency of M2 macrophages in both Balb/c and C57 BL/6 livers in the CIBERSORT analysis may be explained by an overlap with the more frequent immature DCs, since M2 macrophages and immature DCs share biological traits and can be considered to be related immune cell populations. Moreover, CIBERSORT has been established using microarray data sets and not been explicitly validated for liver tissue so the distinction between subclasses of different immune cell populations may be up to debate which is why we have combined activated and naive CD8 T cells into one group.
NK cells equip C57 BL/6 mice with a partial immunity against B16F10 cells in comparison to Balb/c mice
Since lowly immunogenic B16F10 cells are predestined to stimulate a predominantly innate immune response, and since increased numbers of M1-polarized macrophages and elevated levels of immune activating cytokines did not protect Balb/c mice against B16F10 liver metastasis, we reasoned that NK cells – as another pillar of innate immunity – might be responsible for the partial immunity of C57 BL/6 mice against B16F10 metastasis. Considering that metastasized livers of Balb/c and C57 BL/6 mice displayed similar levels of NK cells (A & ), the enhanced immunity of C57 BL/6 mice against B16F10 cells could not be explained by the mere quantity but would have to be attributed to increased cytotoxicity of the NK cells. We therefore depleted NK cells in C57 BL/6 mice by treatment with neutralizing anti-asialo GM1 antibody at days -3, 0, 3, 6, 9 and 12 relative to the injection of B16F10luc cells. Successful depletion was confirmed by immunohistochemical staining of NK cells in sections of spleens and livers harvested from mice 10 minutes (spleens) or 14 days (livers) after injection (). The depletion of NK cells dramatically increased liver metastasis after injection of 100,000 B16F10 cells (B-D and Supplementary Fig. 9). As additional validation for the superior anti-metastatic potency of NK cells from C57 BL/6 mice in comparison to Balb/c mice, we compared the killing capacity of NK cells derived from either mouse strain against B16F10luc cells in vitro. Here, C57 BL/6 NK cells were significantly more cytotoxic than their Balb/c counterparts (). The cytotoxicity was further confirmed against YAC1 cells, where NK cells from Balb/c mice were non-inferior to cells from C57 BL/6 mice (Supplementary Fig. 10).
Discussion
Inbred mouse strains are the backbone of biomedical research. While the idea behind inbreeding is to produce standardized model organisms, recent studies have shown that factors such as ambient temperature,Citation21 nutritionCitation22,Citation23 and the microbiomeCitation24 can have a significant impact on scientific results thwarting all standardization efforts.
In cancer research, inbred mouse strains are employed to study the course of malignant diseases and to develop more effective therapies. For studying the immunology of cancer, immunocompetent mouse strains are necessary, because they best reflect central interactions of the human immune system with cancer cells. However, apart from species differences, the used immunocompetent mouse strains display variant immunological makeups.Citation20
Here, we used the B16F10 melanoma cell line to study the immune response of two commonly used immunocompetent wild type mouse strains, C57 BL/7 and Balb/c, against B16F10 liver metastasis. B16F10 cells are highly metastatic in C57 BL/6 mice, i.e. their syngeneic strain, inducing skin, lung and liver metastases depending on their route of injection. In contrast, the metastatic potential of B16F10 cells in Balb/c mice, which are allogeneic, has been unknown, although B16 cells have been reported to grow in Balb/c mice after intraperitonealCitation25,Citation26 and subcutaneousCitation27,Citation28 injection. We hypothesized that Balb/c mice would produce an effective immune response against B16F10 cells resulting in a rejection of or at least reduced susceptibility to the cell graft. Surprisingly, the opposite proved to be true: Balb/c mice are approximately 3 times more susceptible to B16F10 metastasis than C57 BL/6 mice.
Our studies on the immunology of B16F10 liver metastasis showed that the invasion of B16F10 cells after intrasplenic injection provokes strong infiltration by immune cells, particularily of the myeloid lineage (macrophages and dendritic cells), in both mouse strains. This can be explained by the fact that B16F10 cells have very low expression of MHC I genes and therefore do not trigger a predominantly T cell-dependent immune response.
Further analyses revealed distinct and relevant differences in the kind of polarization of the immune responses between both strains. Balb/c mice exhibited a response involving higher numbers of CD8+ cells and Ly6 c+ freshly recruited monocytes-macrophages. On the transcriptional level, Balb/c mice showed a significantly higher expression of markers of M1 macrophage and Th1 T cell polarization and a lower expression of M2 or Th2 markers compared to C57 BL/6 mice in response to B16F10 liver metastasis. This was unexpected in many ways, since 1) a M1 or Th1 polarization is usually associated with a more rigorous anti-tumor response,Citation2,Citation29,Citation30 and 2) C57 BL/6 mice are known to display a prototypic Th1/M1, whereas Balb/c mice show a prototypic Th2/M2 polarization.Citation19,Citation31
RNA-Seq confirmed these findings and identified several immunological pathways such as antigen presentation, interferon signaling and iNOS signaling which were significantly more activated in Balb/c compared to C57 BL/6 mice. Together, the findings indicate that the allogeneity of B16F10 cells provokes both strong innate and adaptive immune response in Balb/c mice. However, while this immune response is expected to be central to an effective anti-tumor defense and is currently the focus of immunological tumor therapies, it is apparently insufficient to fight metastatic B16F10 melanoma that shows low (adaptive) immunogenicity.
We could demonstrate that the anti-metastatic advantage of syngeneic C57 BL/6 mice is due to a major part to their NK cells, which possess a higher killing capacity against B16F10 cells than NK cells of their Balb/c counterparts. The finding that Balb/c mice as the allogeneic strain are more susceptible to B16F10 metastasis may have broader implications for the role of NK cells in the defense against cancers of low classical immunogenicity. Generally, the missing-self hypothesis stipulates that one determinant for NK cell activation among others is the lack of MHC I molecules on the target cells’ surface.Citation32 In this line, several studies have provided evidence that NK cells are involved in the immune defense against tumor cells (reviewed inCitation33). For example, a recent study reported NK cell-mediated resistance to experimental tumors in two novel mouse strains different in the H-2D and NKC domain.Citation34 Another study demonstrated antitumor activity against B16F10 skin grafts for ALT-803, an IL-15 superagonist complex which stimulates CD8+ T cells and NK cells.Citation35
Moreover, the two mouse strains are routinely used as background for genetically modified organisms. Apart from their Th1-/Th2-polarization, C57 BL/6 and Balb/c mice are also known to differ with regard to their NK cell capabilities: C57 BL/6 NK cells produce higher cytotoxicity against xenogeneic Chinese hamster ovary (CHO) cells than Balb/c mice.Citation36 Moreover, Balb/c mice are susceptible to murine CMV infection, which is favored by low NK cell activity, while C57 BL/6 mice are resistant, and in vivo depletion of NK cells in C57 BL/6 mice renders them susceptible to CMV infection.Citation37 Specifically, Balb/c and C57 BL/6 mice differ regarding their Ly49 genes – the murine homologues of the NK cell Ig-related receptor (KIR) in humans – with Balb/c mice lacking the Ly49 d and Ly49 h gene.Citation38 In this vein, the immunosurveillance towards MHC I-deficient cancers has been shown to be Ly49-dependent,Citation39 with the superior capacity of C57 BL/6 mice to kill CHO cells being attributable to the Ly49 d receptor,Citation40 and the resistance of C57 BL/6 mice against murine CMV infection to the Ly49 h gene.Citation41-45 In addition, there are several environmental modulators of NK cell activity. Interestingly, CMV infection leads to a cytokine storm in Balb/c mice as part of which interferon-γ is highly elevated without playing a pathogenic role.Citation46 For example, exerciseCitation47 and IL-21,Citation48 which is secreted by natural killer T cells, T follicular helper cells and TH17 cells and signals via the JAK–STAT, the MAPK as well as the PI3 K-AKT pathways,Citation49 stimulate the anti-metastatic activity of NK cells against B16F10 metastasis in C57 BL/6 mice.
Our findings complement our knowledge on the role of NK cells in B16F10 metastasis and illustrate that NK cells from C57 BL/6 mice are highly important in antitumor responses and more potent than NK cells from Balb/c mice, whereas M1 macrophages and Th1 T cells appear to play a minor role in the context of lowly immunogenic cancers. The recent therapeutic successes with checkpoint inhibitors have been based on the activation of T cell dependent anti-cancer immune responses.Citation7 Since this approach leads to a clinical benefit in only a fraction of cancer patients, alternative or adjunctive immunotherapeutic interventions need to be investigated. NK cell based treatments represent such an alternative and are increasingly explored.Citation50-52 The here studied models are suited to test such novel approaches in the context of melanoma metastasis and offer the unique opportunity to study their effectiveness regarding the increased activation of existing NK cells (C57 BL/6 model), the priming of primarily ineffective NK cells (Balb/c model) or the implementation of potent NK cells in a foreign organism (both models).
In conclusion, we report for the first time that an allogeneic immunocompetent wild type mouse strain (Balb/c) is more susceptible to cancer cell challenge than the syngeneic strain (C57 BL/6). This is counter-intuitive at first, because allogeneity should cause a stronger anti-tumor response rendering Balb/c mice less susceptible. However, this indicates that cancer cells with low MHC I expression are capable of escaping a full-fledged adaptive immune response. In such a situation, NK cells present the remaining line of defense, and organisms that are equipped with effective NK cells have an anti-cancer advantage despite a missing adaptive immune response. Our findings highlight the relevance of NK cells for cancer immunotherapy and underscore the potential of developing therapies by activating these innate immune cells.
Materials and methods
Generation of liver or lung metastases
C57 BL/6 and Balb/c wild-type mice were purchased from Charles River (Wilmington, MA, USA) or Janvier (Le Genest-Saint-Isle, France) and maintained under pathogen-free conditions. Animal experiments were performed according to the German law for the protection of animals and approved by the local ethics committee on animal care (reference number 23177-07/G13-1-002, Government of Rhineland-Palatinate, Germany). Liver metastases were generated via intrasplenic injection of a defined number of B16F10luc cells as described previously.Citation53 Briefly, mice were anesthetized, an incision through skin and peritoneum was made in the left flank caudal of the costal arch, the spleen was externalized and a specified number of cells suspended in 100 µL of PBS was injected in the spleen's anterior pole. After 10 minutes, the spleen was removed, blood vessels were sealed off using a cauterizer (Fine Science Tools, Foster City, CA, USA), and the abdominal incision closed. Lung metastases were generated by injection of a defined number of B16F10luc cells in the tail vein. 14 days after injection of cells, mice were killed, biometric data was recorded and samples were collected. When measuring macroscopic metastatic burden, all nodules visible on the organ surface were counted up to an upper limit of 250.
Cell culture
B16F10 (murine melanoma; provided by TRON) and YAC1 (murine T cell lymphoma; a generous gift from Matthias Theobald) cells were maintained in RPMI medium containing 10% FBS, 1% streptomycin-penicillin (10,000 U/mL) and 1% L-glutamine (all: Life Technologies, Darmstadt, Germany) and cultured in a humidified incubator at 37°C containing 5% CO2.
Transduction of B16F10 cells with luciferase expressing plasmid
For production of lentiviral particles, HEK 293 T cells (3.5 × 10⁶ cells/10 mL) were plated into cell culture dishes (Ø 10 cm). On the next day, the culture medium was replenished, and chloroquine sulfate (10 µM) added. HEK293 T cells were co-transfected with 10 µg pCMVΔR8.91 (harbors HIV-1 derived gag, pol, rev, and tat genes),Citation54 4.2 µg pMD.G2 (encodes vesicular stomatitis glycoprotein G-encoding),Citation55 and 13.2 µg of the lentiviral luciferase expression vector pCD510B-1 Ubc.Luc.IRES.Puro using calcium chloride transfection. The pCD510B-1 Ubc.Luc.IRES.Puro vector was generated by inserting a PCR fragment containing the ubiquitin promoter, the firefly luciferase coding region and the IRES puromycin N-acetyl-transferase gene from Ubc.Luc.IRES.Puro (Addgene #33307)Citation56 into the NotI and RsrII restriction sites of the lentiviral expression plasmid CD510B-1 (System Biosciences, USA). On the next day, culture medium was exchanged by 5 mL of fresh medium. Both 24 h and 48 h later, supernatants containing lentiviral particles were harvested, mixed with PEG-it Solution® (SBI System Biosciences, Mountain View, CA), and stored at 4°C. On the following day, lentiviral particles were pelleted by centrifugation (1,500 g at 4°C for 30 min), resuspended in 200 µL PBS and stored at −70°C. B16F10 cells seeded into 6 well culture plates were transduced at a confluency of 60–70%. For this, culture media was replenished (2 mL/well), and 50 µL of concentrated lentivirus and polybrene (8 µg/mL)Citation57 were added. Cells were thoroughly washed on two consecutive days, and stably transduced B16F10luc cells were selected and subsequently cultured in the presence of puromycin (Sigma-Aldrich, St. Louis, MO, USA).
In vivo bioluminescence imaging
7 and 14 days after injection, mice were anesthetized and given an intraperitoneal injection of 250 µL luciferin (PerkinElmer, Waltham, MA, USA) dissolved in PBS at a final concentration of 8.3 mg/mL. 7 minutes later, mice were imaged for luminescence on an IVIS series pre-clinical in vivo imaging system (PerkinElmer).
Isolation of nonparenchymal liver cells and quantification of subpopulations
Nonparenchymal cells were isolated from mouse livers using a gentleMACS dissociator (Miltenyi Biotec, Bergisch Gladbach, Germany) and following the protocol for the preparation of single-cell suspensions from mouse liver provided by the manufacturer. Nonparenchymal cells were stained for different cell surface markers based on a previously described protocol.Citation58 The following antibodies (Biolegend, San Diego, CA, USA) were used: CD45-APC-Cy7 (30-F11), CD3-PerCP-Cy5.5 (145-2C11), CD4-Brilliant Violet 421 (GK1.5), CD8-PE-Cy7 (53-6.7), CD19-APC (6D5), CD11b-PerCP-Cy5.5 (M1/70), CD11 c-APC (N418), F4/80-PE (BM8) and Ly6 c-PE-Cy7 (HK1.4). For dead/live discrimination eFluor® 506 (eBioscience, San Diego, CA, USA) was used and cell suspensions were analyzed by flow cytometry. The gating strategy is illustrated in Supplementary Fig. 11.
Organ histology and immunohistochemistry
Specimens of excised livers and spleens were paraffin embedded and sectioned at 4 µm thickness. For histological assessment, deparaffinized liver sections were stained with hematoxylin (Merck, Darmstadt, Germany) and eosin Y (Carl Roth, Karlsruhe, Germany). For immunohistochemistry, deparaffinized organ sections were boiler-treated in EnVision™ FLEX Target Retrieval Solution, High pH (DAKO, Glostrup, Denmark) or 10 mM sodium citrate buffer pH 6.0 (applies to the NKp46 antibody only) for 30 min, blocked with 10% goat or 2.5% horse serum, incubated with the primary antibody overnight at 4°C (CD68: ab125212; CD3: ab5690; NKp46: ab214468 – all Abcam, Cambridge, UK), treated with 3% hydrogen peroxide and incubated with a biotinylated anti-rabbit secondary antibody (Vector Laboratories, Burlingame, CA, USA) at a dilution of 1:500. Peroxidase activity was developed with an avidin-biotin-enzyme complex (ABC) (Vector Laboratories) and AEC+ chromogen (DAKO), nuclei counterstained with hematoxylin, and sections mounted with aqueous mounting media, Aquatex® (Merck). Mounted sections were visualized using a Scope A.1 microscope and photomicrographed with an AxioCam MRC camera (Carl Zeiss Microscopy, Jena Germany). For quantification of NK cells, positively stained cells in sections treated with the NKp46 antibody were manually counted and calculated per mm2 of liver tissue.
Real-time quantitative PCR (RT-QPCR)
Total RNA from liver was isolated using RNAzol (Amresco, Solon, OH, USA) and a Tissue Lyser II (Qiagen, Venlo, Netherlands). 0.5 µg of total RNA was reverse transcribed using qScript cDNA SuperMix (Quantabio, Beverly, MA, USA) and RT-QPCR was performed using SYBR® Green PCR Master Mix on a StepOnePlus™ Real-Time PCR System (Thermo Fisher Scientific, Waltham, MA, USA). The sequences of primers used are listed in Supplementary Table 1. Relative gene expression was analyzed after normalizing for GAPDH as the house-keeping gene.
NK cell-mediated cytotoxicity
B16F10luc or YAC1 cells in a single cell suspension in PBS were labeled with the dye eFluor® 670 (eBioscience) at a final concentration of 5 µM for 30 minutes at 37°C and thereafter washed with PBS. NK cells were isolated from freshly harvested spleens from Balb/c and C57 BL/6 mice using the Anti-NKp46 MicroBead Kit (Miltenyi Biotec) and following the protocol provided by the manufacturer. NK and labeled target cells were cocultured at specified ratios for 4 hours, stained with 7-AAD (7-amino actinomycin D, eBioscience) and analyzed on a FACSCanto II flow cytometer (BD Biosciences, San Jose, CA, USA). The gating strategy is illustrated in Supplementary Fig. 12. The obtained cell frequency and mean fluorescence intensity values were normalized to control cultures without effector cells.
NK cell depletion
For systemic depletion of NK cells, we chose treatment with anti-asialo GM1 antibody, which has been used as a precise tool for the specific elimination of NK cells.Citation59 C57 BL/6 mice were given intraperitoneal injections of anti-asialo GM1 antibody (10 µL diluted in 100 µL PBS/mouse, Wako Pure Chemicals, Osaka, Japan) or control (rabbit IgG, Southern Biotech, Birmingham, AL, USA) on days -3, 0, 3, 6, 9 and 12 relative to the injection of B16F0 cells.
Next generation sequencing
Total RNA was isolated from ∼ 50 mg fresh frozen tissue using the RNeasy Mini Kit (Qiagen, Hilden, Germany). The concentration and quality of the RNA was measured with the Qubit® RNA HS Assay Kit (Thermo Fisher Scientific) and the RNA 6000 Nano Kit (Agilent Technologies, Santa Clara, CA, USA). Afterwards, 600 ng RNA were used to prepare the sequencing libraries with the TruSeq RNA Sample Preparation V2 kit (Illumina, San Diego, CA, USA) and subjected to sequencing 2 × 50 bp on a HiSeq2500 system (Illumina). RNA reads were aligned to the mm9 reference genomeCitation60 using STAR aligner,Citation61 and gene expression levels were determined by counting reads overlapping transcript exons and junctions and normalizing to RPKM expression units (reads which map per kilobase of transcript length per million mapped reads).Citation62 Differential gene expression between metastasized livers of Balb/c and C57 BL/6 mice was calculated using the R bioconductor package DESeq2Citation63 using the raw read counts of each gene as input.
Ingenuity Pathway Analysis®
The networks analyses were conducted with the Ingenuity Pathway Analysis® (IPA®, Qiagen). For this purpose, differential gene expression data was uploaded and significantly differentially expressed genes (log2 fold change (FC) > or < 1 and false discovery rate (FDR) < 0.01) were selected for analysis.
Gene set enrichment analysis
To identify positive or negative enriched molecular signatures between metastatic livers of Balb/c and C57 BL/6 mice, we applied the gene set enrichment analysis (GSEA) toolCitation64 utilizing the Molecular Signatures Database (MSigDB v6.0) Hallmark gene setsCitation65 and immunologic signatures (the COATES_MACROPHAGE_M1_VS_M2_UP gene set originates fromCitation66).
In silico immune cell-type deconvolution
For the in silico estimation of the relative abundance of immune cell populations in the RNA-seq B16F10 liver metastasis samples, we used the respective RNA-Seq derived normalized (RPKM) gene expression values as input for CIBERSORT.Citation67 As Signature Genes file, we used the immune cell signature matrix that was produced specifically for mouse tissue.Citation68 Number of permutation was 100 (default) and quantile normalization was set to “disabled” as recommended for RNA-Seq data.
Statistics
All statistical analyses were performed in Prism 6 for Mac OS X (GraphPad Software, La Jolla, CA, USA). P-values were calculated by the student's t-test if not indicated otherwise. P-values <0.05 were considered statistically significant. Asterisks were used to illustrate statistical significance: # p < 0.05, ## p < 0.01, ### p < 0.001, #### p < 0.0001, ns – not significant.
Flow cytometry data analysis was performed in FlowJo (Ashland, OR, USA).
Abbreviations
| FC | = | fold change |
| FDR | = | false discovery rate |
| GSEA | = | gene set enrichment analysis |
| IPA® | = | Ingenuity Pathway Analysis® |
| MDSC | = | myeloid derived suppressor cells |
| RNA-Seq | = | RNA-seqencing |
| TAM | = | tumor-associated macrophages |
| Tregs | = | regulatory T-cells |
Disclosure of potential conflicts of interest
No potential conflicts of interest were disclosed.
Author contributions
FF and DS conceived the experiments. FF performed murine experiments. SB analysed RNA-Seq data. RH supervised cell culture experiments. NR and SR assembled lentiviral plasmid construct. MB performed experiments involving lentiviruses. SS, LK and MA assisted in murine experiments. MD supervised in vivo imaging experiments. JC supervised RNA-Seq data analysis. FF, SB, MB, GP, US, AT, EB and DS wrote the manuscript.
supp_data.zip
Download Zip (46.2 MB)Acknowledgments
We thank Swaantje Hamdi for general technical assistance, Wasim Ahmad for assistance with immunohistochemical stainings, Yong Ook Kim for help with establishing the melanoma model, and Moritz Hess for statistical advice.
This work was supported by a grant of the Collaborative Research Center (CRC) 1066 by the German Research Foundation (DFG) to DS and a CRC fellowship to FF.
References
- Tas F. Metastatic behavior in melanoma: timing, pattern, survival, and influencing factors. J Oncol. 2012;2012:647684. doi:10.1155/2012/647684.
- Quail DF, Joyce JA. Microenvironmental regulation of tumor progression and metastasis. Nat Med. 2013;19:1423–37. doi:10.1038/nm.3394.
- Dunn GP, Old LJ, Schreiber RD. The three Es of cancer immunoediting. Annu Rev Immunol. 2004;22:329–60. doi:10.1146/annurev.immunol.22.012703.104803.
- Umansky V, Sevko A. Tumor microenvironment and myeloid-derived suppressor cells. Cancer Microenviron. 2013;6:169–77. doi:10.1007/s12307-012-0126-7.
- Ruffell B, Coussens LM. Macrophages and therapeutic resistance in cancer. Cancer Cell. 2015;27:462–72. doi:10.1016/j.ccell.2015.02.015.
- Gyorki DE, Callahan M, Wolchok JD, Ariyan CE. The delicate balance of melanoma immunotherapy. Clin Transl Immunol. 2013;2:e5. doi:10.1038/cti.2013.5.
- Topalian SL, Drake CG, Pardoll DM. Immune checkpoint blockade: a common denominator approach to cancer therapy. Cancer Cell. 2015;27:450–61. doi:10.1016/j.ccell.2015.03.001.
- Horst AK, Neumann K, Diehl L, Tiegs G. Modulation of liver tolerance by conventional and nonconventional antigen-presenting cells and regulatory immune cells. Cell Mol Immunol. 2016;13:277–92. doi:10.1038/cmi.2015.112.
- Poste G, Doll J, Hart IR, Fidler IJ. In vitro selection of murine B16 melanoma variants with enhanced tissue-invasive properties. Cancer Res. 1980;40:1636–44.
- Langowski JL, Zhang X, Wu L, Mattson JD, Chen T, Smith K, Basham B, McClanahan T, Kastelein RA, Oft M. IL-23 promotes tumour incidence and growth. Nature. 2006;442:461–5. doi:10.1038/nature04808.
- Voura EB, Jaiswal JK, Mattoussi H, Simon SM. Tracking metastatic tumor cell extravasation with quantum dot nanocrystals and fluorescence emission-scanning microscopy. Nat Med. 2004;10:993–8. doi:10.1038/nm1096.
- Menon LG, Kuttan R, Kuttan G. Inhibition of lung metastasis in mice induced by B16F10 melanoma cells by polyphenolic compounds. Cancer Lett. 1995;95:221–5. doi:10.1016/0304-3835(95)03887-3.
- Nakajima M, Hayashi K, Egi Y, Katayama K, Amano Y, Uehata M, Ohtsuki M, Fujii A, Oshita K, Kataoka H, et al. Effect of Wf-536, a novel ROCK inhibitor, against metastasis of B16 melanoma. Cancer Chemother Pharmacol. 2003;52:319–24. doi:10.1007/s00280-003-0641-9.
- Barbera-Guillem E, Smith I, Weiss L. Cancer-cell traffic in the liver. I. Growth kinetics of cancer cells after portal-vein delivery. Int J Cancer. 1992;52:974–7. doi:10.1002/ijc.2910520624.
- Hilario E, Unda F, Alino SF. Differential distribution of B16F10 melanoma cells in the liver lobule. Exp Cell Biol. 1988;56:303–10.
- Seliger B, Wollscheid U, Momburg F, Blankenstein T, Huber C. Characterization of the major histocompatibility complex class I deficiencies in B16 melanoma cells. Cancer Res. 2001;61:1095–9.
- Castle JC, Kreiter S, Diekmann J, Lower M, van de Roemer N, de Graaf J, Selmi A, Diken M, Boegel S, Paret C, et al. Exploiting the mutanome for tumor vaccination. Cancer Res. 2012;72:1081–91. doi:10.1158/0008-5472.CAN-11-3722.
- Filbey KJ, Grainger JR, Smith KA, Boon L, van Rooijen N, Harcus Y, Jenkins S, Hewitson JP, Maizels RM. Innate and adaptive type 2 immune cell responses in genetically controlled resistance to intestinal helminth infection. Immunol Cell Biol. 2014;92:436–48. doi:10.1038/icb.2013.109.
- Mills CD, Kincaid K, Alt JM, Heilman MJ, Hill AM. M-1/M-2 macrophages and the Th1/Th2 paradigm. J Immunol. 2000;164:6166–73. doi:10.4049/jimmunol.164.12.6166.
- Sellers RS, Clifford CB, Treuting PM, Brayton C. Immunological variation between inbred laboratory mouse strains: points to consider in phenotyping genetically immunomodified mice. Vet Pathol. 2012;49:32–43. doi:10.1177/0300985811429314.
- Kokolus KM, Capitano ML, Lee CT, Eng JW, Waight JD, Hylander BL, Sexton S, Hong CC, Gordon CJ, Abrams SI, et al. Baseline tumor growth and immune control in laboratory mice are significantly influenced by subthermoneutral housing temperature. Proc Natl Acad Sci U S A. 2013;110:20176–81. doi:10.1073/pnas.1304291110.
- Klement RJ, Champ CE, Otto C, Kammerer U. Anti-Tumor Effects of Ketogenic Diets in Mice: A Meta-Analysis. PLoS One. 2016;11:e0155050. doi:10.1371/journal.pone.0155050.
- Di Biase S, Lee C, Brandhorst S, Manes B, Buono R, Cheng CW, Cacciottolo M, Martin-Montalvo A, de Cabo R, Wei M, et al. Fasting-Mimicking Diet Reduces HO-1 to Promote T Cell-Mediated Tumor Cytotoxicity. Cancer Cell. 2016;30:136–46. doi:10.1016/j.ccell.2016.06.005.
- Garrett WS. Cancer and the microbiota. Science. 2015;348:80–6. doi:10.1126/science.aaa4972.
- Ashman LK, Goh DH, Kotlarski I. Involvement of donor lymphoreticular cells in the rejection of B16 melanoma by allogeneic mice. Aust J Exp Biol Med Sci. 1980;58:159–66. doi:10.1038/icb.1980.16.
- Heath W, Boyle W. In vivo and in vitro analyses of the immunogenicity of B16 melanoma cells. Aust J Exp Biol Med Sci. 1985;63(Pt 2):163–75. doi:10.1038/icb.1985.18.
- Han Z, Tian Z, Lv G, Zhang L, Jiang G, Sun K, Wang C, Bu X, Li R, Shi Y, et al. Immunosuppressive effect of bone marrow-derived mesenchymal stem cells in inflammatory microenvironment favours the growth of B16 melanoma cells. J Cell Mol Med. 2011;15:2343–52. doi:10.1111/j.1582-4934.2010.01215.x.
- Narita T, Kudo H. Effect of melatonin on B16 melanoma growth in athymic mice. Cancer Res. 1985;45:4175–7.
- Johansson M, Denardo DG, Coussens LM. Polarized immune responses differentially regulate cancer development. Immunol Rev. 2008;222:145–54. doi:10.1111/j.1600-065X.2008.00600.x.
- Biswas SK, Mantovani A. Macrophage plasticity and interaction with lymphocyte subsets: cancer as a paradigm. Nat Immunol. 2010;11:889–96. doi:10.1038/ni.1937.
- Watanabe H, Numata K, Ito T, Takagi K, Matsukawa A. Innate immune response in Th1- and Th2-dominant mouse strains. Shock. 2004;22:460–6. doi:10.1097/01.shk.0000142249.08135.e9.
- Karre K. Natural killer cell recognition of missing self. Nat Immunol. 2008;9:477–80. doi:10.1038/ni0508-477.
- Waldhauer I, Steinle A. NK cells and cancer immunosurveillance. Oncogene. 2008;27:5932–43. doi:10.1038/onc.2008.267.
- Fiserova A, Richter J, Capkova K, Bieblova J, Mikyskova R, Reinis M, Indrová M. Resistance of novel mouse strains different in MHC class I and the NKC domain to the development of experimental tumors. Int J Oncol. 2016;49:763–72. doi:10.3892/ijo.2016.3561.
- Rhode PR, Egan JO, Xu W, Hong H, Webb GM, Chen X, Liu B, Zhu X, Wen J, You L, et al. Comparison of the Superagonist Complex, ALT-803, to IL15 as Cancer Immunotherapeutics in Animal Models. Cancer Immunol Res. 2016;4:49–60. doi:10.1158/2326-6066.CIR-15-0093-T.
- Idris AH, Iizuka K, Smith HR, Scalzo AA, Yokoyama WM. Genetic control of natural killing and in vivo tumor elimination by the Chok locus. J Exp Med. 1998;188:2243–56. doi:10.1084/jem.188.12.2243.
- Scalzo AA, Fitzgerald NA, Wallace CR, Gibbons AE, Smart YC, Burton RC, Shellam GR. The effect of the Cmv-1 resistance gene, which is linked to the natural killer cell gene complex, is mediated by natural killer cells. J Immunol. 1992;149:581–9.
- Anderson SK, Dewar K, Goulet ML, Leveque G, Makrigiannis AP. Complete elucidation of a minimal class I MHC natural killer cell receptor haplotype. Genes Immun. 2005;6:481–92. doi:10.1038/sj.gene.6364232.
- Belanger S, Tu MM, Rahim MM, Mahmoud AB, Patel R, Tai LH, Troke AD, Wilhelm BT, Landry JR, Zhu Q, et al. Impaired natural killer cell self-education and “missing-self” responses in Ly49-deficient mice. Blood. 2012;120:592–602. doi:10.1182/blood-2012-02-408732.
- Nakamura MC, Naper C, Niemi EC, Spusta SC, Rolstad B, Butcher GW, Seaman WE, Ryan JC. Natural killing of xenogeneic cells mediated by the mouse Ly-49D receptor. J Immunol. 1999;163:4694–700.
- Arase H, Mocarski ES, Campbell AE, Hill AB, Lanier LL. Direct recognition of cytomegalovirus by activating and inhibitory NK cell receptors. Science. 2002;296:1323–6. doi:10.1126/science.1070884.
- Brown MG, Dokun AO, Heusel JW, Smith HR, Beckman DL, Blattenberger EA, Dubbelde CE, Stone LR, Scalzo AA, Yokoyama WM. Vital involvement of a natural killer cell activation receptor in resistance to viral infection. Science. 2001;292:934–7. doi:10.1126/science.1060042.
- Daniels KA, Devora G, Lai WC, O'Donnell CL, Bennett M, Welsh RM. Murine cytomegalovirus is regulated by a discrete subset of natural killer cells reactive with monoclonal antibody to Ly49 H. J Exp Med. 2001;194:29–44. doi:10.1084/jem.194.1.29.
- Lee SH, Girard S, Macina D, Busa M, Zafer A, Belouchi A, Gros P, Vidal SM. Susceptibility to mouse cytomegalovirus is associated with deletion of an activating natural killer cell receptor of the C-type lectin superfamily. Nat Genet. 2001;28:42–5. doi:10.1038/ng0501-42.
- Smith HR, Heusel JW, Mehta IK, Kim S, Dorner BG, Naidenko OV, Iizuka K, Furukawa H, Beckman DL, Pingel JT, et al. Recognition of a virus-encoded ligand by a natural killer cell activation receptor. Proc Natl Acad Sci U S A. 2002;99:8826–31. doi:10.1073/pnas.092258599.
- Brisse E, Imbrechts M, Put K, Avau A, Mitera T, Berghmans N, Rutgeerts O, Waer M, Ninivaggi M, Kelchtermans H, et al. Mouse Cytomegalovirus Infection in Balb/c Mice Resembles Virus-Associated Secondary Hemophagocytic Lymphohistiocytosis and Shows a Pathogenesis Distinct from Primary Hemophagocytic Lymphohistiocytosis. J Immunol. 2016;196:3124–34. doi:10.4049/jimmunol.1501035.
- Pedersen L, Idorn M, Olofsson GH, Lauenborg B, Nookaew I, Hansen RH, Johannesen HH, Becker JC, Pedersen KS, Dethlefsen C, et al. Voluntary Running Suppresses Tumor Growth through Epinephrine- and IL-6-Dependent NK Cell Mobilization and Redistribution. Cell Metab. 2016;23:554–62. doi:10.1016/j.cmet.2016.01.011.
- Brady J, Hayakawa Y, Smyth MJ, Nutt SL. IL-21 induces the functional maturation of murine NK cells. J Immunol. 2004;172:2048–58. doi:10.4049/jimmunol.172.4.2048.
- Spolski R, Leonard WJ. Interleukin-21: a double-edged sword with therapeutic potential. Nat Rev Drug Discov. 2014;13:379–95. doi:10.1038/nrd4296.
- Grossenbacher SK, Aguilar EG, Murphy WJ. Leveraging natural killer cells for cancer immunotherapy. Immunotherapy. 2017;9:487–97. doi:10.2217/imt-2017-0013.
- Guillerey C, Huntington ND, Smyth MJ. Targeting natural killer cells in cancer immunotherapy. Nat Immunol. 2016;17:1025–36. doi:10.1038/ni.3518.
- Rezvani K, Rouce R, Liu E, Shpall E. Engineering Natural Killer Cells for Cancer Immunotherapy. Mol Ther. 2017;25:1769–81. doi:10.1016/j.ymthe.2017.06.012.
- Box GM, Eccles SA. Simple experimental and spontaneous metastasis assays in mice. Methods Mol Biol. 2011;769:311–29. doi:10.1007/978-1-61779-207-6_21.
- Zufferey R, Nagy D, Mandel RJ, Naldini L, Trono D. Multiply attenuated lentiviral vector achieves efficient gene delivery in vivo. Nat Biotechnol. 1997;15:871–5. doi:10.1038/nbt0997-871.
- Follenzi A, Sabatino G, Lombardo A, Boccaccio C, Naldini L. Efficient gene delivery and targeted expression to hepatocytes in vivo by improved lentiviral vectors. Hum Gene Ther. 2002;13:243–60. doi:10.1089/10430340252769770.
- Jang YY, Ye Z, Cheng L. Molecular imaging and stem cell research. Mol Imaging. 2011;10:111–22.
- Davis HE, Rosinski M, Morgan JR, Yarmush ML. Charged polymers modulate retrovirus transduction via membrane charge neutralization and virus aggregation. Biophys J. 2004;86:1234–42. doi:10.1016/S0006-3495(04)74197-1.
- Bayne LJ, Vonderheide RH. Multicolor flow cytometric analysis of immune cell subsets in tumor-bearing mice. Cold Spring Harb Protoc. 2013;2013:955–60. doi:10.1101/pdb.prot077198.
- Monnier J, Zabel BA. Anti-asialo GM1 NK cell depleting antibody does not alter the development of bleomycin induced pulmonary fibrosis. PLoS One. 2014;9:e99350. doi:10.1371/journal.pone.0099350.
- Mouse Genome Sequencing C, Waterston RH, Lindblad-Toh K, Birney E, Rogers J, Abril JF, Agarwal P, Agarwala R, Ainscough R, Alexandersson M, et al. Initial sequencing and comparative analysis of the mouse genome. Nature. 2002;420:520–62. doi:10.1038/nature01262.
- Dobin A, Davis CA, Schlesinger F, Drenkow J, Zaleski C, Jha S, Batut P, Chaisson M, Gingeras TR. STAR: ultrafast universal RNA-seq aligner. Bioinformatics. 2013;29:15–21. doi:10.1093/bioinformatics/bts635.
- Mortazavi A, Williams BA, McCue K, Schaeffer L, Wold B. Mapping and quantifying mammalian transcriptomes by RNA-Seq. Nat Methods. 2008;5:621–8. doi:10.1038/nmeth.1226.
- Love MI, Huber W, Anders S. Moderated estimation of fold change and dispersion for RNA-seq data with DESeq2. Genome Biol. 2014;15:550. doi:10.1186/s13059-014-0550-8.
- Subramanian A, Tamayo P, Mootha VK, Mukherjee S, Ebert BL, Gillette MA, Paulovich A, Pomeroy SL, Golub TR, Lander ES, et al. Gene set enrichment analysis: a knowledge-based approach for interpreting genome-wide expression profiles. Proc Natl Acad Sci U S A. 2005;102:15545–50. doi:10.1073/pnas.0506580102.
- Liberzon A, Birger C, Thorvaldsdottir H, Ghandi M, Mesirov JP, Tamayo P. The Molecular Signatures Database (MSigDB) hallmark gene set collection. Cell Syst. 2015;1:417–25. doi:10.1016/j.cels.2015.12.004.
- Coates PJ, Rundle JK, Lorimore SA, Wright EG. Indirect macrophage responses to ionizing radiation: implications for genotype-dependent bystander signaling. Cancer Res. 2008;68:450–6. doi:10.1158/0008-5472.CAN-07-3050.
- Newman AM, Liu CL, Green MR, Gentles AJ, Feng W, Xu Y, Hoang CD, Diehn M, Alizadeh AA. Robust enumeration of cell subsets from tissue expression profiles. Nat Methods. 2015;12:453–7. doi:10.1038/nmeth.3337.
- Chen Z, Huang A, Sun J, Jiang T, Qin FX, Wu A. Inference of immune cell composition on the expression profiles of mouse tissue. Sci Rep. 2017;7:40508. doi:10.1038/srep40508.