
ABSTRACT
Chemokines are essential mediators of cellular trafficking, interactions and tumor development. Though adoptive cell therapy (ACT) has been a tremendous success in the treatment of metastatic melanoma (MM), a major obstacle for successful ACT, is limited homing of effector T cells to immune suppressive tumor sites. We hypothesized that equipping T cells with chemokine receptors matching the chemokines of the tumor microenvironment, could improve tumor homing of T cells. T cells from malignant ascites (n = 13); blood from ovarian cancer (OC) patients (n = 14); and healthy donors (n = 13) were analyzed by flow cytometry. We found that FoxP3+ regulatory T cells accumulation in patients with OC associates with CCR4 expression. We characterized a chemokine profile of ascites chemokines, and expression of corresponding receptors on circulating T cells and tumor ascites lymphocytes (TALs). CCL22, CXCL9, CXCL10 and CXCL12 associated with enrichment of CCR4+, CCR5+, CXCR3+ and CXCR4+ T cells in ascites. Circulating T cells and TALs however did not express CXCR2, identifying CXCR2 as candidate for chemokine receptor transduction. TALs readily expressed IFNγ and TNFα upon stimulation despite the frequency decreasing with in vitro expansion. Lentiviral transduction of TALs (n = 4) with chemokine receptor CXCR2 significantly increased transwell migration of TALs towards rhIL8 and autologous ascites. The majority of expanded and transduced TALs were of a T effector memory subtype. This proof of concept study shows that chemokine receptor engineering with CXCR2 is feasible and improves homing of transduced TALs towards the OC microenvironment.
Introduction
Tumor infiltrating lymphocytes (TILs) have repeatedly been shown to correlate with better prognostic outcome in malignant melanoma (MM),Citation1,Citation2 colorectal cancerCitation3 and ovarian cancer (OC) of serous histology.Citation4,Citation5 Adoptive cell therapy (ACT) transferring in vitro expanded TILs back to patients has been very successful in the treatment of malignant melanoma,Citation6-8 and while ACT of MM has entered phase III clinical testing, focus has shifted to identifying other clinical malignancies that might benefit from ACT.
With an estimated 239.000 new cases and 152.000 deaths every year, OC represents the 8th most common cause of cancer deaths worldwide (World cancer report 2014, WHO).Citation9 Due to the anatomical location in the peritoneal cavity, diagnosis is most often made when the disease has spread, and/or is giving rise to formation of ascites. Partly due to late diagnosis and development of chemotherapy resistance, OC mortality is the highest among gynecological cancers.Citation9,Citation10
Chemokine receptors are classically associated with orchestrating immune responses by directing the immune cells to the appropriate anatomic site. Expression of CCR7 by naïve T cells is responsible for recruitment and entry of T cells to the lymph nodes (LNs) via high endothelial venules (HEVs), whereas CCR7 is downregulated and CCR5 and CXCR3 upregulated upon antigen-specific activation by dendritic cells in the LNs, to allow exit and homing to site of inflammation.Citation11
Chemokines in the tumor microenvironment neatly orchestrate cellular migration and cell-cell interaction, with great impact on tumor development.Citation12 Cells of the tumor microenvironment (cancer cells, stromal cells, immune cells) release a wide range of chemokines mediating recruitment of different cell subsets of pro- and antitumor responses. Among others, recruitment of regulatory T cells (Tregs) to the tumor site has long been implicated in fostering suppression of anti-cancer immune responses in different cancers.Citation13 In addition to their classical role inducing cellular migration, chemokines are involved in other processes of tumor progression, inducing tumor cell proliferation, angiogenesis, resistance to chemotherapy, and metastasis.Citation14
ACT in its current classical form, is rather simple, and delivery of T cells to the tumor site after intravenous (i.v) transfer, is a limiting factor for success of treatment. While early ACT studies in ovarian cancers have explored both i.v.Citation15 and intra peritonealCitation16 transfer of TILs, clear data showing benefit of TIL ACT is still lacking. We hypothesize that it is possible to exploit the existing pro-tumorigenic chemokine axes in OC and – by genetic engineering with tumor specific chemokine receptor(s) – can thus improve homing of T cells to the tumor site.
We characterized the chemokine profile of 10 select chemokines in ascites from patients diagnosed with OC and their corresponding receptors on tumor ascites lymphocytes (TALs), to investigate whether T cell homing to OC can be improved by equipping TALs with chemokine receptors matching the chemokines of the tumor.
Results
Regulatory T cells accumulate in ascites of ovarian cancer patients
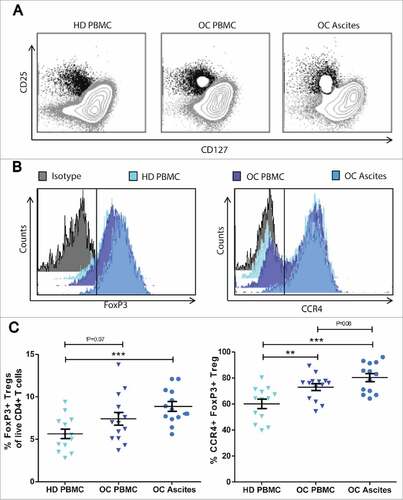
We analyzed Treg frequencies in blood (n = 14) and ascites (n = 13) from patients with OC by multicolor flow cytometry. Tregs were gated as the CD127low CD25hi FoxP3+ fraction of CD3+ CD4+ cells (). Treg frequencies are significantly higher in ascites of patients with OC, compared to healthy donor (HD) reference PBMC (p = 0.0005). In addition, PBMC Treg levels seems to be slightly increased among patients with OC compared HD reference PBMC Treg levels (p = 0.07) (). CD4/CD8 ratios were identical across OC ascites, OC PBMC and healthy donor samples (suppl. ). Additionally, we found that MFI of FoxP3 was higher on Tregs from OC ascites compared to Tregs in the blood of both OC patients and healthy donors (P<0.001, and suppl. ), representing a functionally more suppressive phenotype of TregsCitation17,Citation18 in the tumor ascites. To assess whether this directional accumulation of Tregs from blood to OC ascites was associated with expression of chemokine receptor CCR4, FoxP3+ Tregs were further sub-gated on CCR4 expression (). Data show a trend towards increased levels of CCR4+ on Tregs (80.2%) in ascites compared to blood of OC patients (72.9%, p = 0.08) and significantly enriched levels compared to Tregs in blood of healthy donors (60.0%, p = 0.0003). This suggests that Treg home to OC ascites in a CCR4 associated manner.
Figure 1. Regulatory T cells accumulate in ovarian cancer ascites. Frequencies of regulatory T cells were analysed by flow cytometry of peripheral blood mononuclear cells (PBMC) and ascites from patients with ovarian cancer (OC) compared to PBMC from healthy donors (HD). Tregs were gated as CD25hi CD127low/neg cells out of total live CD3+ CD4+ T cells. A) Representative dot plots of CD25hi CD127low/neg gating from HD PBMC, OC PBMC and OC Ascites respectively. B) Representative histograms of FoxP3 and CCR4 MFI of Tregs from OC ascites show a higher expression of FoxP3 and CCR4 compared to Tregs from HD PBMC and OC PBMC. C) Percentages of FoxP3+ Tregs and D) percentage of CCR4+ FoxP3+ Tregs in HD, OC PBMC and OC ascites. HD PBMC n = 13, OC PBMC n = 14, OC Ascites n = 13, Unpaired t-test, error bars designate mean with SEM, #P < 0.05, ##P < 0.01, ### P < 0.001.
Chemokine profiling of OC ascites reveals several potential immune cell recruitment axes
Chemokine concentrations of 10 selected chemokines (CCL2, CCL5, CCL17, CCL22, CXCL1, CXCL8, CXCL9, CXCL10, CXCL11, CXCL12) in cell free ascites were analyzed by Luminex. As chemokine mediated leukocyte recruitment is concentration-gradient dependent, we set a hypothetical threshold of 100 pg/ml, to only assess chemokines present in concentrations relevant for recruitment of immune cells.
As expected, CCR4 ligand CCL22 was found across all tested OC ascites samples tested (, n = 13, median 285.3 pg/ml, range 151.2–574.6 pg/ml), consistent with an enrichment of CCR4+ Tregs in ascites of patients with OC compared to the blood ().
Figure 2. Chemokines and chemokine receptors in ovarian cancer. (A) 10-plex Luminex analyses of chemokine concentration (pg/ml) in cell free ascites (n = 13). 3 samples (one from CXCL8, and 2 from CXCL10) were excluded in the graph as they were out of range ( > 5000 pg/ml). (B) Expression of corresponding chemokine receptors on CD4+ and CD8+ T cells from ascites (blue bars, n = 13) and PBMC (gray bars, n = 14) of patients with serous adenocarcinoma of the ovaries. Unpaired t-test, error bars designate mean with SEM, #P < 0.05, ##P < 0.01, ### P < 0.001.
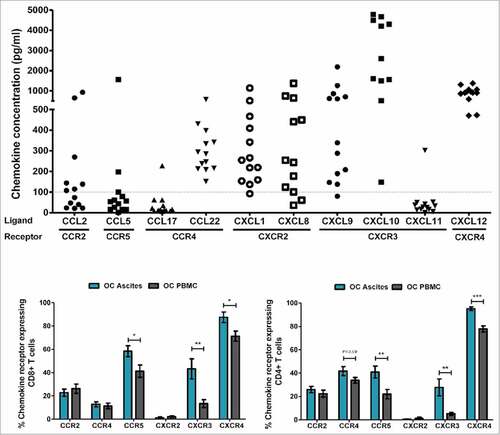
CXCR2 ligands, CXCL1 (Gro-α) and CXCL8 (IL-8, median 254.5 and 254.1 pg/ml respectively); CXCR3 ligands, CXCL9 (median 338.7 pg/ml) and CXCL10 (median 4209 pg/ml); and CXCR4 ligand CXCL12 (SDF-1, median 908 pg/ml), were found at varying but high levels ().
CCL2 CCL5, CCL17 and CXCL11 were found to be below the threshold of 100 pg/ml in the majority of samples, and thus were not examined further.
Characterization of chemokine receptor expression on T cells from ovarian cancer patients
We characterized the chemokine receptor expression on T cells from OC ascites and OC PBMC by multicolor flowcytometry (gating strategies, suppl. ). Chemokine receptors classically associated with activation of T cells after priming in the lymph nodes, CCR5 and CXCR3, were expressed on a larger fraction of T cells from OC ascites compared to T cells found in the blood of patients with OC (e.g. 58.4% vs. 41.2%, p = 0.02 and 43.3% vs. 13.4% p = 0.003 respectively for CD8+ T cells) (). Despite expression of CXCR4 on the majority of both OC ascites (87.45%) and OC PBMC T cells (72.3%), the frequency of CXCR4+ was significantly higher among ascites T cells (CD8+ T cells p = 0.01, CD4+ T cells p = 0.0001). CXCR2, a receptor most commonly found on neutrophils, was not expressed on T cells from neither OC PBMC nor OC ascites (see suppl. ).
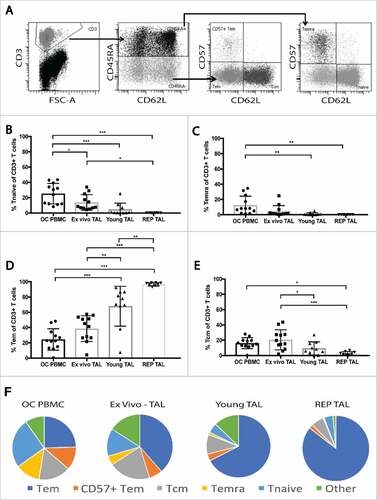
Figure 3. Maturation profile of peripheral blood T cells and TALs from ovarian cancer patients. The maturation profile of peripheral blood T cells, ex vivo TALs, young TALs and transduced REP TALs was assessed by the distribution of naïve, Tcm, Tem and Temra cells gated out of the live CD3+ T cell population. (A) Representative dot plots of gating strategy: CD45RA expression gated on the CD3+ T cells, and further subgated by CD62L and CD57 expression. (B-E) Frequencies of Tnaïve, Temra, Tem and Tcm, respectively, in OC PBMC (n = 12), ex vivo ascites (n = 12), young TAL cultures (n = 10) and REP TAL cultures (n = 8, 4 MOCK and 4 CXCR2 transduced). (F) Pie charts of maturation profile (mean) of Tnaïve, Temra, Tem and Tcm represented in B-E in addition to CD57+ Tem and “other”, as shown in gating strategy (A). Error bars designate standard deviation (SD), #P < 0.05, ##P < 0.01 and ###P < 0.001.
Though the expression patterns in general were very similar between CD4+ and CD8+ T cells from ascites of patients with OC, a larger fraction of CD8+ T cells stained positive for chemokine receptor compared to CD4+ T cells. The only exception to this was that approx. 40% of CD4+ T cells expressed the chemokine receptor CCR4 (46% of OC Ascites T cells and 36% of OC PBMC) compared to only 14% of CD8+ T cells, consistent with our findings of an enriched CCR4 expressing Treg population in ascites and blood from OC patients.
Apart from CCR5, the differentially expressed chemokine receptors CCR4 (on CD4+ T cells), CXCR3 and CXCR4 on ascites T cells were in line with our findings that the matching ligands were among the chemokines found at highest concentrations in clarified ascites (see ).
While we find an enrichment of chemokine receptor positive T cells in ascites compared to OC PBMC, no differential chemokine receptor expression was found between PBMC of patients with OC and healthy donors (suppl. Fig. 3). Furthermore, chemokines CCL2, CCL22, CXCL8, CXCL9 and CXCL10 were found at higher levels in OC ascites (ascites cohort) compared to plasma from OC patients (PBMC cohort) (suppl. Fig. 4, for patient characteristics see suppl. table 1), supporting the notion of a chemokine gradient.
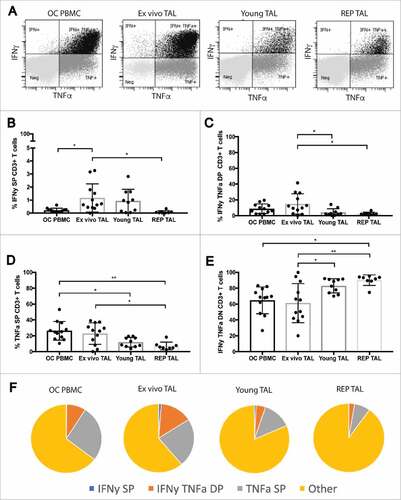
Figure 4. Cytokine profile of stimulated peripheral blood T cells and TALs from ovarian cancer patients. Cytokine production profile of peripheral blood T cells and TALs from patients with OC after 5h stimulation with leukocyte activation cocktail. A) Representative dot plots of IFNγ and TNFα expression gated on live CD3+ T cells. (B-E) shows the respective distribution of IFNγ single positive (SP), IFNγ TNFα double positive (DP), TNFα SP and IFNγ TNFα double negative (DN or “other”) CD3+ T cells, while (F) pie charts summarize the cytokine production profile (mean) of the data represented in (B-E). OC PBMC (n = 12), ex vivo ascites (n = 12), young TAL cultures (n = 10) and REP TAL cultures (n = 8, 4 MOCK and 4 CXCR2 transduced). Error bars designate standard deviation (SD), #P <0.05, ##P <0.01 and ###P <0.001.
Interestingly, both of the ligands for CXCR2, CXCL1 (Gro-α) and CXCL8 (IL-8) respectively, were present at very high concentrations in ascites (). However, CXCR2 were not expressed by neither T cells from ascites nor blood of patients with OC.
Maturation phenotype and cytokine profile of OC T cells and TAL cultures before and after expansion.
As CXCR2 ligands, CXCL1 (Gro-α) and CXCL8 (IL-8) were consistently present at high concentrations in ascites from 13 individual OC patients, and CXCR2 were not expressed by T cells, the CXCR2-ligand axis seemed a good candidate for chemokine receptor transduction of T cells as a means to increase the homing of anti-tumor T cells to the tumor site.
We generated a bank of tumor ascites lymphocyte (TAL) cultures (n = 10). As proof of principle, TALs from 4 different patients with OC were transduced with CXCR2, using a lenti-viral GFP-tagged construct. The distribution of naïve and effector T cell subsets was determined in ex vivo ascites; young TAL; and REP TAL cultures (4 Mock and 4 CXCR2 transduced), compared to that of OC PBMC (). CD3+ cells were divided into CD45RA+ and CD45RA− and subgated using CD62L and CD57. CD45RA+ CD62L+ naïve T cells (Tnaïve) and CD45RA+ CD57+ CD62L− T effector memory (Temra) were most frequent in OC PBMC and decreased with expansion of TALs (-C). While Tcm decreased with expansion of TAL, Tem frequencies significantly increased and made up the majority (>80%) of REP TAL cultures ().
In addition to assessing the distribution of effector T cells, we analyzed the effector cytokine production (IFNγ and TNFα) of OC PBMC T cells and TALs after 5h stimulation with leukocyte activation cocktail (representative gating, ). While the frequency of IFNγ single positive (SP) “ex vivo TALs” were significantly higher than OC PBMC T cells (), “ex vivo” TAL and OC PBMC cytokine production was very similar (). The frequency of cytokine producing TALs, however, significantly decreased with in vitro culture and REP (). CXCR2 transduction did not alter the maturation profile nor cytokine production of REP TAL compared to their Mock transduced counterparts ( and ). Furthermore, neither genetic engineering of T cells with CXCR2 – nor IL-8 signaling through CXCR2 – altered the tumor recognition and killing capability by MAGE-A3 specific T cells compared to mock transduced T cells (suppl. figure 7B-C).
CXCR2 as a potential receptor for transduction to improve homing of T cells to tumor site
Sorted and expanded transduced cultures were phenotyped for purity and expression of CXCR2 by flow cytometry. For 3 of 4 CXCR2 transduced TAL cultures, expression of CXCR2 was found on >80% of the TALs, compared to 0.1–0.5% of all 4 corresponding Mock transduced TAL cultures (, and suppl. figure 6B).
Figure 5. In vitro migration of CXCR2 transduced TALs. (A) Representative histogram of GFP_CXCR2 expression on CXCR2 transduced TALs, and (B) purity of sorted and expanded TAL cultures; one Mock- and CXCR2 transduced culture from each of 4 patients with OC (Blue: RH3, Purple: RH13, Green: RH24.2 and Orange: RH35). (C) Transwell migration of Mock- and CXCR2 transduced TALs towards increasing concentrations of rhIL-8 (5 ng/ml, 50 ng/ml, and 100 ng/ml), or D) autologous (RH-3, RH13, RH24.2 and RH35, respectively) or allogeneic ascites from two allo-OC patients (RH-10 and RH-22). Migration is represented as number of migrated cells / 3 × 10⁵ cells (background migration subtracted)/minute. Gray squares = CXCR2 transduced TALs, Black circles = Mock transduced TALs, Paired t-test, #P < 0.05, ##P < 0.01.
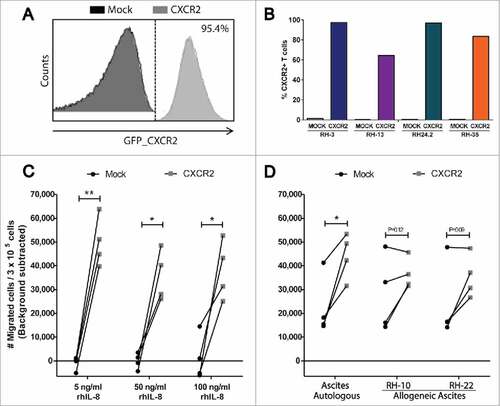
CXCR2 transduced and corresponding Mock transduced TAL cultures were analyzed in a 4h transwell migration assay towards rh-IL8, autologous or allogeneic ascites. Migration was assessed by flow cytometry as the no. of migrated cells/3 × 105 cells acquired/minute.
Transduction with CXCR2 significantly increased the migration of TALs towards rh-IL8 (). Indeed, quite low concentrations of rh-IL8 (5 ng/ml) induced migration of CXCR2 transduced cells. This migration was not augmented further by increasing the concentration of rh-IL8 (50 ng/ml and 100 ng/ml respectively) underlining that IL-8 is a very efficient inducer of migration. This was supported by efficient induction of CXCR2 transduced TAL migration towards autologous ascites (Range 254–467 pg/ml and 243–746 pg/ml for Gro-α and IL-8 respectively) of the 4 patients, compared to their Mock transduced counterparts (). CXCR2 transduction was also capable of increasing migration of 3/4 TAL cultures towards allogeneic ascites (). Migration capability of CXCR2 and mock transduced TALs towards 5 ng/ml rh-IL8 were equal to that of engineered healthy donor T cells (suppl. figure 7A).
Discussion
ACT has been investigated in the treatment of MM in an extensive number of clinical trials, consistently showing impressive clinical responses to treatment.Citation7,Citation19,Citation20 While ACT of MM has entered phase III clinical testing (NCT02278887), focus has shifted to identifying other clinical malignancies that might benefit from ACT.
Early studies have investigated the potential of ACT in OC, however, these non-randomized small studies failed to show a measurable effect of TIL therapy,Citation16 or were unable to show that response rates were independent of the pre-conditioning chemotherapy.Citation15 In 1991, Aoki and colleaguesCitation15 already speculated whether infrequent encounter of infused TIL with tumor was one of several reasons for limited duration of responses observed. Recently, several clinical phase I/II trials have been initiated to evaluate the safety and toxicity of various forms of ACT in patients with OC from ACT of TIL (NCT02482090) or TIL in combination with dendritic cell re-stimulation (NCT01883297) or checkpoint inhibition (NCT01174121). However, these strategies will not be efficient without effective homing of TILs to the tumor site after intravenous transfer.
Tumor infiltration by T cells (inflamed tumors) identifies a group of patients with a better prognosisCitation1,Citation21 and response to immunotherapy, compared to patients with non-inflamed tumors.Citation2,Citation22 Zhang and colleagues have shown that intratumoral T cells correlates with improved clinical outcome in advanced ovarian cancer. This T cell infiltration is associated with intratumoral lymphocyte-attracting chemokines, CXCL9, CCL21 and CCL22.Citation4
In the current study, we characterized the chemokine/chemokine receptor profile of 10 selected chemokines and their respective receptors on T cells in ascites and blood from patients with OC.
CCL22 has been shown to recruit highly functional immune suppressive TregsCitation23-25 to the tumor and ascites of OC. We observed higher frequencies of Tregs in PBMC and ascites from patients with OC and a trend of Treg enrichment from blood to ascites in a CCR4 associated manner. Adding to this, we found consistently high levels of CCR4 ligand CCL22 in ascites. While CCR4 ligand CCL17, was present in ascites, the level was negligible. This corresponds well with findings by Curiel et al.Citation25 that CCL22 and not CCL17 is responsible for Treg recruitment in OC. Thus, our data, in concert with others,Citation24,Citation26 strongly supporting the existence of this CCL22/CCR4 recruitment axis in OC directing Tregs from the circulation into the tumor macroenvironment. As Tregs have long been implicated in fostering suppression of anti-cancer immune responses, it might be of interest to augment response to immune therapy and anti-tumor immunity by abolishing Treg recruitment. To this end, several clinical trials are currently evaluating safety, toxicity and immune regulatory properties of anti-CCR4 depletion in ovarian- (NCT01929486) and other solid cancers (NCT02281409).
In addition to the CCR4/CCL22 axis, we studied several other potential T cell recruitment axes in OC. Corresponding well with data from Zhang et al.,Citation4 we found that high concentrations of CXCR3 ligands, CXCL9 and CXCL10 associated with an enrichment of CXCR3+ T cells in ascites. The finding that CXCL9 and CXCL10 concentrations were higher in ascites compared to plasma from patients with OC, suggests a chemotactic gradient for recruitment of activated T cells in OC. This corresponds well with both findings in human ovarian cancerCitation27 and several mouse models implicating a role for tumor CXCL10 and CXCR3 expression on T cells, in anti-tumor immunity.Citation28,Citation29
Ascites and PBMC from OC were obtained from two different patient cohorts, which were different in terms of primary surgery (n = 8/14) or chemotherapy (n = 2/14). This is reflected in the significantly lower serum CA125 in the PBMC cohort compared to the ascites cohort, as treatment is expected to kill CA125 producing malignant tissue.Citation30,Citation31 All other parameters were similar between the cohorts. Additionally, CD4/CD8 distribution was identical across the cohorts (data not shown). Nevertheless, samples from two cohorts limits the options and power of the statistical analyses. Despite this, we observed chemokine gradients between OC plasma and OC ascites in the two cohorts (suppl. ) matching an enrichment of CCR4+ Treg and CXCR3+ and CXCR4+ T cells in ascites compared to OC PBMC.
Taken together, this suggest that a single chemokine/chemokine receptor axis can significantly improve recruitment of specific cell subsets to the tumor site. However, despite our findings that CCR4+, CCR5+, CXCR3+ and CXCR4+ T cells are enriched in OC ascites compared to OC PBMC frequencies, all TALs cultures express CCR5 and CXCR3 after in vitro expansion (Suppl. figure 6). In concert with extensive ex vivo data showing that activated human T cells express CCR5 and CXCR3,Citation32-34 it seems futile aiming to improve homing to tumor site by TAL engineering with either of the receptors. We did however observe a decrease in CCR2 and CXCR4 expression by TALs after REP (representing the infusion product) and one might speculate whether either of these axes could be potential candidates for future chemokine receptor engineering in OC.
While the chemokine/chemokine receptor system is quite redundant, offering many different ligands to individual receptors, we found consistently high levels of Gro-α (CXCL1) and IL-8 (CXCL8), while the receptor CXCR2 is not expressed on T cells. Thus, we hypothesized that TALs could be genetically engineered to constitutively express CXCR2, and thus improve the homing of TALs towards ovarian cancer ascites.
As proof of concept, we generated CXCR2- and Mock transduced TAL cultures from 4 individual OC patients. We are, to our knowledge the first to expand and chemokine receptor transduce human ovarian cancer TALs. Ex vivo TAL were slightly skewed towards a Tem/Tcm phenotype compared to OC PBMC T cells containing are larger fraction of Tnaïve cells. This resembles a similar trend found by others.Citation26 Quite interesting, despite the frequency of Tem significantly increasing with expansion of TALs, mirroring the Tem dominance in TIL products from renal cell carcinom,Citation35 melanoma and gastrointestinal tumor,Citation34 the frequency of T cells producing effector cytokines IFNγ and TNFα decrease with expansion. To this end, it is not an uncommon observation in expanded TIL cultures including melanomaCitation36 and ovarian cancer (Westergaard MCW et al., ESMO IO 2016, manuscript in preparation). We unfortunately did not have access to autologous nor HLA-matched ovarian cancer cell lines, and thus could not test the killing capacity of in vitro cultured and expanded TALs. However, in our hands, forced expression and signaling through CXCR2 does not affect antigen specific killing of melanoma cell lines by T cell receptor engineered HD peripheral blood T cells (suppl. figure 7B-C).
To this end, in vitro culturing and expansion may exhaust a large fraction of the TALs, however, one could speculate, that as REP TAL represents a 1000-fold expansion, the absolute number of cytokine producing Tem increase.Citation36
CXCR2 transduction increased the specific migration of TALs towards rhIL-8 and autologous ascites. As little as 5ng/ml rhIL-8 induced maximum migration of CXCR2 transduced TALs in vitro, and increasing the concentration of rh-IL8 (50 and 100ng/ml respectively) did not increase migration, suggesting that IL-8 is a potent inducer of migration, even at low concentrations. This was confirmed by induction of similar high levels of migration of CXCR2 transduced TALs towards autologous ascites (Gro-α and IL-8 concentration of 254–467pg/ml and 243–746 pg/ml respectively). Additionally, migration towards allogeneic ascites of 3 out of 4 TALs was greater than their mock transduced counterparts. One CXCR2 transduced TAL culture (RH13) was unable to increase homing towards allogeneic ascites. Purity of CXCR2+ TALs in this culture was only around 60% and could explain these data. However, “background” migration of these cells was near maximal migration leaving the window for improved migration through CXCR2 very narrow. Though the four CXCR2- and Mock transduced TAL cultures had similar chemokine receptor expression patterns (Suppl. figure 6), we did not test for all approx. 20 known chemokine receptors, nor the ascites for all 50 known chemokine,Citation37 thus the high background migration of the RH13 TAL culture could be explained by donor-specific chemokines/chemokine receptor axes not studied in the current study.
Taken together, our data suggests that the IL-8/Gro-α axis is a universal axis in OC, which can be exploited to improve homing of T cells after genetic engineering with CXCR2. Given the fact that IL-8 is expressed in other tissues under certain conditions, e.g., inflammation, patients suffering from chronic inflammatory- or auto-immune diseases should be excluded from clinical trial testings based on this approach.
Transduced TALs are of a Tem phenotype capable of producing pro-inflammatory cytokines IFNγ and TNFα upon stimulation. Despite being solely in vitro generated, our data is supported by similar in vivo studies successfully redirecting T cells towards melanomas with CXCR2Citation38 in syngeneic mouse models, as well as ACT of xenograft human mesothelioma and neuroblastoma using CCR2b transduced human T cells, respectively.Citation39,Citation40 Additionally, CXCR2 redirected TILs are currently under investigation in a Phase I/II clinical trial of ACT in melanoma (NCT01740557).
Conclusion
We hypothesized that ascites chemokines could be exploited for optimizing tumor homing of T cells, and we identified several chemokine-chemokine receptor axes, most prominently the CXCR2/IL8 axis due to absence of IL-8 receptors on T cells prior to genetic engineering.
CXCR2 redirected TILs are currently under investigation in a Phase I/II clinical trial of ACT in melanoma (NCT01740557). Our data show that IL8 is uniformly present in OC ascites and the introduction of CXCR2 in TALs lead to improved migration towards ascites. Thus, redirection of TALs is feasible, and pose as suited candidate for clinical translation in ACT in OC.
ACT of CXCR2 redirected TALs (or TILs, or CAR T cells) could be combined with CCR4 antibody depletion (e.g. Mogamulizumab) of immune suppressive Treg, thus concurrently improve homing of T cells for ACT and inhibit tumor homing of Treg.
Materials and methods
Patient material/Samples
This project includes samples from patients with serous adenocarcinoma of the ovaries from two parallel studies. Ascites was obtained during primary open surgery from 13 treatment naïve OC patients of serous histology included in the Pelvic Mass study, while blood samples for isolation of peripheral blood mononuclear cells (PBMCs) were obtained from 14 OC patients of serous histology included the STAT0206 study, most with prior treatment – a majority having undergone primary surgery, and 2 having received prior chemotherapy. The majority of patients included in this project had stage III-IV disease (n = 22 of 27 patients included), and were treated at Department of Oncology at Herlev University Hospital, or Rigshospitalet, Copenhagen University Hospital, Denmark. Patient characteristics are presented in suppl. table 1. Median age was 65 years (range 45–81). Buffycoats from 13 healthy donors from the blood bank at Rigshospitalet, Copenhagen, Denmark were used as healthy PBMC controls (mean age 38.5 years, estimated range 17–67, median unknown). The studies (Ascites and PBMC) were all approved by the Danish Ethics Committee of Human Experimentation, approval no. H-3–2010-022 and H-2–2010-054, respectively. Informed written consent was obtained from all patients and healthy donors before inclusion.
Blood samples of 60 ml obtained by venipuncture were collected in Li-heparin tubes from each patient, and transported at room temperature. Processing was completed within < 6h for all sample specimens. PBMC were isolated by density gradient centrifugation with Lymphoprep™ (Axis-Shield PoC, #1114547), (30 minutes at 1200 RPM, without break) and cryopreserved at -150°C in fetal bovine serum (FBS) (GibcoBRL, #10270106) + 10% dimethylsulfoxide (DMSO) (Sigma-Aldrich, #D5879).
Ascites was obtained in large containers during open surgery at the surgery room at Rigshospitalet. Upon arrival at the lab, ascites samples were added 1ml penicillin/streptomycin (Gibco, #15140–122) pr 100ml ascites and placed in the incubator for overnight incubation at 37°C. Overnight incubation should see tumor and myeloid cells adhere to the plastic, allowing harvest of cell free ascites and non-adherent lymphocytes. Cell free ascites were centrifuged for 5 minutes at 1500 rpm to remove any cells and debris (clarified ascites), and stored at -20°C until use. Non-adherent cells were washed twice in RPMI 1640 (Life Technologies, #72400054) centrifugation for 5 min at 1500rpm, and cryopreserved at -150°C in FBS + 10% DMSO + 10%.
Flow cytometry and cell sorting
Multicolor flow cytometry was performed on PMBC from healthy donors and OC patients as well as cells from OC ascites and TAL cultures.
All ex vivo analyses was performed on freshly thawed cells. 2–5 × 10⁵ cells were stained in 5 ml Falcon® tubes (BD) with a mix of fluorochrome conjugated monoclonal antibodies (mAb).
For characterization of chemokine receptor expression, all samples were stained with mAbs to CD3-BV421 (Biolegend, clone: UCHT1, cat #300434), CD8-FITC (BD Biosciences, clone: RPA-T8, cat #561948), CD4-PE-Cy7 (BD Biosciences, clone: SK3, cat #557852). Chemokine receptor expression was assessed by labeling cells with a cocktail of either CXCR2-APC (Biolegend, clone: 5E8/CXCR2, cat #320710), CXCR3-BV510 (Biolegend, clone: G025H7, cat #353726), CXCR4-PE (Biolegend, clone: 12G5, cat #306506), or CCR2-APC (Biolegend, clone: K036C2, cat #357208), CCR4-BV510 (Biolegend, clone: L291H4, cat #359416) and CCR5-PE (Biolegend, clone: J418F1, cat# 359106).
Maturation profile was assessed using a cocktail of mAbs to CD3-BV421 (Biolegend, clone: UCHT1, cat #300434), CD8-FITC (BD Biosciences, clone: RPA-T8, cat #561948), CD4-BV510 (Biolegend, clone: OKT4 cat # 317444), and maturation markers CD57-PE (Biolegend, clone: HCD57, cat # 322312), CD45RA-PerCP-Cy5.5 (Biolegend, clone: HI100, cat # 304122) and CD62L-APC (Biolegend, clone: DREG-56, cat #304810).
Appropriate fluorochrome conjugated isotype controls were included for all chemokine receptors and maturation markers. A near-infrared fixable dead cell stain (Life technologies, #L10119) was included for dead cell exclusion. Staining was performed for 20–30 minutes protected from light and on ice. Cells were washed twice prior to and twice post mAb staining with 1x PBS + 2% FBS (FACS buffer).
For analysis of Treg frequencies, all samples were stained with mAbs to CD3-FITC (Biolegend, clone: HIT3a, cat #300306), CD8-PerCP (Biolegend, clone: RPA-T8, cat #301029), CD4-APC (Biolegend, clone: RPA-T4, cat #300514), CD127 PE-Cy7 (Biolegend, clone: A019D5, cat #351319), CD25-BV421 (Biolegend, clone: B96, cat #302630) and CCR4-BV510 (Biolegend, clone: L291H4, cat #359416), as well as near-infrared fixable dead cell stain (Life technologies) for dead cell exclusion according to the above extracellular staining (ECS) procedure. After the second wash post ECS mAb staining, the cells were fixed and permeabilized using the FoxP3/Transcription factor staining buffer set from Affymetrix eBiosciences (#00-5523-00), according to manufacturer's recommendations. In short, cells were fixed in fixation/permeabilization buffer for at least 1h, alternatively overnight. After appropriate fixation, the cells were washed twice using Permeabilization wash buffer and stained with mAb to FoxP3-PE (eBioscience, clone: FJK-16s, cat #12–5773-82) or appropriate isotype control, for 20–30 minutes protected from light on ice. After intracellular staining for FoxP3, the cells were washed twice with Permeabilization wash buffer.
For assessment of cytokine profile, OC TALs and PBMC were thawed and rested overnight prior to 5h stimulation with leukocyte activation cocktail (BD Biosciences, cat # 550583) or BD GolgiPlug™ (negative control, BD Biosciences, cat # 555029). After stimulation, cells were stained with mAbs to CD3-BV421 (Biolegend, clone: UCHT1, cat #300434), CD8-FITC (BD Biosciences, clone: RPA-T8, cat #561948), CD4-BV510 (Biolegend, clone: OKT4 cat # 317444), and intracellular cytokines; IFNγ-PE (eBioscience, 4S.B3, cat #12–7319-42), TNFα-APC (BD Biosciences, clone: Mab11, cat #554514) and IL-17A-PerCP-Cy5.5 (eBioscience, clone: eBio64DEC17, cat #45–7179-4), according to the procedure described above.
Samples for chemokine receptor characterization, Treg frequencies, maturation and cytokine profile were acquired on a BD FACS Canto II (BD Biosciences, New Jersey, USA) within 1h of finishing staining procedure and all data was analysed with BD FACSdiva software version 8.0.1.
Due to insufficient sample material, maturation and cytokine profiling was only performed on 12 of the 14 OC PBMC and 12 of the 13 OC ascites samples.
For sorting, transduced TAL cultures were labelled according to above described ECS staining protocol with mAbs to CXCR2-APC (Biolegend) and CD3-BV421 (Biolegend). A near-infrared fixable dead cell stain (Life technologies) was included for dead cell exclusion. Lentivirally transduced TALs co-expressing GFP and CXCR2 were sorted (designated “CXCR2”). GFP− CXCR2− double negative T cells were sorted as the “non-transduced” control TALs (Designated “Mock”). MAGE-A3 TCR transduced healthy donor T cells were sorted using anti-Vβ5.1 TCR-APC (eBioscience, clone: LC4, cat # 17–5832-42) and CD3-BV421 (Biolegend). All antibodies, buffers and procedures were kept under sterile conditions to ensure aseptic sorting of cells for further culturing. Cell sorting was performed on a BD FACS aria (BD Biosciences, New Jersey, USA).
Setup of the instruments, quality control and compensation settings were done according to instrument requirements.
Luminex
Cell free ascites samples were analyzed for CCL2/MCP-1, CCL17, CCL22, CXCL1/Gro-α, CXCL8/IL-8, CXCL9, CXCL10, CXCL11 and CXCL12/SDF-1 using a multiplex Bio-Plex ProTM Human Chemokine assay (BioRad, #171AK99MR2), and CCL5/RANTES Bio-Plex Pro Human Cytokine Assay (BioRad #171B5025M). Samples were prepared according to manufacturer's recommendations. In short, 50 µl of freshly thawed samples and prepared standards were transferred to designated wells in the 96-well plate, with each well containing 50 µl magnetic bead solution. The plate was incubated on a shaker for 1hr (850 rpm, the setting for all following incubation). Next, 25 µl detection antibody was added to each well and the plate was incubated on shaker for 30 min. in dark. Last, 50 µl streptavidin was added and the plate incubated for 10 min. on shaker in dark. The plate was washed 3 times between all incubation steps.
The samples were acquired on a Bio-Plex 200 system (BioRad, CA, USA) and analyzed with Bio-Plex ManagerTM v.6 software.
TAL isolation protocol, transduction and rapid expansion
Tumor ascites T lymphocyte (TAL) cultures were established by expansion of ascites T cells using high dose rhIL-2 (Proleukine, Novartis, order by prescription) of 6000U/ml. In short, ascites cells were plated 1 × 10⁶ cells pr well in a 24-well plate containing X-vivo (Lonza, #LZ-BE-04-418Q) + 5% human AB serum (HS, Sigma Aldrich, #H4522) + 6000U/ml rhIL-2. The cells were left for the initial 5 days in a 37°C humidified CO2 incubator, after which, the medium was changed every 2–3 days by removal of 1ml medium and addition of 1ml fresh medium, without resuspending the cells. Within 7–10 days, T cells started to grow out, first in clusters, before becoming confluent (covering >90% of the well bottom). When T cells reached confluence, the cells were resuspended and split 1:2 into adjacent wells. “Young” TAL cultures were cryopreserved according to protocol described above when cell counts of > 50 × 106 T cells were reached (13 cultures, range; 14–28 days) in culture.
Lentiviral transduction of TALs and healthy donor T cells
The cDNA encoding CXCR2 (accession nr. NM_001557) was synthesized and cloned into the lentiviral vector pTRP-EGFP (generously provided by Dr. James L. Riley, University of Pennsylvania, Philadelphia, PA) using 5`AvrII/3′SalI restriction sites (GeneArt/ Thermo Fisher Scientific, Regensburg, Germany) generating pTRP-EGFP_CXCR2. This vector permits dual expression of EGFP and CXCR2 from a single RNA transcript.
Lentiviral vector containing high affinity MAGE-A3a3a TCRCitation24 and corresponding packaging and envelope plasmids (VSVG, REV and gag/pol) was generously provided under MTA.
Lentivirus was produced after transfection of 293T human embryonic kidney cells cultured in DMEM (BioWhittaker, Rockville MD, USA), 10% FBS. 293T cells were seeded at 5 × 10⁵ per well in a 6-well plate 24h before transfection. Lentivirus was produced after transfection of 293T human embryonic kidney cells (HEK293 T/17 ATCC, #ACS-4500) cultured in DMEM (BioWhittaker, #31966-047), 10% FBS, Cells were seeded at 5 × 10⁵ per well in a 6-well plate 24 h before transfection. For transfection, 1 µg of pMAGE-A3a3a or pTRP-EGFP_CXCR2 and 0.5 µg of corresponding packaging and envelope plasmids were used together with TurboFect Transfection Reagent (Thermo Fisher Scientific). Cells were cultured at humidified atmosphere with 5% CO2 for 48 hours before harvesting the viral supernatant. For transduction of TALs and healthy donor T cells, T cells were incubated with lentivirus filtered supernatant + 6000 U/ml rhIL-2 for 72 hours before being sorted using a FACSAria cell sorter (BD Biosciences, San Jose CA, USA). Routine assays for gene expression via flow cytometry and for mycoplasma were conducted and CXCR2-transduced TALs and healthy donor T cells were used for experimental analysis as indicated.
1–2 × 10⁵ transduced and sorted TALs and healthy donor T cells were put into a rapid expansion protocol (REP) along with 20 × 106 feeder cells (PBMC from 4 donors, gamma irradiated with 40 Gy) in a T25 tissue culture flask (Corning, #430168) in 20 ml x-vivo medium + 5% HS, 30 ng/ml anti-CD3 (OKT-3, eBioscience, #14-0037-82) and 6000 U/ml rhIL-2. REPs were incubated undisturbed for the initial 5 days after which, half of the cell culture medium was changed every 2–3 days. When expanding cells covered the bottom of the flasks, all content was transferred to T75 flasks and kept in 40ml culture medium. Anti-CD3 was only added at the setup of REP, 6000 U/ml rhIL-2 was continued throughout the REP. On day 14 of REP, the cells were harvested and 2 × 10⁵ cells of each culture were analyzed for GFP-CXCR2 and TCR purity. Remaining cells were cryopreserved according to the PBMC protocol described above and kept at -150°C until use.
Transwell migration assay
Chemokine mediated migration was assessed using a Transwell® system. 3 × 10⁵ TALs in a volume of 200 µl serum free medium (x-vivo) was added to the upper chamber containing a 3 μm polycarbonate membrane (Corning, #CLS3415-48A), and chemotaxis towards the lower chamber containing either 500 μl x-vivo + 5–100 ng/ml rhIL-8 (R&D systems, #208-IL-010) or 500 μl (autologous or allogeneic) malignant ascites. 1 well pr. TAL culture was used as a control for background migration (minimum migration) with serum and chemokine free medium in the lower chamber, while another well was added cells directly into the lower chamber without a transwell membrane to represent the maximum migration. The assay was incubated for 4 h at 37°C, before counting the number of migrated cells in the bottom well by flow cytometry. In short, transwell inserts were discarded and the cells in the bottom well were resuspended and transferred to 5 ml Falcon® tubes (VWR, #60819-138). The wells were washed by 1 ml FACS buffer to ensure recovery of all migrated cells. Cells were spun once and all of the supernatant was removed, before resuspending the cells in exactly 100µl per tube. Immediately prior to acquisition on a BD FACS canto II flowcytometer, all samples were added 2 µl 7-AAD (BD biosciences, #51-68981E) for dead cell exclusion. The samples were acquired using an automated carousel, at high flow rate, for precisely 60 seconds each, generating a value of number (#) of migrated cells / 3 × 10⁵ cells/ minute.
51Crrelease cytotoxicity assay
MAGE-A3 TCR specific healthy donor T cells were put into 51Cr release cytotoxicity assay to evaluate the killing capacity of CXCR2 or Mock transduced against IL-8 secreting melanoma cell line FM82 alone or in combination with either 50 ng/mL IL-8, or 2 ug/mL neutralizing mAb to IL-8. In short, 5 × 10⁵ target cells (FM82) were labeled with 100 μCi 51Cr (Perkin Elmer) in 100 µL RPMI + 10% FBS for 60 min. Washed 51Cr labelled target cells were subsequently plated 5 × 10³ cells/well in round bottomed 96-well plates with T cells at decrescendo effector:target ratios, and incubated 4 h at 37°C. 100 μL supernatant was aspirated and 51Cr-release was measured using a gamma counter (Perkin Elmer Wallac Wizard 1470 Automatic gamma counter) for quantification of T cell-mediated killing of target cells. Additional wells were used to determine maximum and spontaneous 51Cr release. Maximum 51Cr release were assessed by lysing target cells with 100 µL 10% TritonX-100 (Sigma-Aldrich) while spontaneous 51Cr release was measured on target cells added 100 μL RPMI 1640 + 10% FBS only. Specific lysis was calculated using the following equation; ((sample release – spontaneous release)/(maximum release – spontaneous release))#100%.
Disclosure of potential conflicts of interest
No potential conflicts of interest were disclosed.
supp_data.zip
Download Zip (658 KB)Acknowledgments
We would like to acknowledge Dr. Andrew Gerry and Dr. Bent Jakobsen of Adaptimmune Ltd. (Oxfordshire, UK) for supplying us with lentiviral vectors for high affinity MAGE-A3a3a TCR transduction, Evelina Martinenaite for technical assistance with running the BioPlexTM system and technician Kirsten Nikolajsen and the FACS core facility for invaluable help with the cell sorting.
Additional information
Funding
References
- Weiss SA, Han SW, Lui K, Tchack J, Shapiro R, Berman R, Zhong J, Krogsgaard M, Osman I, Darvishian F. Immunologic heterogeneity of tumor-infiltrating lymphocyte composition in primary melanoma. Hum Pathol. 2016;57:116–25. doi:10.1016/j.humpath.2016.07.008.
- Tumeh PC, Harview CL, Yearley JH, Shintaku IP, Taylor EJM, Robert L, Chmielowski B, Spasic M, Henry G, Ciobanu V, et al. PD-1 blockade induces responses by inhibiting adaptive immune resistance. Nature. 2014;515:568–71. doi:10.1038/nature13954.
- Galon J, Costes A, Sanchez-Cabo F, Kirilovsky A, Mlecnik B, Lagorce-Pagès C, Tosolini M, Camus M, Berger A, Wind P, et al. Type, density, and location of immune cells within human colorectal tumors predict clinical outcome. Science. 2006;313:1960–4. doi:10.1126/science.1129139.
- Zhang L, Conejo-Garcia JR, Katsaros D, Gimotty PA, Massobrio M, Regnani G, Makrigiannakis A, Gray H, Schlienger K, Liebman MN, et al. Intratumoral T cells, recurrence, and survival in epithelial ovarian cancer. N Engl J Med. 2003;348:203–13. doi:10.1056/NEJMoa020177.
- Webb JR, Milne K, Kroeger DR, Nelson BH. PD-L1 expression is associated with tumor-infiltrating T cells and favorable prognosis in high-grade serous ovarian cancer. Gynecol Oncol. 2016;141:293–302. doi:10.1016/j.ygyno.2016.03.008.
- Rosenberg S a, Dudley ME. Cancer regression in patients with metastatic melanoma after the transfer of autologous antitumor lymphocytes. Proc Natl Acad Sci U S A. 2004;101 Suppl:14639–45. doi:10.1073/pnas.0405730101.
- Andersen R, Donia M, Ellebaek E, Borch TH, Kongsted P, Iversen TZ, Hölmich LR, Hendel HW, Met Ö, Andersen MH, et al. Long-Lasting complete responses in patients with metastatic melanoma after adoptive cell therapy with tumor-infiltrating lymphocytes and an attenuated il2 regimen. Clin Cancer Res. 2016;22:3734–45. doi:10.1158/1078-0432.CCR-15-1879.
- Besser MJ, Shapira-Frommer R, Itzhaki O, Treves AJ, Zippel DB, Levy D, Kubi A, Shoshani N, Zikich D, Ohayon Y, et al. Adoptive transfer of tumor-infiltrating lymphocytes in patients with metastatic melanoma: Intent-to-treat analysis and efficacy after failure to prior immunotherapies. Clin Cancer Res. 2013;19:4792–800. doi:10.1158/1078-0432.CCR-13-0380.
- Stewart BW, Wild CP, editors. World Cancer Report 2014. 2014th ed. WHO Press, World Health Organization; 2014. http://www.videnza.org/wp-content/uploads/World-Cancer-Report-2014.pdf ISBN: 978-92-832-0443-5
- Jessmon P, Boulanger T, Zhou W, Patwardhan P. Epidemiology and treatment patterns of epithelial ovarian cancer. Expert Rev Anticancer Ther. 2017;17:1–11. doi: 10.1080/14737140.2017.1299575
- Griffith JW, Sokol CL, Luster AD. Chemokines and chemokine receptors: positioning cells for host defense and immunity. Annu Rev Immunol. 2014;32:659–702. doi:10.1146/annurev-immunol-032713-120145.
- Chow MT, Luster AD. Chemokines in Cancer. Cancer Immunol Res [Internet]. 2014;2:1125–31. doi:10.1158/2326-6066.CIR-14-0160.
- Mougiakakos D, Choudhury A, Lladser A, Kiessling R, Johansson CC. Regulatory T cells in cancer. Adv Cancer Res. 2010;107:57–117. doi:10.1016/S0065-230X(10)07003-X.
- Viola A, Sarukhan A, Bronte V, Molon B. The pros and cons of chemokines in tumor immunology. Trends Immunol. 2012;33:496–504. doi:10.1016/j.it.2012.05.007.
- Aoki Y, Takakuwa K, Kodama S, Tanaka K, Takahashi M, Tokunaga A, Takahashi T. Use of adoptive transfer of tumor-infiltrating lymphocytes alone or in combination with cisplatin-containing chemotherapy in patients with epithelial ovarian cancer. Cancer Res. 1991;51:1934–9.
- Freedman RS, Edwards CL, Kavanagh JJ, Kudelka AP, Katz RL, Carrasco CH, Atkinson EN, Scott W, Tomasovic B, Templin S. Intraperitoneal adoptive immunotherapy of ovarian carcinoma with tumor-infiltrating lymphocytes and low-dose recombinant interleukin-2: a pilot trial. J. Immunother. Emphasis Tumor Immunol. 1994;16:198–210. doi:10.1097/00002371-199410000-00004.
- Chauhan SK, Saban DR, Lee HK, Dana R. Levels of Foxp3 in regulatory T cells reflect their functional status in transplantation. J Immunol. 2009;182:148–53. doi:10.4049/jimmunol.182.1.148.
- Miyara M, Yoshioka Y, Kitoh A, Shima T, Wing K, Niwa A, Parizot C, Taflin C, Heike T, Valeyre D, et al. Functional Delineation and Differentiation Dynamics of Human CD4+ T Cells Expressing the FoxP3 Transcription Factor. Immunity. 2009;30:899–911. doi:10.1016/j.immuni.2009.03.019.
- Rosenberg S a., Yang JC, Sherry RM, Kammula US, Hughes MS, Phan GQ, Citrin DE, Restifo NP, Robbins PF, Wunderlich JR, et al. Durable complete responses in heavily pretreated patients with metastatic melanoma using T-cell transfer immunotherapy. Clin Cancer Res. 2011;17:4550–7. doi:10.1158/1078-0432.CCR-11-0116.
- Wu R, Forget M-A, Chacon J, Bernatchez C, Haymaker C, Chen JQ, Hwu P, Radvanyi LG. Adoptive T-cell therapy using autologous tumor-infiltrating lymphocytes for metastatic melanoma: current status and future outlook. Cancer J. 2012;18:160–75. doi:10.1097/PPO.0b013e31824d4465.
- Fridman WH, Pagès F, Sautès-Fridman C, Galon J. The immune contexture in human tumours: impact on clinical outcome. Nat Rev Cancer. 2012;12:298–306. doi:10.1038/nrc3245.
- Becht E, Giraldo NA, Dieu-Nosjean MC, Sautès-Fridman C, Fridman WH. Cancer immune contexture and immunotherapy. Curr Opin Immunol. 2016;39:7–13. doi:10.1016/j.coi.2015.11.009.
- Bu M, Shen Y, Seeger WL, An S, Qi R, Sanderson JA, Cai Y. Ovarian carcinoma-infiltrating regulatory T cells were more potent suppressors of CD8+ T cell inflammation than their peripheral counterparts, a function dependent on TIM3 expression. Tumor Biol. 2016;37:3949–56. doi:10.1007/s13277-015-4237-x.
- Wertel I, Surówka J, Polak G, Barczyński B, Bednarek W, Jakubowicz-Gil J, Bojarska-Junak A, Kotarski J. Macrophage-derived chemokine CCL22 and regulatory T cells in ovarian cancer patients. Tumor Biol. 2015;36:4811–7. doi:10.1007/s13277-015-3133-8.
- Curiel TJ, Coukos G, Zou L, Alvarez X, Cheng P, Mottram P, Evdemon-Hogan M, Conejo-Garcia JR, Zhang L, Burow M, et al. Specific recruitment of regulatory T cells in ovarian carcinoma fosters immune privilege and predicts reduced survival. Nat Med. 2004;10:942–9. doi:10.1038/nm1093.
- Landskron J, Helland Ø, Torgersen KM, Aandahl EM, Gjertsen BT, Bjørge L, Taskén K. Activated regulatory and memory T-cells accumulate in malignant ascites from ovarian carcinoma patients. Cancer Immunol Immunother. 2015;64:337–47. doi:10.1007/s00262-014-1636-6.
- Bronger H, Singer J, Windmüller C, Reuning U, Zech D, Delbridge C, Dorn J, Kiechle M, Schmalfeldt B, Schmitt M, et al. CXCL9 and CXCL10 predict survival and are regulated by cyclooxygenase inhibition in advanced serous ovarian cancer. Br J Cancer. 2016;115:553–63. doi:10.1038/bjc.2016.172.
- Mikucki ME, Fisher DT, Matsuzaki J, Skitzki JJ, Gaulin NB, Muhitch JB, Ku AW, Frelinger JG, Odunsi K, Gajewski TF, et al. Non-redundant requirement for CXCR3 signalling during tumoricidal T-cell trafficking across tumour vascular checkpoints. Nat Commun. 2015;6:7458. doi:10.1038/ncomms8458.
- K. Au K, Peterson N, Truesdell P, Reid-Schachter G, Khalaj K, Ren R, Francis JA, Graham CH, Craig AW, Koti M. CXCL10 alters the tumour immune microenvironment and disease progression in a syngeneic murine model of high-grade serous ovarian cancer. Gynecol Oncol. 2017;145:436–45. doi:10.1016/j.ygyno.2017.03.007.
- Hawkins RE, Roberts K, Wiltshaw E, Mundy J, McCready VR. The clinical correlates of serum CA125 in 169 patients with epithelial ovarian carcinoma. Br J Cancer 1989;60:634–7. doi:10.1038/bjc.1989.329.
- Gemer O, Segal S, Kopmar A. Preoperative CA-125 level as a predictor of non optimal cytoreduction of advanced epithelial ovarian cancer. Acta Obstet Gynecol Scand. 2001;80:583–5. doi:10.1080/j.1600-0412.2001.080006583.x.
- Bedognetti D, Spivey TL, Zhao Y, Uccellini L, Tomei S, Dudley ME, Ascierto ML, De Giorgi V, Liu Q, Delogu LG, et al. CXCR3/CCR5 pathways in metastatic melanoma patients treated with adoptive therapy and interleukin-2. Br J Cancer. 2013;109:2412–23. doi:10.1038/bjc.2013.557.
- Harlin H, Meng Y, Peterson AC, Zha Y, Tretiakova M, Slingluff C, McKee M, Gajewski TF. Chemokine expression in melanoma metastases associated with CD8 + T-CeII recruitment. Cancer Res. 2009;69:3077–85. doi:10.1158/0008-5472.CAN-08-2281.
- Zsiros E, Duttagupta P, Dangaj D, Li H, Frank R, Garrabrant T, Hagemann IS, Levine BL, June CH, Zhang L, et al. The ovarian cancer Chemokine landscape is conducive to homing of vaccine-primed and CD3/CD28-Costimulated T cells prepared for adoptive therapy. Clin Cancer Res. 2015;21:2840–50. doi:10.1158/1078-0432.CCR-14-2777.
- Attig S, Hennenlotter J, Pawelec G, Klein G, Koch SD, Pircher H, Feyerabend S, Wernet D, Stenzl A, Rammensee H-G, et al. Simultaneous infiltration of polyfunctional effector and suppressor T cells into renal cell carcinomas. Cancer Res. 2009;69:8412–9. doi:10.1158/0008-5472.CAN-09-0852.
- Donia M, Junker N, Ellebaek E, Andersen MH, Straten PT, Svane IM. Characterization and comparison of “Standard” and “Young” tumor infiltrating lymphocytes for adoptive cell therapy at a Danish Translational Research Institution. Scand J Immunol. 2011;:157–67. doi: 10.1111/j.1365-3083.2011.02640.x
- Allen SJ, Crown SE, Handel TM. Chemokine:Receptor Structure, Interactions, and Antagonism. Annu Rev Immunol. 2007;25:787–820. doi:10.1146/annurev.immunol.24.021605.090529.
- Peng W, Ye Y, Rabinovich B a, Liu C, Lou Y, Zhang M, Whittington M, Yang Y, Overwijk WW, Lizée G, et al. Transduction of tumor-specific T cells with CXCR2 chemokine receptor improves migration to tumor and antitumor immune responses. Clin Cancer Res. 2010;16:5458–68. doi:10.1158/1078-0432.CCR-10-0712.
- Moon EK, Carpenito C, Sun J, Wang L-CCS, Kapoor V, Predina J, Powell DJ, Riley JL, June CH, Albelda SM. Expression of a functional CCR2 receptor enhances tumor localization and tumor eradication by retargeted human T cells expressing a mesothelin-specific chimeric antibody receptor. Clin Cancer Res. 2011;17:4719–30. doi:10.1158/1078-0432.CCR-11-0351.
- Craddock J a, Lu A, Bear A, Pule M, Brenner MK, Rooney CM, Foster AE. Enhanced tumor trafficking of GD2 chimeric antigen receptor T cells by expression of the chemokine receptor CCR2b. J Immunother. 2010;33:780–8. doi:10.1097/CJI.0b013e3181ee6675.