
ABSTRACT
In a two-stage phase II study, 24 patients with first diagnosis of glioblastoma (GBM) were treated with dendritic cell (DC) immunotherapy associated to standard radiochemotherapy with temozolomide (TMZ) followed by adjuvant TMZ.
Three intradermal injections of mature DC loaded with autologous GBM lysate were administered before adjuvant TMZ, while 4 injections were performed during adjuvant TMZ. According to a two-stage Simon design, to proceed to the second stage progression-free survival (PFS) 12 months after surgery was expected in at least 8 cases enrolled in the first stage. Evidence of immune response and interaction with chemotherapy were investigated. After a median follow up of 17.4 months, 9 patients reached PFS12. In these patients (responders, 37.5%), DC vaccination induced a significant, persistent activation of NK cells, whose increased response was significantly associated with prolonged survival. CD8+ T cells underwent rapid expansion and priming but, after the first administration of adjuvant TMZ, failed to generate a memory status. Resistance to TMZ was associated with robust expression of the multidrug resistance protein ABCC3 in NK but not CD8+ T cells. The negative effect of TMZ on the formation of T cell-associated antitumor memory deserves consideration in future clinical trials including immunotherapy.
Introduction
Immunotherapy with dendritic cells (DC) has not yet fulfilled the promise for cancer treatment. Even if DC vaccinations have scarce toxicity and serious adverse events were not reported, clinical relevance has been hampered by the limited translation of immune activation into clinical response.Citation1,Citation2
The observation that chemotherapeutic agents like anthracyclines may exert immunostimulatory effects has generated new expectations for DC immunotherapy of cancer.Citation3-5
Clinical data on the combination of temozolomide (TMZ), with immunotherapy are limited. In vitro results suggest that TMZ, the standard chemotherapy in glioblastoma (GBM), reduces expression of the T regulatory (Treg) cell attractant CCL2 in GBM cells.Citation6,Citation7 In one patient TMZ-induced lymphopenia was synergistic with a peptide vaccine, possibly because of Treg inhibition.Citation8 In a rat model of GBM, TMZ depletes Treg cells using a “metronomic” schedule, and metronomic cyclophosphamide favors anti-glioma CD8+ T cell responses.Citation9,Citation10 Recent data in the mouse model GL261, however, showed that alkylating chemotherapy with a schedule resembling standard rather than metronomic treatment, impairs adaptive immune responses.Citation11
Overall, clinical data on the combination of TMZ and DC immunotherapy are lacking. Here we report the results of the first stage of DENDR1 (EUDRACT N° 2008-005035-15), a phase II, uncontrolled, open label, nonrandomized study in patients with first diagnosis of GBM in which DC immunotherapy is associated with standard radiotherapy and chemotherapy with TMZ.
Results
Patient treatment and survival. The schedule of the treatment and clinical features of the 24 patients are summarized in and . Sixteen patients completed all scheduled vaccinations; 7 discontinued TMZ and immunotherapy after at least 4 vaccinations because of disease progression; one patient received 6 vaccinations, experienced severe pulmonary embolism and withdrew his consent to immunotherapy.
Figure 1. Survival analysis of 24 GBM patients treated by DC immunotherapy. (A) Treatment protocol showing the timing before, during and after the DC administrations. D = day, W = week, White circle = MRI, Black diamond: clinical monitoring, White square = immune monitoring except DTH, DCn = vaccine number, Gray rectangle = maintenance TMZ (5 days/28 for 6 cycles). (B) Kaplan Meier curves showing progression free survival (PFS) and (C) overall survival (OS) of the 24 patients enrolled in the first stage of DENDR1. Kaplan Meier curves showing PFS (D) and OS (E) of patients, with methylated or unmethylated MGMT promoter in the tumor.
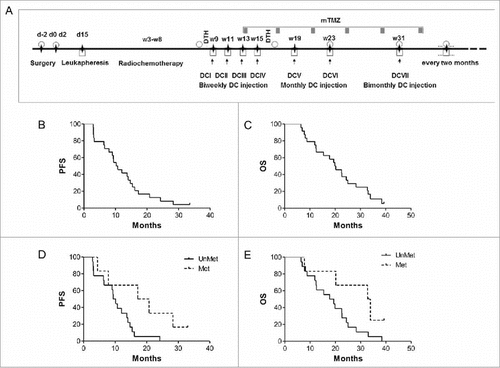
Table 1. Patient characteristics.
Twenty-two patients underwent recurrence, one died because of heart failure before progression (Pt 3) and one was still progression-free at the time of the analysis (Pt 23). Six patients with recurrence did not receive any treatment because of severe clinical worsening (Pts 5, 11, 18 and 19), while two were lost to follow-up (Pts 1 and 13). Eight of the other 16 patients had second surgery. Other treatments included bevacizumab (eight cases), chemotherapy (six cases), cyber-knife plus chemotherapy (one case) and radiotherapy (one case) (). Median follow up was 17.4 months, median PFS was 10.5 months (95% CI 9.15–15.44), PFS6 was 79% and PFS12 41% (). Nine patients were free from progression at 12 months, thus satisfying the criteria we had set for passage from stage I to stage II of the SimonCitation12 design employed in this study. Here, for brevity and clarity we defined them as responders which does not imply that all nine had evidence of response to immunotherapy.
Two of 24 patients were alive at the time of analysis: median OS was 20.1 months (95% CI: 12.5–25), OS at 12 and 24 months were 75% and 37%, respectively ().
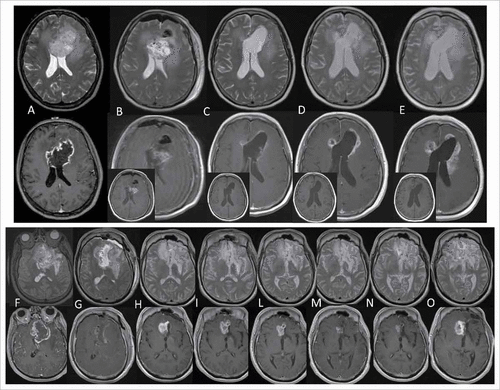
Disease progression was suspected for 5 patients (Pts 10, 11, 15, 17, 19) based on MRI performed one week after the end of concomitant radiochemotherapy. These five patients were treated and included in survival analysis: as the following MRI confirmed progression, the time of disease progression was back-dated to previous MRI. Hypermethylation of the MGMT promoter, present in 25% of patients (4 responders and 2 non-responders), was the only clinical feature associated with longer PFS and OS (P = 0.02 and P = 0.03 respectively). The median PFS was 17.2 months (CI 95% 7.9–28.3) in the presence of MGMT methylation and 10.2 months in the other cases (CI 95% 7.9–14.7) (). The median OS was 32.8 months (95%CI 20.2–33.9) in patients with MGMT methylation and 17.8 months in the others (CI 95% 14.4–22.6) (). Exemplificative MRI of one responder and one non-responder (patients number 12 and 17, respectively) are shown in .
Figure 2. Exemplificative MRI. Patient 17. Top, T2 weighted images (w.i.); bottom, contrast enhanced T1 w.i. (small box, pre-contrast T1 w.i.). (A) Pre-surgery, Dec 5, 2012 (necrotic lesion, GBM). (B). Post-surgery: Dec 6, 2012 (blood presence). (C-E) Immunotherapy: Jan, Mar and May 2013 (progressively enhancing lesion). Patient 12. Top, T2 w.i., bottom, contrast-enhanced T1 w.i. (F) Pre-surgery May 14, 2012 (necrotic lesion, GBM). (G) Post-surgery May 18, 2012 (scarce blood). (H-O) Immunotherapy: H-L (Aug 2012, Nov 2012, Jan 2013) show enhancing lesion. (M) subsequently reduced (M, Mar 2013) suggesting pseudoprogression. (N) subsequent stabilization (May 2014). (O) and disease progression (July 2014).
Vaccine safety and adverse events. Three intradermal injections of mature DC loaded with autologous whole tumor lysate were administered before adjuvant TMZ, 4 further injections were performed during adjuvant TMZ (). The treatment was well tolerated. One patient stopped treatment before disease progression due to pulmonary embolism. One patient died before progression because of deep venous thrombosis and pulmonary embolism. One case of grade 5 disseminated intravascular coagulation (DIC) was reported.
Five cases of partial seizures, 8 convulsions and 1 myositis were also recorded. Non-serious skin reactions included itching, erythema, urticaria and temporary inflammation at the injection site. A list of adverse events occurred during immunotherapy with relative grades is provided in Table S1.
Radio-chemotherapy and adjuvant chemotherapy affect CD8+ T, CD4+ T and NK cell counts. TMZ-induced lymphodepletion has been associated with expansion of a specific anti-tumor immune response.Citation13 We measured the absolute lymphocyte counts (ALCs) at leukapheresis (the basal time point), during and at the end of the treatment. Basal ALCs were > 1,000 cells per μL peripheral blood in 22/24 patients at leukapheresis, and dropped significantly after RT-TMZ (from 1710.9 ± 753.9 to 726.0 ± 276.3, P < 0.0001) (). RT-TMZ induced significant lymphopenia (<1000 lymphocytes/microl) in 19/24 patients (79%). In 6/19 patients, the ALCs were < 500 after RT-TMZ.
Figure 3. Radiotherapy and chemotherapy impact on CD8+, CD4+ T and NK cell counts. (A) Absolute lymphocyte counts in the peripheral blood of patients before (leukapheresis = leuka) and after (first vaccination = I vacc) RT-TMZ. (B-D) CD8+, CD4+ T and NK cell absolute counts before and after RT-TMZ. (E-G) Time course of CD8+ T cell count, CD4+ T cell count and NK cell count measured by flow cytometry of responder (left, n = 9) and non-responder (right, n = 15) patients over the treatment (#P < 0.01, ##P < 0.005, ###P < 0.0005 vs. 1st vaccine; underlined asterisk # vs. leukapheresis). Data are presented as mean ± SEM.
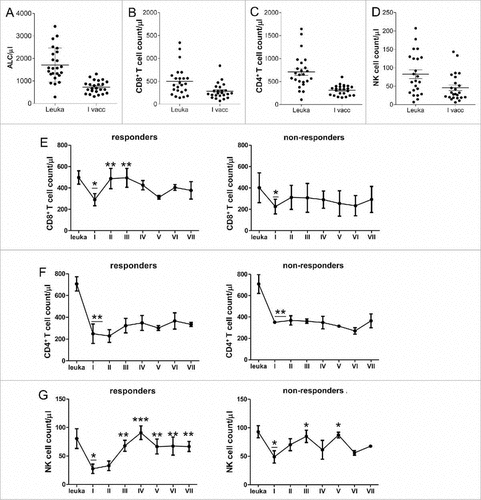
RT-TMZ decreased CD8+ T cell (499.8 ± 318.9 before RT-TMZ to 279.9 ± 165.4, P = 0.004), CD4+ T cell (from 708.0 ± 371.8 to 312.6 ± 107.7, P < 0.0005) and NK cell counts (from 88.0 ± 72.9 to 45.7 ± 37.9, P = 0.02) ().
We also investigated the absolute count of CD8+ T, CD4+ T and NK cell subsets in the peripheral blood of all patients before, during and after immunotherapy. The CD8+ T cell subset of responders only increased early after the second and third vaccination, but decreased in combination with adjuvant TMZ (). CD4+ T cell counts did not increase during vaccinations (). On the contrary, the NK cell subset of responders increased significantly after the third vaccination and remained constant over time ().
DC vaccines induce early NK cell activation followed by CD4+ T cells in a later phase. To investigate further the immune responses induced by DC vaccinations, we correlated counts and frequency of the 3 lymphocyte subsets with PFS and OS. ROC curve analysis identified 2.2 as the vaccination/baseline threshold (as defined in METHODS, Statistical analyses) to differentiate patients with high or low CD8+ T, CD4+ T and NK cells (sensitivity 88.9%, specificity 80%). V/B ratios higher than 2.2 for NK but not for CD8+ and CD4+ T cell counts were associated with prolonged PFS and OS (median PFS 16.1 months vs. 9.3 months, P = 0.002; median OS 32.8 months vs. 17.8 months, P = 0.003) (, and Fig. S1A, B). This was confirmed by correlating survival data with NK, CD8+ and CD4+ T cell frequencies (Fig. S1C-E). When the Bonferroni method was used for multiple testing, the differences remained significant (P = 0.016 for PFS and P = 0.024 for OS).
Figure 4. DC vaccination induces a significant activation of NK cells correlated with an increased survival of patients. (A, B) Kaplan-Meier analysis of the correlation between V/B ratio of NK cell counts with (A) PFS and OS (B). Median PFS of patients with high V/B ratio (> 2.2, n = 11) vs. low (≤ 2.2, n = 13): 16.1 months vs. 9.3 months (P = 0.0025); median OS: 32.8 months vs. 17.8 months (P = 0.0039). (C-D) Time course of frequency of NK cells (C), CD8+ T cells (D) expressing IFN-γ measured by flow cytometry (#P < 0.01, ##P < 0.005, ###P < 0.0005 vs. leukapheresis; underlined asterisk responders vs. non-responders). Representative dot plots are shown in Fig. S.2. (E, F) Time course of frequency of NK cells (E), CD8+ T cells CD4+ T cells (F) expressing GZMB measured by flow cytometry (G) Time course of CD4+ T cells expressing IFN-γ measured by flow cytometry. Data are presented as mean ± SEM. (H-I) Time course of IFN- γ secretion by PBLs from (H) 4 responders and (I) 4 non-responders, co-cultured for 5 days in the presence of autologous loaded mature DC.
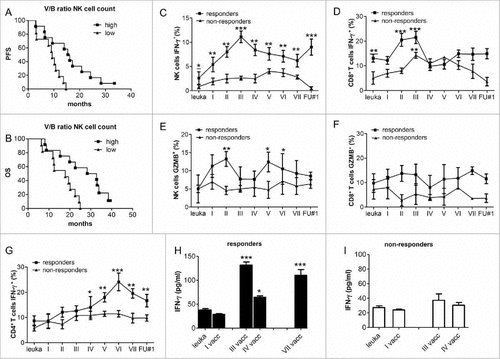
In order to investigate their independent prognostic role, a multivariate analysis and a Cox proportional hazard regression model analysis were performed on variables showing statistically significant differences at univariate analysis (i.e. MGMT methylation and V/B ratio for NK cell counts). Increased V/B ratio for NK cell counts remained the only significant predictor of PFS (P = 0.02, exp(b) 0.24, 95% CI 0.071 – 0.85) and OS (P = 0.03, exp(b)0.27, 95% CI 0.081–0.89).
To assess the specific anti-tumor immune responses induced by DC vaccinations we measured IFN-γ (, ) and granzyme-b (GZMB) (, ) expression by intracellular staining and flow cytometry on NK and CD8+ T cells in 11 patients (5 responders and 6 non-responders) with all blood specimens available (, Fig. S2A, B). After two DC vaccinations a significant expansion of NK cells expressing IFN-γ in Peripheral Blood Lymphocytes (PBLs) was detected in responders (P = 0.01 vs. leukapheresis; P = 0.02 vs. first vaccine). After the third vaccine NK cells continued to express higher levels of IFN-γ in response to and at the end of treatment (P = 0.004, responders vs. non-responders). Notably, responders showed higher IFN-γ expression by NK cells and CD8+ T cells already before RT-TMZ (2.9±1.2 vs. 0.6±0.7; P = 0.01; 13.1±1.6 vs. 5.2±2.5; P = 0.008, respectively, responders vs. non-responders). IFN-γ expressing CD8+ T cells in responders showed an early and significant expansion after the second vaccine, but a rapid depletion after the fourth vaccine, concomitant with the first cycle of adjuvant TMZ. Responders showed a significant higher percentage of NK cells expressing GZMB at the second, fifth and sixth vaccination (P = 0.03, P < 0.05, compared to leukapheresis) (). No expansion was assessed for GZMB expressing CD8+ T cells neither in responders nor in non-responders ().
Activated, IFN-γ positive CD4+ T cells showed a late but significant expansion after the fourth vaccine (P < 0.005 vs. leukapheresis) (, Fig. S2C). NK cells were also analyzed as CD56dim and CD56bright positive cells.Citation14,Citation15 The CD56dim NK cell cytotoxic subset was significantly increased in responders and persisted at the end of the treatment (Fig. S3). The assessment of NK, CD4+ and CD8+ T cells in six patients treated with the standard Stupp regimen in the FluoGlio studyCitation16 showed no significant changes in their frequency after radio-chemotherapy (Fig. S4) suggesting that DC vaccinations induce NK cell activation. We also co-cultured PBLs from 8 patients with mature DCs loaded with tumor lysate. IFN-γ production assessed by ELISA reflected values measured by flow cytometry in PBLs from responders, with a significant increase at third vaccination and decrease at fourth vaccination, after onset of adjuvant TMZ (). No difference was found in non-responders (). This observation suggests a potential direct involvement of specific anti-tumor effector cells producing IFN-γ in response to tumor antigens presented by the dendritic cells.
The results indicate that NK cells are critical immune effectors during DC vaccination and suggest that they may synergize with CD4+ T cells in a later phase, activating a clinically effective immune response.
CD8+ T cells fail to develop a memory status and NK cells are intrinsically resistant to chemotherapy. To study further the effects of adjuvant TMZ on CD8+ T cells, we examined by flow cytometry the generation of CD8+ T cell central memory (TCM) and T effector memory (TEM) during and after treatment (, ).Citation17 In responders the significant increase of the CD8+ TEM, frequency at second vaccination (P = 0.01) dropped permanently after adjuvant TMZ. We did not observe modulation of the TCM status. In non-responders we did not observe any significant expansion in the frequency of CD8+ TEM and TCM during DC vaccines.
Figure 5. NK cells, but not CD8+ T cells express and are resistant to chemotherapy. (A-B). Time course of CD8+ T effector memory and central memory cells evaluated by flow cytometry on PBMCs from 5 responders (A) and 6 non-responders (B) (##P < 0.005 vs. leukapheresis). (C) Time course of Abcc3 expression assessed by real-time PCR on PBLs of 17 patients (8 responders and 9 non-responders). (D-F) Time course of NK cell, CD8+ T cell and CD4+ T cell frequency expressing ABCC3, assessed by flow cytometry (#P < 0.01, ##P < 0.005, ###P < 0.0005 vs. leukapheresis, P = 0.02 # underlined asterisk responders vs. non-responders). Data are presented as mean ± SEM.
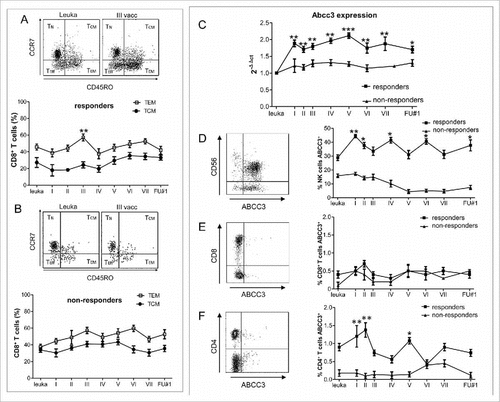
The poor contribution of CD8+ T cells to anti-tumor responses was partly compensated by strong and long-lasting NK cell responses. In order to understand this persistency, we investigated the potential involvement of the multidrug resistance protein ABCC3, based on our preclinical evidence that the efflux activity of ABCC3 confers chemoresistance to NK cells and protection from apoptotic cell death.Citation18 Abcc3 expression, investigated by real-time PCR, was significantly higher in responders (n = 8) than non-responders (n = 9; P = 0.0005) at the time of first vaccination after standard radio-chemotherapy (P = 0.02) and remained higher after concomitant vaccine and TMZ administration (P < 0.01) (). Using flow cytometry, we found that ABCC3 was expressed by NK cells but not by CD8+ T lymphocytes also in PBLs from 3 healthy volunteers (68.6 ± 16.8 vs. 1.2 ± 0.8, respectively; P = 0.0002, not shown). We also verified that at the time of leukapheresis (i.e. before radiochemotherapy), NK cells from responders displayed higher basal expression of ABCC3 than non-responders (28.7 ± 29.6% vs. 15.8 ± 17.6%, respectively; P = 0.02) (). Responders showed a further increase of ABCC3 after DC vaccinations and concomitant TMZ. In CD8+ T lymphocytes basal expression of ABCC3 was negligible () and in CD4+ T lymphocytes quite low ().
These results demonstrate that adjuvant TMZ limits the CD8+ T cell response interfering with the memory status generation. ABCC3 plays a protective role against chemotherapy potentiating NK cell response and activity.
Tumor infiltrating NK cells are associated with a down-modulation of NK activating ligands expressed by tumor cells. To investigate whether an immune infiltration was detectable in specimens of patients who developed recurrence and underwent second surgery, we characterized the tumor infiltrating lymphocytes (TILs). Specimens from Pt 8, 9, 10, 14 and 15 were analyzed for TILs by flow cytometry ( and Fig. S5) and by real time PCR for the expression of NK activating (MICA, MICB, ULBP1-3) or inhibiting (HLA-E) ligands and receptors (NKp30, NKp44, NKp46, NKp80, NKG2D) (). In three cases (Pts 9, 10, 15) NK cell infiltration reflected the peripheral NK cell response (V/B ratio>2.2). An impressive infiltration of NK cells was found in Pt 9 (responder) (). The expression of NK ligands was totally lost, however, (), a potential cause of the lack of tumor growth control. A reduction of NK activating ligands and receptors in second compared to first surgery specimen was also observed in Pt 15, showing a massive NK cell infiltration (, ). The second surgery of Pt10 was characterized by the removal of two different tumor specimens. The larger tumor mass showed the evolution from GBM to gliosarcoma with little immune infiltration, while the smaller fragment was highly infiltrated by NK cells and expressed higher levels of NK activating ligands and receptors compared to first surgery (). CD8+ and CD4+ T cell infiltration for Pts 8, 9 and 15 are reported in Fig. S5. Pt 14 (non-responder) showed absence of immune cell infiltration, no expression of NK activating ligands and receptors, but significant up-regulation of HLA-E in both specimens.
Figure 6. Tumor infiltrating NK cell activity was influenced by the expression of activating or inhibiting NK ligands and receptors. (A) Dot plots showing the percentage of NK cells infiltrating tumor mass of four patients as evaluated by flow cytometry. (B-E) Bar graphs showing the relative expression of activating (MICA, MICB, ULBP1-3) or inhibiting (HLA-E) ligands and receptors (NKp30, NKp44, NKp46, NKp80, NKG2D) in specimens from first and second surgery of five patients (four non-responders – Pts 8, 10, 14, 15 – and one responder – Pt9), evaluated by real time PCR. The relative expression of ligands and receptors was compared with that detected in normal brain tissue (dotted line).
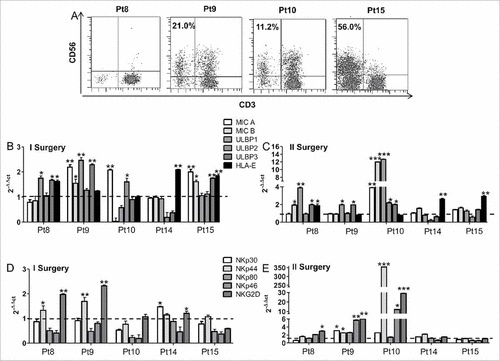
These results indicate that peripheral and local NK cell response can be similar. However, the down-regulation of NK activating ligands can jeopardize the local anti-tumor activity of NK cells.
Discussion
Previously, we found that increased survival in patients with recurrent GBM treated by DC immunotherapy was primarily associated with tumor debulking and NK cell responses.Citation19 In the first stage of this phase II study, DENDR1, survival data of patients with primary GBM met the criteria for passage to the second stage of the Simon design. Data on OS were further analyzed using model 3 of the EORTC nomogram to predict survival in GBM patients taking into account MGMT methylation, Mini Mental Score Examination and WHO performance status (17). The actual OS in DENDR1 compared favorably with expected OS (13.0 months; 95% CI 11.4–14.9). The expected OS was 66% at 12 months, and 23% at 24 months, P = 0.004.Citation20
While our study was running another study at our Institution, FluoGlio, enrolled patients with primary GBM that had surgery with intra-operatory use of fluorescein to help defining tumor borders.Citation16 Survival data in DENDR1 compare favorably with FluoGlio (median PFS and OS 10.5 and 20.1 months in DENDR1 and 7 and 12 months in FluoGlio).
Results also confirmed the safety of DC immunotherapy. One patient had fatal disseminated intravascular coagulation. However, the timing (last vaccination two months before death) and lack of data in the literature do not support the involvement of DC immunotherapy in this severe adverse event, while the natural history of malignant gliomas does include coagulation disorders.Citation21
DENDR1 demonstrates that the increase of NK cells in peripheral blood after DC vaccinations is strongly associated with prolonged survival. Previous work showed that DC have a critical role in priming NK cells thanks to trans-presentation of interleukin (IL)-15.Citation22,Citation23 NK cell collaboration with DC is critical to promote recruitment of effector CD8+ T cells to the tumor microenvironment,Citation24 an interaction that is critically dependent on IL-18 release.Citation25,Citation26 However, recent data in murine models indicate that NK cells may also restrain spontaneous CD8+ T cell priming through DC interaction mediated by the PD-1-PD-L1 checkpoint.Citation27 It is conceivable that such inhibition also took place in our patients, suggesting that combination with checkpoint inhibitors may boost the anti-tumor efficacy of DC immunotherapy.
Another constraint to the development of CD8+ T cell antitumor activity and memory is likely due to their exquisite sensitivity to TMZ. We found that administration of adjuvant TMZ exerts negative effects on CD8+ T cell activation and in particular on the generation of immune memory and central memory.Citation17 Long-term CD8+ T cell responses were negligible not only in non-responders but also in responders, even if their pre-existing activation before RT-TMZ confirmed that GBM patients may exhibit tumor-specific CD8+ T cells in peripheral blood.Citation28
Notably, results of DENDR1 confirmed our preclinical observation that the multidrug resistance protein ABCC3 is up-regulated in NK but not in CD8+ T cells during TMZ treatment.Citation18 The expression and activity of this transporter were elements supporting chemoresistance in breast and non-small cell lung cancers but have not been fully appreciated as a tool of chemoresistance in immune cells.Citation29,Citation30 As only a subset of patients benefits from chemo-immunotherapy combination, our hypothesis is that ABCC3 represents a predictive marker of resistance of NK cells to TMZ forecasting a robust and long-lasting response associated to increased survival. This may be of critical relevance, as suggested by data in rodent models showing that intra-tumor but not systemic delivery of TMZ supports a strong CD8+ T cell-based immune response.Citation31 In these experiments and in others showing lack of CD8+ T cell activation, high dose TMZ was used (25–75 mg/kg).Citation11,Citation31 In the presence of low dose TMZ (2.5 mg/kg) or metronomic schedules, such activation was present.Citation9,Citation32,Citation33 Metronomic TMZ could be a viable option for combination with immunotherapy as it has been already used in primary and recurrent GBM with acceptable toxicity and some evidence of efficacy.Citation9,Citation34
In conclusion, DENDR1 showed an encouraging gain in patient survival in the absence of major toxicity. Such gain appeared significantly dependent on NK cell activation. To complete such immune response with the contribution of CD8+T cells, the schedule of TMZ administration should be carefully re-evaluated.
Material and methods
Clinical study. A 2-phase Simon design was used for the clinical study DENDR1 (EUDRACT N° 2008-005035-15).Citation12 The primary goal was to evaluate progression free survival (PFS) rate 12 months after surgery (PFS12). Assuming as primary endpoint the percentage of PFS12 patients and an increase to 42% of the historical control rate of 27%,Citation6 the alternative hypothesis will be rejected at the end of the first stage if the PFS12 rate will be less than 8/24 treated patients. Safety, feasibility and evidence of immune response are considered. The clinical protocol was approved by local and national regulatory authorities including Besta Ethical Committee, Istituto Superiore di Sanità (ISS) and AIFA (Italian Medicine Agency), and is sponsored by Istituto Neurologico Besta (see protocol as Supplemental File).
Population and treatment Protocol. Twenty-four patients with first diagnosis of GBM and no IDH1-2 mutations were enrolled after written informed consent, using the following inclusion criteria: histologically proven GBM, age ≥18 and ≤70 years, no multifocal or sub-ependymal diffusion of the tumor, residual tumor volume after surgery <10 ml, confirmed by postoperative Magnetic Resonance Imaging (MRI) assessment, dexamethasone daily dose ≤4 mg during the 2 days prior to leukapheresis, Karnofsky performance status (KPS) ≥70, non-necrotic tissue for lysate preparation and DC loading ≥1 gr and stored in liquid nitrogen, absence of past or current autoimmune disease. After surgery, patients underwent leukapheresis and radiochemotherapy (RT-TMZ), according to the Stupp protocol.Citation6 DC were loaded with whole tumor lysate and produced under Good Manufacturing Practices (GMP) conditions.Citation19,Citation35,Citation36 On day 15 after surgery, leukapheresis and basal clinical, radiological and immune testing were performed. Delayed-Type Hypersensitivity (DTH) skin reactions, injecting Ag purified tuberculin as control and 10 mg of inactivated tumor lysate, were tested before and after vaccinations 1–4. The first 4 vaccinations with tumor lysate loaded DC were performed every two weeks, from week 9 to 15. After the fourth vaccine, MRI was performed. Vaccinations 5 and 6 were spaced one month (week 19 and 23, respectively). The last vaccine dose (the 7th) was on week 31. At each vaccine injection, clinical and immune monitoring was performed. From the end of immunotherapy on, MRI, clinical and immune monitoring were continued every 2 months. The 1st, 5th, 6th and 7th vaccines contained 10 million DC; the 2nd, 3rd and 4th vaccines 5 million DC. Adjuvant TMZ started immediately after 3rd vaccination and continued for 6 cycles ().
MRI and response evaluation. Patients underwent conventional contrast enhanced MRI (see Supplementary Data for detailed radiological protocol) within two days after surgery, within two days before the first vaccination, every two months, or in case of clinical worsening. Tumor volumes were determined on the 3D post gadolinium T1 weighted images by manually outlining the enhancing portion of the lesion in MRIcro (http://www.mricro.com). To calculate the total enhancing volume of the tumor, the number of enhancing voxels was multiplied by the voxel size. Disease progression was defined according to RANO criteria.Citation37
Immune monitoring. Immune monitoring was performed on the whole blood of each patient before, during and after DC vaccinations. The immune responses were assessed before the treatment, after each vaccination and at the end of the treatment until tumor recurrence. Eight patients were re-operated (Pt 2, 8, 9, 10, 14, 15, 16, 24). No adequate/sufficient material was obtained from surgery of Pt 2 and 17; Pt 24 underwent surgery in another institute. Tumor infiltrating immune cells were isolated by tumor specimens obtained from Pt 8, 9, 10, 14 and 15 using human Tumor Dissociation Kit in combination with GentleMACS (Miltenyi Biotec). Antibodies, staining for effector activation, memory status formation and real time PCR protocols are reported in Supplementary Data.
Statistical analyses. The ratio of the mean of vaccinations (2nd to 7th)/baseline values (V/B ratio) of absolute count and frequency of NK cells, CD8+ and CD4+ T cells for each patient was calculated, and the median of all of the observations was used as the cut off value to separate patients into the “low” or “high” groups. The threshold able to separate patients with “low” or “high” V/B ratio and having the best sensitivity and specificity, was defined using Receiver Operating Characteristic (ROC) curves. PFS was calculated from first surgery until disease progression and death/last follow-up, if censored. Overall Survival (OS) was calculated from surgery to death due to any cause or last follow-up (censored). Kaplan-Meier analysis was used to estimate PFS and OS. The log rank test assessed differences in progression or survival in patients with different immunological or clinical parameters.
Disclosure of potential conflicts of interest
No potential conflicts of interest were disclosed.
Supp_data.zip
Download Zip (3.8 MB)Acknowledgments
We thank the patients participating in the clinical study and their families. This work was supported by “Il Fondo di Gio Onlus”.
We thank Patrizia Crivori and other colleagues of the CRO Clioss; the colleagues from the Department of Neurosurgery of the Istituto Besta who collaborated to patient selection, the staff of the cell factory (Cell Therapy Production Unit—UPTC): Sara Nava, Daniela Lisini and Simona Pogliani; the Besta Brain Tumor Biobank (BBTB), Mr Piero Tieni (SOL Group Spa, Italy) for the cryo-management service and the technical assistance.
DENDR1 is sponsored by Istituto Neurologico Besta. This study is carried out as part of an oncology network (Rete Oncologica Lombarda) and funded referring to the deliberations of the regional council of Regione Lombardia no VIII/010761 of 11-12-2009 and DGR IX/1485 of 30-03-2011.
References
- Anguille S, Smits EL, Lion E, van Tendeloo VF, Berneman ZN. Clinical use of dendritic cells for cancer therapy. Lancet Oncol. 2014;15:e257–67. doi:10.1016/S1470-2045(13)70585-0
- Finocchiaro G, Pellegatta S. Perspectives for immunotherapy in glioblastoma treatment. Curr Opin Oncol. 2014;26:608–614. doi:10.1097/CCO.0000000000000135
- Lesterhuis WJ, Haanen JB, Punt CJ. Cancer immunotherapy–revisited. Nat Rev Drug Discov. 2011;10:591–600. doi:10.1038/nrd3500
- Zitvogel L, Apetoh L, Ghiringhelli F, Kroemer G. Immunological aspects of cancer chemotherapy. Nat Rev Immunol. 2008;8:59–73. doi:10.1038/nri2216
- Galluzzi L, Senovilla L, Zitvogel L, Kroemer G. The secret ally: immunostimulation by anticancer drugs. Nat Rev Drug Discov. 2012;11:215–233. doi:10.1038/nrd3626
- Stupp R, Mason WP, van den Bent MJ, Weller M, Fisher B, Taphoorn MJ, Belanger K, Brandes AA, Marosi C, Bogdahn U, et al. Radiotherapy plus concomitant and adjuvant temozolomide for glioblastoma. N Engl J Med. 2005;352:987–996. doi:10.1056/NEJMoa043330
- Jordan JT, Sun W, Hussain SF, DeAngulo G, Prabhu SS, Heimberger AB. Preferential migration of regulatory T cells mediated by glioma-secreted chemokines can be blocked with chemotherapy. Cancer Immunol Immunother. 2008;57:123–131. doi:10.1007/s00262-007-0336-x
- Heimberger AB, Sun W, Hussain SF, Dey M, Crutcher L, Aldape K, Gilbert M, Hassenbusch SJ, Sawaya R, Schmittling B, et al. Immunological responses in a patient with glioblastoma multiforme treated with sequential courses of temozolomide and immunotherapy: case study. Neuro Oncol. 2008;10:98–103. doi:10.1215/15228517-2007-046
- Banissi C, Ghiringhelli F, Chen L, Carpentier AF. Treg depletion with a low-dose metronomic temozolomide regimen in a rat glioma model. Cancer Immunol Immunother. 2009;58:1627–1634. doi:10.1007/s00262-009-0671-1
- Wu J, Waxman DJ. Metronomic cyclophosphamide eradicates large implanted GL261 gliomas by activating antitumor Cd8(+) T-cell responses and immune memory. Oncoimmunology. 2015;4:e1005521. doi:10.1080/2162402X.2015.1005521
- Litterman AJ, Zellmer DM, Grinnen KL, Hunt MA, Dudek AZ, Salazar AM, Ohlfest JR. Profound impairment of adaptive immune responses by alkylating chemotherapy. J Immunol. 2013;190:6259–6268. doi:10.4049/jimmunol.1203539
- Simon R. Optimal two-stage designs for phase II clinical trials. Control Clin Trials. 1989;10:1–10. doi:10.1016/0197-2456(89)90015-9
- Sampson JH, Aldape KD, Archer GE, Coan A, Desjardins A, Friedman AH, Friedman HS, Gilbert MR, Herndon JE, McLendon RE, et al. Greater chemotherapy-induced lymphopenia enhances tumor-specific immune responses that eliminate EGFRvIII-expressing tumor cells in patients with glioblastoma. Neuro Oncol. 2011;13:324–333. doi:10.1093/neuonc/noq157
- Jacobs R, Hintzen G, Kemper A, Beul K, Kempf S, Behrens G, Sykora KW, Schmidt RE. CD56bright cells differ in their KIR repertoire and cytotoxic features from CD56 dim NK cells. Eur J Immunol. 2001;31:3121–3127. doi:10.1002/1521-4141(2001010)31:10<3121::AID-IMMU3121>3.0.CO;2-4
- Cooper MA, Fehniger TA, Caligiuri MA. The biology of human natural killer-cell subsets. Trends Immunol. 2001;22:633–640. doi:10.1016/S1471-4906(01)02060-9
- Acerbi F, Broggi M, Schebesch K-M, Höhne J, Cavallo C, De Laurentis C, Eoli M, Anghileri E, Servida M, Boffano C, et al. Fluorescein-guided surgery for resection of high-grade gliomas: A multicentric prospective phase II study (FLUOGLIO). Clin Cancer Res. 2018;24(1):52–61. doi:10.1158/1078-0432
- Harty JT, Badovinac VP. Shaping and reshaping CD8+ T-cell memory. Nat Rev Immunol. 2008;8:107–119. doi:10.1038/nri2251
- Pessina S, Cantini G, Kapetis D, Cazzato E, Di Ianni N, Finocchiaro G, Pellegatta S. The multidrug-resistance transporter Abcc3 protects NK cells from chemotherapy in a murine model of malignant glioma. Oncoimmunology. 2016;5:e1108513. doi:10.1080/2162402X.2015.1108513
- Pellegatta S, Eoli M, Frigerio S, Antozzi C, Bruzzone MG, Cantini G, Nava S, Anghileri E, Cuppini L, Cuccarini V, et al. The natural killer cell response and tumor debulking are associated with prolonged survival in recurrent glioblastoma patients receiving dendritic cells loaded with autologous tumor lysates. Oncoimmunology. 2013;2:e23401. doi:10.4161/onci.23401
- Gorlia T, van den Bent MJ, Hegi ME, Mirimanoff RO, Weller M, Cairncross JG, Eisenhauer E, Belanger K, Brandes AA, Allgeier A, et al. Nomograms for predicting survival of patients with newly diagnosed glioblastoma: prognostic factor analysis of EORTC and NCIC trial 26981-22981/CE.3. Lancet Oncol. 2008;9:29–38. doi:10.1016/S1470-2045(07)70384-4
- Sciacca FL, Ciusani E, Silvani A, Corsini E, Frigerio S, Pogliani S, Parati E, Croci D, Boiardi A, Salmaggi A. Genetic and plasma markers of venous thromboembolism in patients with high grade glioma. Clin Cancer Res. 2004;10:1312–1317. doi:10.1158/1078-0432.CCR-03-0198
- Long EO. Ready for prime time: NK cell priming by dendritic cells. Immunity. 2007;26:385–387. doi:10.1016/j.immuni.2007.04.001
- Lucas M, Schachterle W, Oberle K, Aichele P, Diefenbach A. Dendritic cells prime natural killer cells by trans-presenting interleukin 15. Immunity. 2007;26:503–517. doi:10.1016/j.immuni.2007.03.006
- Bouwer AL, Saunderson SC, Caldwell FJ, Damani TT, Pelham SJ, Dunn AC, Jack RW, Stoitzner P, McLellan AD. NK cells are required for dendritic cell-based immunotherapy at the time of tumor challenge. J Immunol. 2014;192:2514–2521. doi:10.4049/jimmunol.1202797
- Wong JL, Berk E, Edwards RP, Kalinski P. IL-18-primed helper NK cells collaborate with dendritic cells to promote recruitment of effector CD8+ T cells to the tumor microenvironment. Cancer Res. 2013;73:4653–4662. doi:10.1158/0008-5472.CAN-12-4366
- Mingozzi F, Spreafico R, Gorletta T, Cigni C, Di Gioia M, Caccia M, Sironi L, Collini M, Soncini M, Rusconi M, et al. Prolonged contact with dendritic cells turns lymph node-resident NK cells into anti-tumor effectors. EMBO Mol Med. 2016;8:1039–1051. doi:10.15252/emmm.201506164
- Iraolagoitia XL, Spallanzani RG, Torres NI, Araya RE, Ziblat A, Domaica CI, Sierra JM, Nuñez SY, Secchiari F, Gajewski TF, et al. NK Cells restrain spontaneous Antitumor CD8+ T Cell Priming through PD-1/PD-L1 interactions with dendritic cells. J Immunol. 2016;197:953–961. doi:10.4049/jimmunol.1502291
- Tang J, Flomenberg P, Harshyne L, Kenyon L, Andrews DW. Glioblastoma patients exhibit circulating tumor-specific CD8+ T cells. Clin Cancer Res. 2005;11:5292–5299. doi:10.1158/1078-0432.CCR-05-0545
- Zhao Y, Lu H, Yan A, Yang Y, Meng Q, Sun L, Pang H, Li C, Dong X, Cai L. ABCC3 as a marker for multidrug resistance in non-small cell lung cancer. Sci Rep. 2013;3:3120. doi:10.1038/srep03120
- Balaji SA, Udupa N, Chamallamudi MR, Gupta V, Rangarajan A. Role of the drug transporter ABCC3 in breast cancer chemoresistance. PLoS ONE. 2016;11:e0155013. doi:10.1371/journal.pone.0155013
- Fritzell S, Sandén E, Eberstål S, Visse E, Darabi A, Siesjö P. Intratumoral temozolomide synergizes with immunotherapy in a T cell-dependent fashion. Cancer Immunol Immunother. 2013;62:1463–1474. doi:10.1007/s00262-013-1449-z
- Park SD, Kim CH, Kim CK, Park JA, Sohn HJ, Hong YK, Kim TG. Cross-priming by temozolomide enhances antitumor immunity of dendritic cell vaccination in murine brain tumor model. Vaccine. 2007;25:3485–3491. doi:10.1016/j.vaccine.2006.12.060
- Kim TG, Kim CH, Park JS, Park SD, Kim CK, Chung DS, Hong YK. Immunological factors relating to the antitumor effect of temozolomide chemoimmunotherapy in a murine glioma model. Clin Vaccine Immunol. 2010;17:143–153. doi:10.1128/CVI.00292-09
- Perry JR, Bélanger K, Mason WP, Fulton D, Kavan P, Easaw J, Shields C, Kirby S, Macdonald DR, Eisenstat DD, et al. Phase II trial of continuous dose-intense temozolomide in recurrent malignant glioma: RESCUE study. J Clin Oncol. 2010;28:2051–2057. doi:10.1200/JCO.2009.26.5520
- Nava S, Lisini D, Pogliani S, Dossena M, Bersano A, Pellegatta S, Parati E, Finocchiaro G, Frigerio S. Safe and reproducible preparation of functional dendritic cells for immunotherapy in Glioblastoma patients. Stem Cells Transl Med. 2015;4:1164–1172. doi:10.5966/sctm.2015-0091
- Nava S, Dossena M, Pogliani S, Pellegatta S, Antozzi C, Baggi F, Gellera C, Pollo B, Parati EA, Finocchiaro G, et al. An optimized method for manufacturing a clinical scale dendritic cell-based vaccine for the treatment of glioblastoma. PLoS ONE. 2012;7:e52301. doi:10.1371/journal.pone.0052301
- Wen PY, Macdonald DR, Reardon DA, Cloughesy TF, Sorensen AG, Galanis E, Degroot J, Wick W, Gilbert MR, Lassman AB, et al. Updated response assessment criteria for high-grade gliomas: response assessment in neuro-oncology working group. J Clin Oncol. 2010;28:1963–1972. doi:10.1200/JCO.2009.26.3541