
ABSTRACT
Exosomes can mediate a dynamic method of communication between malignancies, including those sequestered in the central nervous system and the immune system. We sought to determine whether exosomes from glioblastoma (GBM)-derived stem cells (GSCs) can induce immunosuppression. We report that GSC-derived exosomes (GDEs) have a predilection for monocytes, the precursor to macrophages. The GDEs traverse the monocyte cytoplasm, cause a reorganization of the actin cytoskeleton, and skew monocytes toward the immune suppresive M2 phenotype, including programmed death-ligand 1 (PD-L1) expression. Mass spectrometry analysis demonstrated that the GDEs contain a variety of components, including members of the signal transducer and activator of transcription 3 (STAT3) pathway that functionally mediate this immune suppressive switch. Western blot analysis revealed that upregulation of PD-L1 in GSC exosome-treated monocytes and GBM-patient-infiltrating CD14+ cells predominantly correlates with increased phosphorylation of STAT3, and in some cases, with phosphorylated p70S6 kinase and Erk1/2. Cumulatively, these data indicate that GDEs are secreted GBM-released factors that are potent modulators of the GBM-associated immunosuppressive microenvironment.
Introduction
Exosomes are 30–120 nM microvesicles secreted by variety of cells through exocytosis that can exert a wide variety of biological effects on target cells. The exosome consists of a bilipid layer containing embedded proteins and RNA, which are stabilized by its three-dimensional structure. It can conserve bioactivity (based on a protective membrane structure), enhance biodistribution, and support interactions with target cells in local or remote tissues.Citation1 Exosomes can enter target cells by fusion with the plasma membrane, endocytosis, micropinocytosis, phagocytosis, and lipid raft-mediated internalization.Citation2 When exosomes are internalized, actin filaments and microtubules participate in transporting them within the cytoplasm, eventually delivering them to the lysosome.Citation3 Glioblastoma-derived exosomes can be internalized through nonclassical, lipid raft-dependent endocytosis that involves extracellular signal-regulated kinase-1/2 (ERK1/2) and heat shock protein 27 (HSP27).Citation4
The peripheral blood from glioblastoma patients contains exosomes secreted by glioblastoma cells, and these exosomes can carry characteristic glioblastoma tumor protein markers such as the epidermal growth factor receptor (EGFR), EGFR variant III (EGFRvIII), and IDH1-R132H.Citation5 The oncogenic EGFRvIII-expressing exosomes have been shown to transform glioma cells.Citation6 The biological importance of tumor-derived exosomes stems from their capacity to be involved in both autocrine and paracrine communication. For example, treatment of the U-87 glioma cell line with exosomes isolated from ex vivo primary glioblastoma cells promotes U-87 cell proliferation, suggesting a role of exosomes in a self-propogating cycle.Citation7 Additionally, exosomes, by transferring functional mRNA and proteins, have been shown to modulate glioma-supportive cellular populations such as the endothelium,Citation7 thereby promoting tumor angiogenesis.Citation8 Cumulatively, these data indicate that exosomes participate in the glioma transformation/progression process, but emerging data also indicate that exosomes influence glioblastoma immune responses.
Serum exosomes isolated from glioblastoma patients have been shown to contain immunomodulatory molecules such as transforming growth factor (TGF)-β, antigen-presenting molecules, tumor antigens, and immune intracellular adhesion molecules.Citation9 Incubation of dendritic cells with glioma-derived exosomes can induce T-cell activation and in vitro antiglioma cytotoxicity.Citation10 Although immunization of mice with exosomes derived from a syngeneic murine glioma expressing EGFRvIII results in both EGFRvIII-specific humoral and cellular immune responses, there is no prolongation of survival in established orthotopic models.Citation9 These results are consistent with the immunological presentation of a tumor antigen such as EGFRvIII, but a failure to fully activate antitumor immunity. Other studies have shown that tumor-derived exosomes are markedly immune suppressive by inhibiting NK-cell tumor cytotoxicity,Citation11 preventing the differentiation of myeloid precursors into dendritic cells,Citation12 inducing T-cell apoptosis by expressing the Fas ligand,Citation13 impairing lymphocyte responses to IL-2,Citation14 and expanding the number of regulatory T cells (Tregs).Citation15 Overall, the evidence indicates that tumor-derived exosomes are immune suppressive and that tumors exploit exosomes to modulate the immune system.
Macrophages constitute 20% of all myeloid cells infiltrating glioblastomaCitation16 and likely originate from the differentation of peripheral monocytes recruited by a variety of tumor-derived signals.Citation17 The macrophage can become polarized to the classical proinflammatory M1 phenotype or the tumor-supportive/propagative M2 phenotype in response to extracellular signaling molecules and cytokines present within the tumor microenvironement.Citation18 Macrophages designated as the M1 phenotype are capable of phagocytosis, cytotoxicity, antigen processing & presentation, and the promotion of inflammation. In contrast, M2 macrophages lose their proinflammatory antitumor immune functionalities and have been shown to promote cancer by enhancing tumor invasiveness and angiogenesis.Citation19 We have recently shown that glioblastoma-infiltrating monocyte cells are most phenotypically and functionally aligned in a continuum from a nonpolarized M0 macrophage to an M2 phenotype.Citation16 Although it's known that exosomes secreted from glioblastomas can enter the peripheral circulationCitation7,Citation9 and elicit immune responses,Citation9,Citation10 the direct and indirect effects of exosomes on various immune system cell populations are still relatively uncharacterized. Based on our previous findings that the supernatants from glioblastoma (GBM)-derived stem cells (GSCs) can induce a preferential skewing of monocytes to a tumor-supportive macrophage/M2 phenotype,Citation19 we postulated that the exosome is an unappreciated participant in this response. We have now found that monocytes preferentially and quickly take up GSC-derived exosomes (GDEs), releasing a variety of factors, but especially, a key molecular hub of tumor-mediated immune suppression—the signal transducer and activator of transcription 3 (STAT3),Citation20 thereby triggering up regulation of programmed death ligand 1 (PD-L1) and the immunosupressive M2 phenotype.
Materials and methods
Additional details can be found in the Supplementary Methods.
Human subjects
This study was approved by the institutional review board of The University of Texas MD Anderson Cancer Center and conducted under protocol #LAB03-0687. Peripheral blood mononuclear cells (PBMCs) were purified from healthy blood donors (Gulf Coast Blood Center, Houston, TX), healthy donors (volunteers, n = 3) and from intraoperative blood samples from glioblastoma patients (n = 3), by centrifugation on a Ficoll-Hypaque density gradient (Sigma-Aldrich, St. Louis, MO). Patients' tumors were graded pathologically as newly diagnosed adult glioblastomas (n = 6) by a neuropathologist, according to the World Health Organization classification. At least 2 g of viable, nonnecrotic tumor were required to obtain sufficient quantities of immune cells for analysis, and samples were processed within one hour after resection. CD14+ monocytes were isolated from PBMCs by positive selection, using CD14 microbeads (Miltenyi Biotech, San Diego, CA) per the manufacturer's instructions and cultured for 48 hours in RPMI-1640 medium (Corning, NY) supplemented with 20% FBS (Sigma-Aldrich) with no antibiotics and no growth factors. GBM-infiltrating CD14+ cells were isolated as previously described.Citation16 CD3+ T cells were purified from PBMCs by negative selection using a T Lymphocyte Enrichment Set-DM (BD Biosciences, San Jose, CA). T cells were cultured in RPMI-1640 medium and activated with 1 µg/ml anti-CD3/anti-CD28 antibodies (BD Biosciences). NK cells were purified from PBMCs by negative selection using a Human NK Cell Isolation Kit (Miltenyi Biotec). NK cells were cultured in CellGro SCGM medium (CellGenix, San Juan Capistrano, CA) and activated with 100 ng/ml phorbol 12-myristate 13-acetate (PMA) and 1 µg/ml ionomycin.
Cell culture
GSCs (GSC20, GSC267, GSC17) were cultured in Dulbecco's modified Eagle's F-12 medium containing 20 ng/ml of both epidermal growth factor and basic fibroblast growth factor (all from Sigma-Aldrich), B27 (1:50; Invitrogen, Carlsbad, CA), 100 units/ml of penicillin and 100 μg/ml streptomycin (Thermo Fisher Scientific, Waltham, MA) as stem cell-permissive medium (neurosphere medium) and passaged every 5–7 d. The characteristics of these cells, including their cytogenetics, limiting dilution assays, tumorigenicity, CD133 expression, and immune-suppressive properties, have been previously published.Citation21 MRC5, WI38, and U87 cells were purchased from American Type Culture Collection (ATCC, Manassas, VA). MRC5 and WI38 fibroblast cells were cultured in Eagle's Minimum Essential Medium (ATCC), supplemented with 10% FBS (Sigma-Aldrich), 100 units/ml penicillin and 100 μg/ml streptomycin. U87 cells were cultured in Minimum Essential Medium (Corning), supplemented with 10% FBS (Sigma-Aldrich), 1% nonessential amino acids (Thermo Fisher Scientific), 100 units/ml penicillin and 100 μg/ml streptomycin. Three days before exosome isolation from fibroblasts and U87 cells, the medium was replaced with fresh medium, supplemented with 5% exosome-depleted FBS (System Biosciences, Palo Alto, CA), 100 units/ml penicillin and 100 μg/ml streptomycin, 1% nonessential amino acids (U87 cells). All cell lines were routinely tested for Mycoplasma and were negative prior to use.
Exosome isolation and characterization
Exosomes were isolated by the differential centrifugation method.Citation22 Briefly, the GSC culture medium was centrifuged at 300 g for 10 min to pellet cells, filtered through 0.22 µm bottle-top vacuum system (Corning), then centrifuged at 2000 g for 10 min to remove dead cells. Cell debris was removed by centrifugation at 10,000 g for 30 min. Exosomes were pelleted by ultracentrifuge at 100,000 g for 70 min and washed with PBS once, then pelleted again by ultracentrifuge at 100,000 g for another 70 min. The exosome pellet was resuspended in PBS for subsequent tests. Exosome numbers were quantified using a NanoSight NS300. 2 × 10¹⁰ exosomes were added to 1 × 10⁶ immune cells. Pre-enriched exosomes were resuspended in PBS and bound to CD63-coated Dynabeads (Thermo Fisher Scientific) during an overnight incubation. The following day the Dynabeads-bound exosomes were stained with IgG control antibodies, CD63-FITC, and CD9-Brilliant Violet 510 (BD Biosciences) and analyzed by a Gallios 561 flow cytometer (Beckam Coulter, Indianapolis, IN).
Statistics
Simple linear regression was used to compare the size of the cell cytoplasm area after logarithmic transformation. Mixed effect linear regression was applied to compare the percentage of positive cells after logit transformation and to compare MFI or relative pixel density after logarithmic transformation. These analyses were performed using statistical software Rv3.3.1 with packages boot v1.3-15 and nlme v3.1-120. The level of statistical significance was set at P < 0.05.
Results
Intracellular uptake of exosomes by populations of immune cells is variable
GDEs were isolated and found to be an average size of 110 nm in diameter by nanosight and transmission electron microscopyCitation22 and to express CD63 and CD9Citation23 (), consistent with the defining features of exosomes. To characterize the biological interaction between GSC-derived exosomes and immune cells, PBMCs were incubated with PKH67-labeled GSC20-derived exosomes and stained for surface markers denoting specific immune populations such as T cells (CD4 and CD8), monocytes (CD14), B cells (CD19), and NK cells (CD56). CD4+, CD8+ T cells, and CD56+ NK cells from both normal donors and glioblastoma patients rarely incorporated exosomes within 6 hours of coincubation (,), whereas CD14+ monocytes frequently took up GSC20 exosomes. After stimulation, both CD4+ and CD8+ T cells, but not CD56+ NK cells could also uptake exosomes (), indicating that immune activation status plays a role in exosome immune incorporation.
Figure 1. Characterization of exosomes. (A) Representative histograms of exosomes derived from MRC5, U87, GSC20, and GSC267 cells. Axis X = size distribution [nm]. Axis Y = concentration [particles/ml]. (B) Representative transmission electron microscope images of exosomes isolated from GSC20. Scale bar = 100 nm. (C) and (D) Flow cytometric analysis of GSC20 and MRC5 exosomes bound to Dynabeads. (C) Left dot plot FSC-A/SSC-A shows the singlet and bead/exosome complex [G1] and the aggregated bead/exosome complex [G2]. Right histograms were gated on G1. MRC5 and GSC20 exosomes were bound to CD63-coated Dynabeads and stained with isotype controls (dashed line) or CD63-FITC, CD9-Brilliant Violet 510 (solid line), and analyzed by flow cytometry. (D) The mean fluorescence intensity [MFI] of CD63 and CD9 expression in MRC5 and GSC20 exosomes.
![Figure 1. Characterization of exosomes. (A) Representative histograms of exosomes derived from MRC5, U87, GSC20, and GSC267 cells. Axis X = size distribution [nm]. Axis Y = concentration [particles/ml]. (B) Representative transmission electron microscope images of exosomes isolated from GSC20. Scale bar = 100 nm. (C) and (D) Flow cytometric analysis of GSC20 and MRC5 exosomes bound to Dynabeads. (C) Left dot plot FSC-A/SSC-A shows the singlet and bead/exosome complex [G1] and the aggregated bead/exosome complex [G2]. Right histograms were gated on G1. MRC5 and GSC20 exosomes were bound to CD63-coated Dynabeads and stained with isotype controls (dashed line) or CD63-FITC, CD9-Brilliant Violet 510 (solid line), and analyzed by flow cytometry. (D) The mean fluorescence intensity [MFI] of CD63 and CD9 expression in MRC5 and GSC20 exosomes.](/cms/asset/de90977a-fd40-4540-ab4c-a70abcd3d00c/koni_a_1412909_f0001_b.gif)
Figure 2. Intracellular uptake of exosomes by immune populations is variable. (A) Representative flow cytometry histograms demonstrating uptake of glioblastoma stem cell (GSC)20-derived exosomes labeled with PHK67 and incubated with peripheral blood mononuclear cells from GBM patients for 6 h. Cells were labeled with the indicated surface antibodies (solid line) or isotype controls (dashed line). Exosome uptake within the designated cellular population was characterized by flow cytometry. (B) Summarized data of uptake of labeled GSC20-derived exosomes by immune cell populations from GBM patients (left) and healthy donors (right). Each symbol represents the data from one patient or donor. The horizontal lines represent the average percentage for each of the 5 cell types. (C) T cells were activated with anti-CD3/anti-CD28 antibodies, and NK cells were activated by PMA and ionomycin, and then cells were incubated with PHK67-labeled GSC20 exosomes for 6 h. Then cells were labeled with the indicated surface antibodies (solid line) or isotype controls (dashed line). Exosome uptake within the CD4+ or CD8+ T-cell population and CD56+ NK cells was analyzed by flow cytometry. These data were replicated twice with two different donors with similar results.
GSC-derived exosomes are localized in the cytoplasm of monocytes and trigger their actin reorganization
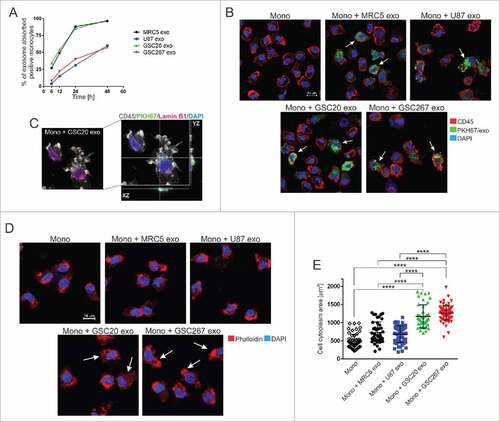
In order to determine the kinetics of exosome uptake by monocytes, monocytes were exposed to PKH67-labeled GSC- (GSC20, GSC276), fibroblast- (MRC5) and glioma- (U87) derived exosomes for 6, 12, 24, and 48 hours. Flow cytometry data showed the highest uptake of GSC20 and MRC5 exosomes at 48 hours after monocyte exposure (). At 48 hours, aproximately 60% of monocytes treated with U87- and GSC267-derived exosomes contained exosomes. Confocal microscope studies revealed that exosomes are mainly localized in the cytoplasm of monocytes (,). Using phase-contrast microscopy, we observed a higher percentage of adherent GSC-exposed monocytes relative to monocytes exposed to MRC5 or U87 exosomes (data replicated three times; not shown). Our in vitro experiments were performed on monocytes cultured without any stimulating growth factors, e.g., granulocyte macrophage colony-stimulating factor. Under these conditions, 50% of monocytes underwent apoptosis within 48 h (annexin V assay replicated 3 times, data not shown). Monocyte exposure to fibroblast-derived exosomes (FDEs) and GDEs was associated with a 60% and 80% reduction in apoptosis, respectively, indicating that exosomes can confer factors that are crucial for the viability of monocytes. Confocal microscope analysis focused on the cytoarchitecture, using phalloidin staining of the actin filaments in monocytes, revealed that monocytes exposed to GDEs demonstrated enlarged cytoplasms and possessed clear evidence of filopodia, while naïve monocytes and those treated with MRC5- and U87-derived exosomes showed lamellipodia structures (,), indicating significant differences in the cytoskeletal restructuring in reaction to various sources of exosomes. More specifically, the presence of filopodia in response to GDEs indicated the triggering of diapedesis.Citation24
Figure 3. Exosome internalization by human monocytes. (A) The kinetics of exosome uptake by monocytes. Monocytes were exposed to PKH67-labeled MRC5 (black line), U87 (blue line), GSC20 (green line), and GSC267 (red line) exosomes for 6, 12, 24, and 48 h. After cell membrane permeabilization, cells were acquired on flow cytometer. (B) Representative confocal microscope images of monocytes treated with PKH67-labeled exosomes (green). At 48 h post treatment with exosomes, monocytes were stained with anti-CD45 antibody, followed by a secondary Alexa Fluor-555 antibody (red) and counterstained with DAPI (blue). White arrows indicate cells with internalized exosomes. Scale bar = 10 µm. (C) Representative high-resolution confocal microscope image of monocytes exposed to PKH67-labeled GSC20 exosomes (green). At 48 h post treatment with exosomes, monocytes were stained with anti-CD45 (grey) and anti-Lamin B1 antibody (pink) followed by fluorescent secondary antibodies. DAPI nuclear staining is blue. Right image: confocal projection from z-stack images of GSC20 exosome-internalized monocytes. (D) Representative confocal microscope images of monocytes exposed for 48 h to exosomes, stained with Alexa Fluor 555 Phalloidin (red) and DAPI (blue). White arrows indicate cells with actin reorganization. Scale bar = 10 mm. (E) Cytoplasmic area of monocytes treated with exosomes is shown. Monocytes only (diamond), monocytes + MRC5 exosomes (black circle), monocytes + U87 exosomes (blue square), monocytes + GSC20 exosomes (green triangle), monocytes + GSC267 exosomes (red triangle). Three randomly chosen fields were captured using an Andor Revolution WD Spinning Disk confocal microscope and analyzed using the Bit Plane Imaris software. The data are presented as the mean ± SD. A linear regression model was used to calculate P values. ####P < 0.0001.
GSC-derived exosomes polarize monocytes into M2 macrophage phenotype
In order to ascertain the phenotype of monocytes after GDE internalization, flow cytometric analysis was performed to detect the expression of M1 (MHC II, CD80) and M2 (CD163, CD206) markers, and the immune checkpoint ligand PD-L1. The percentage of monocytes that expressed MHC II after GDE uptake was not significantly altered, but in some instances, there was a further increase in CD80 (). Notably, the M2 markers, CD163 and CD206, were only enhanced after being exposed to GDEs (). Furthermore, only the GDEs induced PD-L1 expression in the monocytes. Using a validated PD-L1 antibody (clone 28-8)Citation25 and the monocyte/macrophage cell marker Iba1, double immunofluorescence studies in resected GBM tissue revealed coexpression of the two markers (, Supplementary .mov file), indicating that this phenotype is present in vivo. Next, we profiled the monocytes after exposure to the exosomes using a 105 cytokines/chemokines multiplex antibody array and found monocyte-chemotactic protein 3 (MCP-3, CCL7) and chemokine (C-X-C motif) ligand 1 (CXCL1) to be augmented in the conditioned medium harvested from monocytes treated with GDEs (, Supplementary Figure S1). MCP-3 and CXCL1 are both immunological chemokines trophic for monocytes, macrophages, and myeloid derived suppressor cells (MDSC), with the latter also enhancing arteriogenesis.Citation26
Figure 4. GSC-derived exosomes polarize monocytes into an M2-like phenotype. (A) Expression of M1 and M2 markers (left) and mean fluorescence intensity [MFI] of PD-L1 (right) in monocytes treated with different exosomes are shown. The data were derived from three independent experiments and are presented as the mean ± SD. A linear mixed-effects model was used to calculate P values. #P < 0.05; ###P < 0.001; ####P < 0.0001. (B) Representative confocal fluorescence microscopy image of Iba1 (green) and PD-L1 (red) staining in GBM tissue from patients. DAPI (blue) was used for nuclear staining. Scale bar = 20 µm. (C) Relative pixel density of MCP-3 and CXCL1 production by monocytes treated with exosomes. Forty-eight hours after monocyte exposure to exosomes, conditioned medium was harvested, and the Proteome Profiler Human XL Cytokine Array Kit was used to determine the cytokine production. Fold increase in protein production was calculated beyond background using densitometry as measured using the Image Studio Lite software. The data are presented as the mean ± SD. A linear mixed-effects model was used to calculate P values. The dashed line represents untreated monocytes. #P < 0.05 is presented on the graph for both MCP-3 and CXCL1 (mono + GSC20 exo vs. mono; mono + GSC267 exo vs. mono). #P < 0.05 for MCP-3 (mono + GSC267 exo vs. mono + MRC5 exo). P = 0.0518 for MCP-3 (mono + GSC20 exo vs. mono + MRC5 exo).
![Figure 4. GSC-derived exosomes polarize monocytes into an M2-like phenotype. (A) Expression of M1 and M2 markers (left) and mean fluorescence intensity [MFI] of PD-L1 (right) in monocytes treated with different exosomes are shown. The data were derived from three independent experiments and are presented as the mean ± SD. A linear mixed-effects model was used to calculate P values. #P < 0.05; ###P < 0.001; ####P < 0.0001. (B) Representative confocal fluorescence microscopy image of Iba1 (green) and PD-L1 (red) staining in GBM tissue from patients. DAPI (blue) was used for nuclear staining. Scale bar = 20 µm. (C) Relative pixel density of MCP-3 and CXCL1 production by monocytes treated with exosomes. Forty-eight hours after monocyte exposure to exosomes, conditioned medium was harvested, and the Proteome Profiler Human XL Cytokine Array Kit was used to determine the cytokine production. Fold increase in protein production was calculated beyond background using densitometry as measured using the Image Studio Lite software. The data are presented as the mean ± SD. A linear mixed-effects model was used to calculate P values. The dashed line represents untreated monocytes. #P < 0.05 is presented on the graph for both MCP-3 and CXCL1 (mono + GSC20 exo vs. mono; mono + GSC267 exo vs. mono). #P < 0.05 for MCP-3 (mono + GSC267 exo vs. mono + MRC5 exo). P = 0.0518 for MCP-3 (mono + GSC20 exo vs. mono + MRC5 exo).](/cms/asset/1faa7aad-f2c1-4fd6-8626-0769f0ef1e4e/koni_a_1412909_f0004_oc.jpg)
GSC-derived exosome cargo contains EIF2, mTOR, and ephrinB signaling pathway proteins
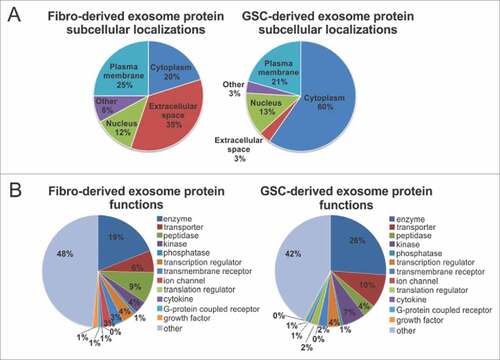
To characterize GDE and FDE content, we performed mass spectrometry analysis. Pathway annotation revealed an overrepresentation of proteins in GDEs relative to FDE related to EIF2 (e.g., EIF3B, EIF1AX, EIF2S1, RPS3A, RPS6, RPS10, RPS15, RPL6, RPL10, RPL22), eIF4/mTOR (p70S6K) (e.g., LAMTOR1, Akt1, PIK3CB), axonal guidance (e.g., ADAM17, AKT1, ROBO1, FYN, CXCR4, PLXNA1, EPHA3, PLCD1,TUBB2A, PRKAR1A, GNA13), ephrin receptor and ephrinB (e.g., EPHB3, EPHB4, EFNB2, STAT3, AKT1, CXCR4), G-beta gamma (e.g., CAV1, AKT1, GNA13, PRKAR1A), and IGF-1 signaling (JAK1, STAT3, AKT1, PIK3CB, IGF1R, IGFBP3) (, Supplementary Table 1). Cumulatively, these pathways reflect generalized transcriptional reprogramming for monocyte growth, proliferation, and motility by the GDE. Six hundred forty-nine proteins were identified to be significantly overrepresented in GDEs and 294 in FDEs (, Supplementary Table 2). Gene Ontology analysis showed an enrichment of proteins in GDEs, orginating mostly from the cytoplasm (60%) (), whereas the FDEs were enriched for proteins related to the extracellular space (35%). A higher percentage of proteins in GDEs were found to be enzymes and transporters when compared with the FDE cargo ().
Figure 5. Proteomic analysis of GSC- and fibroblast-derived exosomes. (A) Pathway annotation of the GSC-derived exosome (GSC20, 17, 267) proteins vs. fibroblast-derived exosome (MRC5, WI38) proteins (fold change > 4, P < 0.05). The –log (P value) for each pathway is listed. (B) A volcano plot of protein enrichment in samples from fibroblast- (MRC5, WI38) and GSC-derived exosomes (GSC20, 17, 267). Only the statistically significant results (P < 0.05) are shown.
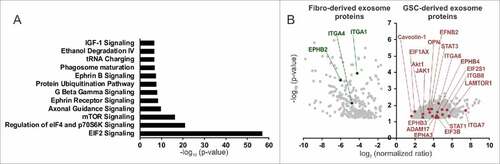
Figure 6. Subcellular localization and function of GSC- and fibroblast-derived exosomes. (A) and (B) Fibroblast-derived exosome proteins and GSC-derived exosome proteins are grouped based on (A) their localizations and (B) cellular functions as indicated by Gene Ontology (GO) analysis and a literature search.
GSC-derived exosomes induce upregulation of PD-L1 in human monocytes, which correlates with STAT3 phosphorylation
To confirm GDE and FDE protein content and their effects on monocyte phenotype, we performed western blot analysis of several of the preferentially overexpressed proteins in GDEs with known macrophage polarizing effectsCitation19,Citation27-29 such as p-STAT3, pAKT, or p-STAT1. The GDEs were enriched for polarizing proteins, whereas the FDEs were not (). Monocytes treated with GDEs had elevated PD-L1 expression, which corresponded with p-STAT3 levels () but not with p-STAT1 levels (data not shown). PD-L1 was upregulated in CD14+ monocyte/macrophages derived from GBM tissue freshly resected from patients but not in CD14+ cells from the blood of GBM patients and healthy donors (). Elevated levels of p-STAT3 could be detected in matched monocytes (CD14+ monocytes/macrophages) from both the blood and tumor tissue of GBM patients. In cases in which p-STAT3 expression was low, p-JNK, pp70S6K, and p-Erk1/2 were detected; among these, p-JNK is a negative regulator of STAT3 expression.Citation30 In all GBM-infiltrating CD14+ cells, p-Erk1/2 was highly upregulated, compared with controls.
Figure 7. PD-L1 pathway analysis in monocytes treated with exosomes and in CD14+ cells from blood and tumor tissue of GBM patients. (A) Western blot analysis of p-STAT3, p-STAT1, p-Akt, β-Actin, Hsp70 in fibroblasts, GSCs, fibroblast- and GSC-derived exosomes. (B) Western blot analysis of PD-L1, p-STAT3, STAT3, GAPDH in monocytes from two donors treated with fibroblast- and GSC-derived exosomes. (C) Densitometric analysis of PD-L1 and p-STAT3 protein expression in monocytes from two donors treated with exosomes. (D) Western blot analysis of PD-L1, p-STAT3, p-STAT1, p-Erk1/2, pJNK, pp70S6K, and GADPH in CD14+ cells from healthy donor blood (n = 3), in CD14+ cells in blood from GBM patients (n = 3), and in GBM-infiltrating CD14+ cells (n = 6).
Discussion
We report the first evidence that GDEs show distinct absorption by the selected immune cell subsets, specifically the CD14+ monocytes, which is not entirely surprising given their inherent phagocytic nature. The uptake of GDEs can be contextual in nature because immune activation can influence the propensity of various immune populations to take up GDEs. Cancer-derived exsosomes (CDEs) have been reported to both stimulate and suppress tumor-specific and nonspecific immune responses.Citation15,Citation31-34 However, the predominant evidence suggests an overall immune suppressive role. Exosome cargo can contain multiple immunosuppressive molecules affecting adaptive and innate immune cell function. For example, exosomes can be enriched in FasL, TRAIL, or galectin-9, which promote T-cell apoptosis,Citation35,Citation36 suppress CD3-ζ chain expression in T cells, and block NKG2D-dependent cytotoxicity of NK cells and CD8+ T cells.Citation37 Moreover, prostaglandin E2, TGF-β, Hsp72, and miRNAs contained in CDEs play important roles in driving monocyte differentiation toward MDSCs.Citation38,Citation39 Our data now reveal for the first time that these CDEs are capable of inducing the immune suppressive M2 macrophage phenotype from the CD14+ monocyte precursor. This exposure also triggers the intial steps of diapedesis, which is necessary for migration of these cells from the circulation into the tumor microenvironment. Similarly, Domenis and coworkers showed that human CD14+ monocytes isolated from healthy-donor whole blood and exposed to GDEs had increased interleukin 10 (IL-10), arginase-1 (Arg-1), and downregulated human leukocyte antigen-DR, thus inducing cells resembling monocytic MDSCs.Citation40 Our data demonstrate that GDEs, once internalized by monocytes, change the morphology and actin cytoskeleton of the monocyte. This is probably secondary to the enriched ephrin and axonal guidance signaling proteins contained within the GDEs, which are directly transferred to the cytoplasm of the monocytes. Thereafter, the monocytes become polarized to the M2 macrophage phenotype, upregulate PD-L1, and elaborate cytokines, such as MCP-3 and CXCL1, that further enhance immune infiltration, the induction of arterogenesis, and the recruitment of myeloid cells into the tumor site.Citation41,Citation42 Recently, Haderk and coworkers showed Toll-like receptor 7 (TLR7)-depended upregulation of PD-L1 level in monocytes treated with chronic lymphocytic leukemia (CLL)-derived exosomes followed by the production of C-C motif chemokine ligand 2 (CCL2), CCL4, and interleukin 6 (IL-6).Citation43 Interestingly, primary mouse microglia can also take up extracellular vesicles derived from human GBM, precipitating phenotypic changes, increasing their proliferation, and inducing the production of CXCL1 and Arg-1 expression.Citation44
Macrophages within the tumor microenvironment have been found to be polarized to a tumor supportive M2 phenotype, with hallmark expression of STAT3.Citation45 In addition, bone marrow-derived CD11b+ cells exposed to exosomes isolated from murine mammary tumor cells upregulate STAT3.Citation12 STAT3 can be activated in macrophages in response to IL-10.Citation46 In T-cell lymphoma, STAT3 can bind to the CD274 gene promoter required for PD-L1 gene expression.Citation47 PD-L1 has also been shown to be induced in macrophages by STAT3.Citation48 The question that arose was whether the activated STAT3 was induced in the monocyte or directly transferred to it. Our mass spectrometry and western blot analyses demonstrated that GSC-derived exosomes predominantly contain phosphorylated STAT3 and to a lesser extent, phosphorylated Akt. Although our data demonstrate that the GDEs directly transfer STAT3 into monocytes, thereby probably contributing to the induction of PD-L1, other mechanisms may also be involved, given the diversity of biomolecules carried by the exosomes into target cells. Alternatively, the expression of pSTAT3 could have been induced by the exosomes. A multiplicity of transferred factors are also likely mediating the M2 switch in addition to STAT3. The mTOR signaling pathway (including the p70S6K component) has been shown to be a determinant in the differentiation of monocytes into M2 macrophages,Citation49 and this pathway was found to be enriched within the GDEs. Furthermore, the GDEs were also found to contain osteopontin (OPN, Spp1), a glycoprotein/chemokine highly overexpressed in M2-polarized macrophages and GBM-infiltrating CD14+ cells.Citation16
Peripheral blood monocytes and tumor-infiltrating myeloid cells in GBM patients have been shown to have significantly elevated expression of PD-L1 relative to monocytes derived from healthy donors.Citation50 Further in vitro studies showed that glioma-released factor-induced IL-10 production by monocytes results in an increased level of PD-L1. Our protein expression analysis of CD14+ cells from blood and tumor tissue obtained from patients with GBM showed enrichment of PD-L1 expression in GBM-infiltrating CD14+ cells. Notably, PD-L1 expression can't be exclusively regulated by STAT3, because activated STAT3 is also expressed in CD14+ monocytes from the blood of GBM patients. The PD-L1 expression in GBM-infiltrating CD14+ cells can be regulated by p-STAT3 and/or supported by p44/42 MAPK (Erk1/2) and the mTOR signaling pathway. Thus, there may be differential mechanisms regulating PD-L1 expression in various anatomical locations—i.e., peripheral blood versus within the tumor microenvironement, which is a focus of future analysis. In conclusion, this study has demonstrated a novel mechanism of cancer stem cell-derived exosome modulation of M2 macrophage polarization and induction of immune suppressive PD-L1, partly mediated by STAT3.
Conflict of interest
All authors declare that they have no conflicting or competing financial interests.
Importance of the study
This study has demonstrated a novel mechanism of cancer stem cell-derived exosome modulation of M2 macrophage polarization and induction of immune suppressive PD-L1, partly mediated by STAT3.
Copy_of_Supplementary_Table_2.xlsx
Download MS Excel (2.3 MB)Copy_of_Supplementary_Table_1.xlsx
Download MS Excel (44.4 KB)2017ONCOIMM0842R-file002.doc
Download MS Word (33 KB)supp_data.zip
Download Zip (1.8 MB)Acknowledgments
We thank Audria Patrick and Dr. David M. Wildrick for editorial assistance and Dr. Michael A Curran for scientific review.
Additional information
Funding
References
- Simons M, Raposo G. Exosomes–vesicular carriers for intercellular communication. Curr Opin Cell Biol. 2009;21(4):575–581. doi:10.1016/j.ceb.2009.03.007
- Mulcahy LA, Pink RC, Carter DR. Routes and mechanisms of extracellular vesicle uptake. J Extracell Vesicles. 2014;3:1–14. doi:10.3402/jev.v3.24641.
- Tian T, Zhu YL, Hu FH, Wang YY, Huang NP, Xiao ZD. Dynamics of exosome internalization and trafficking. J Cell Physiol. 2013;228(7):1487–1495. doi:10.1002/jcp.24304
- Svensson KJ, Christianson HC, Wittrup A, Bourseau-Guilmain E, Lindqvist E, Svensson LM, Morgelin M, Belting M. Exosome uptake depends on ERK1/2-heat shock protein 27 signaling and lipid raft-mediated endocytosis negatively regulated by caveolin-1. J Biol Chem. 2013;288(24):17713–17724. doi:10.1074/jbc.M112.445403
- Manda SV, Kataria Y, Tatireddy BR, Ramakrishnan B, Ratnam BG, Lath R, Ranjan A, Ray A. Exosomes as a biomarker platform for detecting epidermal growth factor receptor-positive high-grade gliomas. J Neurosurg. 2017:1–11. doi:10.3171/2016.11.JNS161187
- Al-Nedawi K, Meehan B, Kerbel RS, Allison AC, Rak J. Endothelial expression of autocrine VEGF upon the uptake of tumor-derived microvesicles containing oncogenic EGFR. Proc Natl Acad Sci U S A. 2009;106(10):3794–3799. doi:10.1073/pnas.0804543106
- Skog J, Wurdinger T, van Rijn S, Meijer DH, Gainche L, Sena-Esteves M, Curry WT, Jr., Carter BS, Krichevsky AM, Breakefield XO. Glioblastoma microvesicles transport RNA and proteins that promote tumour growth and provide diagnostic biomarkers. Nat Cell Biol. 2008;10(12):1470–1476. doi:10.1038/ncb1800
- Svensson KJ, Kucharzewska P, Christianson HC, Skold S, Lofstedt T, Johansson MC, Morgelin M, Bengzon J, Ruf W, Belting M. Hypoxia triggers a proangiogenic pathway involving cancer cell microvesicles and PAR-2-mediated heparin-binding EGF signaling in endothelial cells. Proc Natl Acad Sci U S A. 2011;108(32):13147–13152. doi:10.1073/pnas.1104261108
- Graner MW, Alzate O, Dechkovskaia AM, Keene JD, Sampson JH, Mitchell DA, Bigner DD. Proteomic and immunologic analyses of brain tumor exosomes. FASEB J. 2009;23(5):1541–1557. doi:10.1096/fj.08-122184
- Bu N, Wu H, Sun B, Zhang G, Zhan S, Zhang R, Zhou L. Exosome-loaded dendritic cells elicit tumor-specific CD8+ cytotoxic T cells in patients with glioma. J Neurooncol. 2011;104(3):659–667. doi:10.1007/s11060-011-0537-1
- Zhang HG, Kim H, Liu C, Yu S, Wang J, Grizzle WE, Kimberly RP, Barnes S. Curcumin reverses breast tumor exosomes mediated immune suppression of NK cell tumor cytotoxicity. Biochim Biophys Acta. 2007;1773(7):1116–1123. doi:10.1016/j.bbamcr.2007.04.015
- Yu S, Liu C, Su K, Wang J, Liu Y, Zhang L, Li C, Cong Y, Kimberly R, Grizzle WE, et al. Tumor exosomes inhibit differentiation of bone marrow dendritic cells. J Immunol. 2007;178(11):6867–6875. doi:10.4049/jimmunol.178.11.6867
- Abusamra AJ, Zhong Z, Zheng X, Li M, Ichim TE, Chin JL, Min WP. Tumor exosomes expressing Fas ligand mediate CD8+ T-cell apoptosis. Blood Cells Mol Dis. 2005;35(2):169–173. doi:10.1016/j.bcmd.2005.07.001
- Clayton A, Mitchell JP, Court J, Mason MD, Tabi Z. Human tumor-derived exosomes selectively impair lymphocyte responses to interleukin-2. Cancer Res. 2007;67(15):7458–7466. doi:10.1158/0008-5472.CAN-06-3456
- Szajnik M, Czystowska M, Szczepanski MJ, Mandapathil M, Whiteside TL. Tumor-derived microvesicles induce, expand and up-regulate biological activities of human regulatory T cells (Treg). PLoS One. 2010;5(7):e11469. doi:10.1371/journal.pone.0011469
- Gabrusiewicz K, Rodriguez B, Wei J, Hashimoto Y, Healy LM, Maiti SN, Thomas G, Zhou S, Wang Q, Elakkad A, et al. Glioblastoma-infiltrated innate immune cells resemble M0 macrophage phenotype. JCI insight. 2016;1(2):1–19. doi:10.1172/jci.insight.85841.
- Wynn TA, Chawla A, Pollard JW. Macrophage biology in development, homeostasis and disease. Nature. 2013;496(7446):445–455. doi:10.1038/nature12034
- Sica A, Mantovani A. Macrophage plasticity and polarization: in vivo veritas. J Clin Invest. 2012;122(3):787–795. doi:10.1172/JCI59643
- Wu A, Wei J, Kong LY, Wang Y, Priebe W, Qiao W, Sawaya R, Heimberger AB. Glioma cancer stem cells induce immunosuppressive macrophages/microglia. Neuro Oncol. 2010;12(11):1113–1125. doi:10.1093/neuonc/noq082
- Yu H, Kortylewski M, Pardoll D. Crosstalk between cancer and immune cells: role of STAT3 in the tumour microenvironment. Nat Rev Immunol. 2007;7(1):41–51. doi:10.1038/nri1995
- Wei J, Barr J, Kong LY, Wang Y, Wu A, Sharma AK, Gumin J, Henry V, Colman H, Priebe W, et al. Glioblastoma cancer-initiating cells inhibit T-cell proliferation and effector responses by the signal transducers and activators of transcription 3 pathway. Mol Cancer Ther. 2010;9(1):67–78. doi:10.1158/1535-7163.MCT-09-0734
- Thery C, Amigorena S, Raposo G, Clayton A. Isolation and characterization of exosomes from cell culture supernatants and biological fluids. Curr Protoc Cell Biol. 2006;Chapter 3:Unit 3 22.
- Logozzi M, De Milito A, Lugini L, Borghi M, Calabro L, Spada M, Perdicchio M, Marino ML, Federici C, Iessi E, et al. High levels of exosomes expressing CD63 and caveolin-1 in plasma of melanoma patients. PLoS One. 2009;4(4):e5219. doi:10.1371/journal.pone.0005219
- Schenkel AR, Mamdouh Z, Muller WA. Locomotion of monocytes on endothelium is a critical step during extravasation. Nat Immunol. 2004;5(4):393–400. doi:10.1038/ni1051
- Cogswell J, Inzunza HD, Wu Q, Feder JN, Mintier G, Novotny J, Cardona DM. An Analytical Comparison of Dako 28-8 PharmDx Assay and an E1L3N Laboratory-Developed Test in the Immunohistochemical Detection of Programmed Death-Ligand 1. Mol Diagn Ther. 2017;21(1):85–93. doi:10.1007/s40291-016-0237-9
- Vries MH, Wagenaar A, Verbruggen SE, Molin DG, Dijkgraaf I, Hackeng TH, Post MJ. CXCL1 promotes arteriogenesis through enhanced monocyte recruitment into the peri-collateral space. Angiogenesis. 2015;18(2):163–171. doi:10.1007/s10456-014-9454-1
- Fang L, Hodge J, Saaoud F, Wang J, Iwanowycz S, Wang Y, Hui Y, Evans TD, Razani B, Fan D. Transcriptional factor EB regulates macrophage polarization in the tumor microenvironment. Oncoimmunology. 2017;6(5):e1312042. doi:10.1080/2162402X.2017.1312042
- Rocher C, Singla DK. SMAD-PI3K-Akt-mTOR pathway mediates BMP-7 polarization of monocytes into M2 macrophages. PLoS One. 2013;8(12):e84009. doi:10.1371/journal.pone.0084009
- Zhou J, Qu Z, Sun F, Han L, Li L, Yan S, Stabile LP, Chen LF, Siegfried JM, Xiao G. Myeloid STAT3 Promotes Lung Tumorigenesis by Transforming Tumor Immunosurveillance into Tumor-Promoting Inflammation. Cancer Immunol Res. 2017;5(3):257–268. doi:10.1158/2326-6066.CIR-16-0073
- Gkouveris I, Nikitakis N, Karanikou M, Rassidakis G, Sklavounou A. JNK1/2 expression and modulation of STAT3 signaling in oral cancer. Oncology letters. 2016;12(1):699–706.
- Andre F, Schartz NE, Movassagh M, Flament C, Pautier P, Morice P, Pomel C, Lhomme C, Escudier B, Le Chevalier T, et al. Malignant effusions and immunogenic tumour-derived exosomes. Lancet. 2002;360(9329):295–305. doi:10.1016/S0140-6736(02)09552-1
- Hellwinkel JE, Redzic JS, Harland TA, Gunaydin D, Anchordoquy TJ, Graner MW. Glioma-derived extracellular vesicles selectively suppress immune responses. Neuro Oncol. 2016;18(4):497–506. doi:10.1093/neuonc/nov170
- Wolfers J, Lozier A, Raposo G, Regnault A, Thery C, Masurier C, Flament C, Pouzieux S, Faure F, Tursz T, et al. Tumor-derived exosomes are a source of shared tumor rejection antigens for CTL cross-priming. Nat Med. 2001;7(3):297–303. doi:10.1038/85438
- Xiang X, Poliakov A, Liu C, Liu Y, Deng ZB, Wang J, Cheng Z, Shah SV, Wang GJ, Zhang L, et al. Induction of myeloid-derived suppressor cells by tumor exosomes. Int J Cancer. 2009;124(11):2621–2633. doi:10.1002/ijc.24249
- Andreola G, Rivoltini L, Castelli C, Huber V, Perego P, Deho P, Squarcina P, Accornero P, Lozupone F, Lugini L, et al. Induction of lymphocyte apoptosis by tumor cell secretion of FasL-bearing microvesicles. J Exp Med. 2002;195(10):1303–1316. doi:10.1084/jem.20011624
- Klibi J, Niki T, Riedel A, Pioche-Durieu C, Souquere S, Rubinstein E, Le Moulec S, Guigay J, Hirashima M, Guemira F, et al. Blood diffusion and Th1-suppressive effects of galectin-9-containing exosomes released by Epstein-Barr virus-infected nasopharyngeal carcinoma cells. Blood. 2009;113(9):1957–1966. doi:10.1182/blood-2008-02-142596
- Taylor DD, Gercel-Taylor C, Lyons KS, Stanson J, Whiteside TL. T-cell apoptosis and suppression of T-cell receptor/CD3-zeta by Fas ligand-containing membrane vesicles shed from ovarian tumors. Clin Cancer Res. 2003;9(14):5113–5119.
- Chalmin F, Ladoire S, Mignot G, Vincent J, Bruchard M, Remy-Martin JP, Boireau W, Rouleau A, Simon B, Lanneau D, et al. Membrane-associated Hsp72 from tumor-derived exosomes mediates STAT3-dependent immunosuppressive function of mouse and human myeloid-derived suppressor cells. J Clin Invest. 2010;120(2):457–471.
- Xiang X, Liu Y, Zhuang X, Zhang S, Michalek S, Taylor DD, Grizzle W, Zhang HG. TLR2-mediated expansion of MDSCs is dependent on the source of tumor exosomes. Am J Pathol. 2010;177(4):1606–1610. doi:10.2353/ajpath.2010.100245
- Domenis R, Cesselli D, Toffoletto B, Bourkoula E, Caponnetto F, Manini I, Beltrami AP, Ius T, Skrap M, Di Loreto C, et al. Systemic T Cells Immunosuppression of Glioma Stem Cell-Derived Exosomes Is Mediated by Monocytic Myeloid-Derived Suppressor Cells. PLoS One. 2017;12(1):e0169932. doi:10.1371/journal.pone.0169932
- Okada M, Saio M, Kito Y, Ohe N, Yano H, Yoshimura S, Iwama T, Takami T. Tumor-associated macrophage/microglia infiltration in human gliomas is correlated with MCP-3, but not MCP-1. Int J Oncol. 2009;34(6):1621–1627.
- Wang D, Sun H, Wei J, Cen B, DuBois RN. CXCL1 is critical for pre-metastatic niche formation and metastasis in colorectal cancer. Cancer Res. 2017;77(13):3655–3665. doi:10.1158/0008-5472.CAN-16-3199.
- Haderk F, Schulz R, Iskar M, Cid LL, Worst T, Willmund KV, Schulz A, Warnken U, Seiler J, Benner A, et al. Tumor-derived exosomes modulate PD-L1 expression in monocytes. Sci Immunol. 2017;2(13). doi:10.1126/sciimmunol.aah5509
- van der Vos KE, Abels ER, Zhang X, Lai C, Carrizosa E, Oakley D, Prabhakar S, Mardini O, Crommentuijn MH, Skog J, et al. Directly visualized glioblastoma-derived extracellular vesicles transfer RNA to microglia/macrophages in the brain. Neuro Oncol. 2016;18(1):58–69. doi:10.1093/neuonc/nov244
- Yu H, Pardoll D, Jove R. STATs in cancer inflammation and immunity: a leading role for STAT3. Nat Rev Cancer. 2009;9(11):798–809. doi:10.1038/nrc2734
- Niemand C, Nimmesgern A, Haan S, Fischer P, Schaper F, Rossaint R, Heinrich PC, Muller-Newen G. Activation of STAT3 by IL-6 and IL-10 in primary human macrophages is differentially modulated by suppressor of cytokine signaling 3. J Immunol. 2003;170(6):3263–3272. doi:10.4049/jimmunol.170.6.3263
- Marzec M, Zhang Q, Goradia A, Raghunath PN, Liu X, Paessler M, Wang HY, Wysocka M, Cheng M, Ruggeri BA, et al. Oncogenic kinase NPM/ALK induces through STAT3 expression of immunosuppressive protein CD274 (PD-L1, B7-H1). Proc Natl Acad Sci U S A. 2008;105(52):20852–20857. doi:10.1073/pnas.0810958105
- Horlad H, Ma C, Yano H, Pan C, Ohnishi K, Fujiwara Y, Endo S, Kikukawa Y, Okuno Y, Matsuoka M, et al. An IL-27/Stat3 axis induces expression of programmed cell death 1 ligands (PD-L1/2) on infiltrating macrophages in lymphoma. Cancer Sci. 2016;107(11):1696–1704. doi:10.1111/cas.13065
- Chen W, Ma T, Shen XN, Xia XF, Xu GD, Bai XL, Liang TB. Macrophage-induced tumor angiogenesis is regulated by the TSC2-mTOR pathway. Cancer Res. 2012;72(6):1363–1372. doi:10.1158/0008-5472.CAN-11-2684
- Bloch O, Crane CA, Kaur R, Safaee M, Rutkowski MJ, Parsa AT. Gliomas promote immunosuppression through induction of B7-H1 expression in tumor-associated macrophages. Clin Cancer Res. 2013;19(12):3165–3175. doi:10.1158/1078-0432.CCR-12-3314