ABSTRACT
IRX-2 is an injectable cancer immunotherapy composed of cytokines purified from stimulated normal-donor peripheral blood mononuclear cells. In a phase 2a trial (n = 27), neoadjuvant IRX-2 significantly increased lymphocyte infiltration (LI) into resected head and neck tumors and was associated with changes in fibrosis and necrosis. Event-free survival was 65% at 2 years, and overall survival 65% at 5 years. Overall survival was longer for patients with LI greater versus lower than the median. This substudy of the mechanisms responsible for the increase in LI with neoadjuvant IRX-2 employed multiplex immunohistochemistry (IHC) and transcriptome analysis to interrogate matched pre- and post-treatment tumor specimens from 7 available phase 2a trial patients. Multiplex IHC showed substantial increases in CD68-expressing cells (5 patients), T-cell density (4 patients), and PDL1 mean fluorescent intensity (4 patients). Consistent with IRX-2 activation of multiple immune cells, transcriptome analysis showed mean increases in expression of genes associated with NK cells, B cells, CD4+ T cells, CD8+ T cells, and dendritic cells, but not of genes associated with neutrophils. There were increases in mean expression of genes for most immune subsets, most markedly (2- to 3-fold) for B cells and dendritic cells. Mean increases in gene expression for chemokines suggest that tumor LI may be driven in part by IRX-2-induced production of chemo-attractants. Upregulation of checkpoint genes including PDL1 and CTLA4 along with increased T-cell infiltration suggests a functional antitumor immune response such that the efficacy of IRX-2 may be enhanced by combination with immune checkpoint inhibitors.
Introduction
An essential role of the immune system is protecting the body against the proliferation of malignant cells. Immune modulation is increasingly seen as pivotal to the treatment of many cancers. Regulatory approval has been achieved for several new cancer immunotherapies, and many others are in the developmental pipeline.Citation1 In particular, the degree of immune infiltration and the ratio of effector T cells to regulatory T cells have been shown to be robust prognostic factors, regardless of therapy, in multivariate analyses in many different types of cancers.Citation2,Citation3 Cancers with high levels of immune infiltrate generally progress more slowly. Methodologies are now being validated for reproducible quantitation of immune infiltration.Citation4,Citation5
Several immunosuppression pathways are known to prevent T cells from effectively infiltrating malignancies and/or to suppress the function of infiltrating lymphocytes.Citation6 These pathways include (1) generation of dysfunctional antigen-presenting cells; (2) polarization of the immune system toward a Th2 response, a less effective pathway for immune rejection of cancer; (3) induction of immune regulatory cells such as regulatory T cells and myeloid-derived suppressor cells; (4) induction or secretion of immunosuppressive cytokines such as IL10 and transforming growth factor (TGF); and (5) induction of T-cell anergy or T-cell exhaustion. This spectrum of immunosuppressive pathways that may delay or prevent the host response to tumor cells, allowing tumor progression and ultimately killing the patient, represents a highly complex diagnostic and therapeutic challenge to the safe, effective, and appropriate implementation of targeted immunomodulatory cancer therapies. An added difficulty is that these immunosuppressive pathways may be induced by functional antitumor immune responses.
Agents that can enhance the antitumor immune response by modulating both positive and negative regulatory pathways are becoming increasingly important in oncology.Citation7-9 Checkpoint inhibitors that “remove the brakes” from effector T cell subsets can mediate significant clinical activity in a number of different cancers. Certain combination immunotherapies that incorporate multiple immune checkpoint inhibitors, or T-cell agonists, are showing even greater activity in clinical trials.Citation10,Citation11
IRX-2 is a pleiotropic immunomodulatory biologic composed of cytokines purified from peripheral blood mononuclear cells that have been stimulated with the mitogen phytohemagglutinin (PHA). IRX-2 has been shown in various in vitro models to increase the activation and enhance the function of antigen-presenting cells,Citation12,Citation13 while protecting T cells from activation-induced cell death, reducing the level of expression of the CTLA4 receptor,Citation14,Citation15 and preferentially stimulating effector T cells over regulatory T cells.Citation16 IRX-2 also increases the activation and promotes the cytolytic functions of natural killer (NK) cells, and when the regimen is combined with tumor-specific vaccines in preclinical animal models, antigen-specific T-cell response is increased.Citation17-19
In the clinic, IRX-2 is administered together with low-dose cyclophosphamide, indomethacin, and zinc in a multi-agent regimen to further restore and increase immune activation. In a completed phase 2a trial in patients with previously untreated head and neck squamous cell cancer (HNSCC), subcutaneous neoadjuvant administration of the IRX-2 biologic into the area of regional draining lymph nodes for 10 consecutive days prior to surgical cancer resection was found to be safe and was shown to induce increased lymphocytic infiltration into the tumors.Citation20 The increased lymphocytic infiltration was associated with improved clinical outcome — event-free survival of 65% at 2 years,Citation20 and overall survival of 65% at 5 years, better than rates for historical matched controls.Citation21
The several different methods that are currently available for characterizing the tumor microenvironment (TME) in vivo have different strengths and weaknesses but can be applied in combination to generate meaningful insight into how complex immune pathways may control antitumor immunity and how they may be effectively modulated by novel immunotherapies. To explore mechanisms potentially responsible for the increase in lymphocytic infiltration associated with the neoadjuvant IRX-2 regimen, we conducted a substudy using two powerful and complementary technologies — multiplex immunohistochemistry (IHC) and transcriptome analysis (NanoString Technologies, Seattle, WA, USA) — to interrogate matched pre- and post-treatment tumor specimens from 7 of the 27 phase 2a trial patients.
Results
Multiplex IHC analysis of matched pre- and post-resection tumor specimens
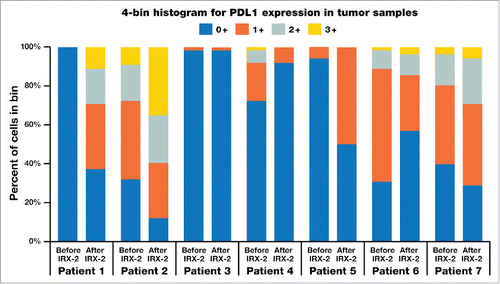
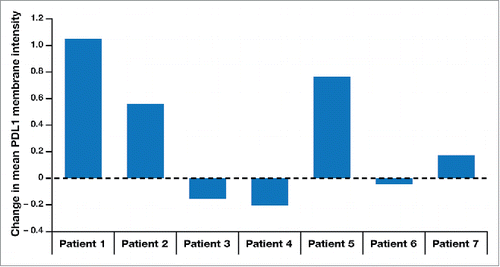
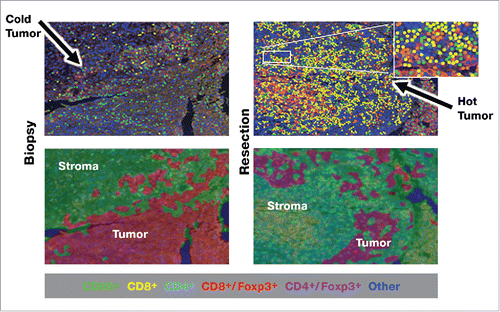
In the previously reported phase 2a trial (NCT00210470), we found that a 10-day neoadjuvant regimen of the IRX-2 biologic, injected locally into the tissues of the regional draining lymph nodes, together with a single systemic low dose of cyclophosphamide and 21 days of indomethacin and zinc, significantly increased lymphocytic infiltration into resected head and neck tumors, as assessed by three pathologists blinded to the identity of the stained samples and recorded on a 100-mm visual analogue scale (VAS).Citation21 Patients with VAS scores greater than the median for lymphocytic infiltration had improved overall survival compared to those below the median. Matched pre- and post-resection tumor specimens were obtained from 7 of the 27 patients treated in the phase 2a trial. For the remaining patients, insufficient and/or poor-quality material from one of the matched samples limited analysis of additional matched sample sets. Non-stained slides were sent to Perkin Elmer (PE, Shelton, CT, USA) for multiplex IHC analysis using antibodies against CD4, CD8, CD68, Foxp3, programmed death ligand 1 (PDL1), and cytokeratin. shows pre- and post-treatment quantities of cells staining for CD4, CD8, CD3, and CD68 proteins, for each of the 7 patients, as well as PDL1 mean fluorescent intensity (MFI). The CD3 values were computed by combining the CD4 and CD8 values. shows a representative multiplex IHC for a patient stained for all of these molecules. Five of the 7 patients had substantial increases in CD68-expressing cells, 4 had substantial increases in PDL1 MFI, and 4 had substantial increases in the overall density of T cells. Each of the patients with increases by multiplex IHC also had increases in the respective cell numbers according to the VAS scoring of the histological method (by means of single antigen or hematoxylin and eosin [H&E] staining) used in the phase 2a trial. shows the changes from pre- to post-treatment in level of intensity of PDL1 expression (a component of H-score) for each of the 7 patients. shows the overall changes from pre- to post-treatment in PDL1 MFI for each of the patients, with 4 of 7 patients showing increases in expression.
Table 1. Changes in multiplex IHC measuring cell density for immune subsets in tumor specimens before and after treatment with IRX-2 and resection.
Figure 1. Multiplex IHC showing relationships of immune infiltrating cells to each other and increases after treatment with IRX-2.
Transcriptome analysis of gene expression in matched pre- and post-resection tumor specimens
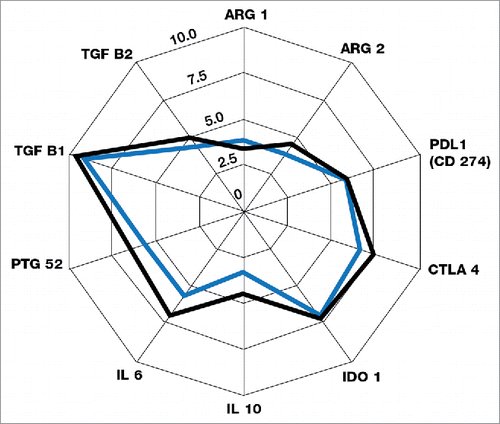
A total of 770 genes were analyzed in each sample for levels of expression using the PanCancer Immune Profiling panel (NanoString). The key gene members of the different immune and immunosuppressive subset panels are shown in .Citation22 The mean differences in gene expression from pre-treatment to post-treatment tumor specimens are depicted in the spider graphs in , , and , with the successive contour lines in the graphs representing 2 log differences. The transcriptome analysis showed mean increases in expression of genes associated with NK cells, B cells, CD4+ T cells, CD8+ T cells, and dendritic cells (most markedly, 2- to 3-fold increases for B cells and dendritic cells), but not of genes associated with neutrophils (). Changes in gene expression were also assessed at a group level for functional pathways such as chemokines (CCLs, CCRs, and CXCRs), other intercellular signaling chemokines, interferon ligands, interferon receptors, and Th1 polarization genes. Mean increases in expression for chemokine pathway genes suggest that tumor lymphocytic infiltration may be driven in part by IRX-2-induced production of chemo-attractants (). Small mean increases were seen in the expression of immunosuppressive genes including IL6, IL10, and the checkpoint inhibitor receptor CTLA4 (). Although the mean increase in CTLA4 expression was small, 5 patients had documented increases (data not shown).
Table 2. Key gene members in the different immune and immunosuppressive subset panels in the transcriptome analysis.
Figure 4. Means of gene expression of immune subsets before and after treatment with IRX-2 according to the transcriptome analysis for the 7 substudy patients. The blue outline represents pre-treatment values, and the black outline represents post-treatment values. The successive graph contour lines represent 2 log differences.
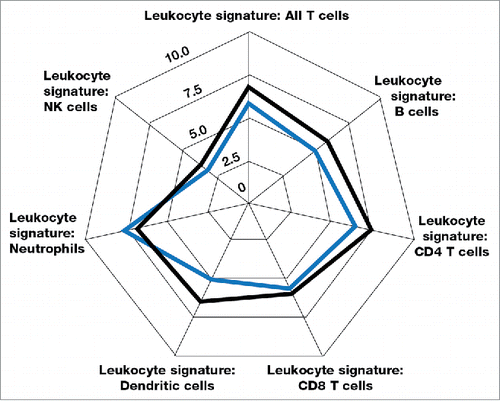
Figure 5. Means of gene expression of functional immune pathways before and after treatment with IRX-2 according to the transcriptome analysis for the 7 substudy patients. The blue outline represents pre-treatment values, and the black outline represents post-treatment values. The successive graph contour lines represent 2 log differences.
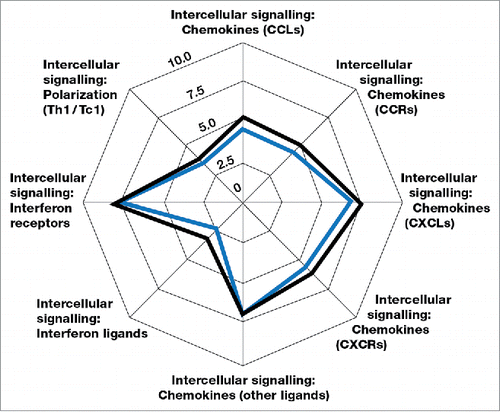
Figure 6. Means of expression of key genes in immunosuppressive pathways before and after treatment with IRX-2 according to the transcriptome analysis for the 7 substudy patients. The blue outline represents pre-treatment values, and the black outline represents post-treatment values. The successive graph contour lines represent 2 log differences.
Multiplex IHC and transcriptome analysis of individual patients
While increases in mean gene expression were seen overall for the substudy cohort of 7 patients, individual patients exhibited varying levels of response, with levels of immune activation greater than the mean in some cases but without any level of activation in others. The multiplex IHC and transcriptome analyses for the 7 patients are individually represented in supplemental Figures 1 through 7. The bar graphs in supplemental Figures 1 through 7 show the levels of immune activation for CD3 and CD68 assayed by chromogenic IHC staining (according to the VAS scoring of the histological method used in the phase 2a trial), fluorescent multiplex IHC, and transcriptome gene expression profiling. The spider graphs in supplemental Figures 1 through 7 display the immune subset gene expression profile for the matched pre- and post-resection tumor specimens from each patient. The multiplex IHC images display the changes in the number and distribution of immune cell types in tumor tissue before and after treatment with IRX-2. For the most part, the individual patient data demonstrate consistency between the findings with multiplex IHC and transcriptome analysis. The data show a heterogeneity in terms of the magnitude of response, with clear post-treatment increases in CD3+ T cells and CD68+ macrophages for 6 of 7 patients.
Transcriptome and IHC data suggest that there was no increase in infiltration of the regulatory T-cell subset into the tumors. Two of the 7 patients showed decreases in Foxp3 gene expression by transcriptome analysis. The decrease in average Foxp3 gene expression from 7.17 in pre-treatment biopsies to 7.03 in resected tumor samples (log 2 scale) was not significant (data not shown). Four of the 7 patients showed decreases in CD4+Foxp3+ cells by multiplex IHC (data not shown).
Correlations between multiplex IHC and transcriptome analysis
In order to assess correlations among the VAS scoring of the histological method employed in the primary phase 2a trial and the two immunoprofiling technologies employed in this substudy to quantitate immune activation, we performed linear regression analyses using all the available samples evaluated in this analysis (n = 17, as there were 3 unmatched samples in addition to the 7 matched pre- and post-treatment pairs). For CD68 expression, a strong correlation was observed between the transcriptome analysis and multiplex IHC (r2 = 0.609, , ). A comparison of the expression of the CD3D and CD3G genes, respectively, with CD3 histology density by multiplex IHC revealed correlation coefficients (r2 values) of 0.049 and 0.324 (). Correlation coefficients were 0.116 for CD4 RNA expression versus CD4 histology density by multiplex IHC; 0.432 for PDL1 (CD274) RNA expression versus PDL1 MFI; and 0.489 for PDL1 (CD274) RNA expression versus PDL1 H-score. We also demonstrated correlations between both the transcriptome and multiplex IHC technologies and the VAS scoring of the histological method used in the phase 2a trial; the correlation coefficient for CD3G RNA expression versus the mean VAS score for CD3 expression was 0.348 ().
Figure 7. The correlation between CD68 RNA expression and CD68 histology density in the 7 substudy patients.
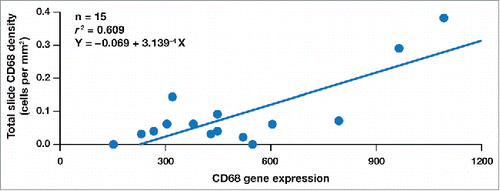
Table 3. Correlation coefficients for technology comparisons.
Discussion
We have previously reported that a short neoadjuvant course of the IRX-2 immunotherapy regimen was associated with an enhanced infiltration of leukocytes into the tumors of patients with HNSCC who were candidates for potentially curative resection.Citation20 The data from that phase 2a trial suggested that the lymphocyte infiltration was associated with radiologic reductions in tumor size and with improvement in overall survival.Citation21 Those results have been extended in the current substudy, with employment of two additional immunoprofiling technologies — sequential fluorescent multiplex IHC and transcriptome analysis. The current findings suggest that not only does neoadjuvant IRX-2 treatment increase the infiltration of T cells, B cells, and DCs into the tumor, but that these cells are functionally active and stimulate an attempt by the immune system to suppress this response with upregulation of checkpoint molecules such as CTLA4 and PDL1. Further, there was no significant expansion of regulatory T cells with IRX-2 treatment, a finding consistent with in vitro experiments in which effector T cells were expanded preferentially versus regulatory T cells.Citation16
Many challenges are involved in achieving accurate assessment of changes in the TME after immunomodulatory treatment. Representative biopsies must be acquired prior to treatment for comparison with post-treatment biopsies or surgical resections. Further attention is required regarding the correlations among the specific technologies used to monitor immune changes. In the current substudy, we have shown an excellent correlation between the earlier histological method used to evaluate lymphocyte infiltration by single antigen or H&E staining and the newer technologies of multiplex IHC and transcriptome analysis of lymphocyte-specific genes. For example, CD3 expression measured by multiplex IHC analysis positively correlated with the RNA expression of both the CD3D and CD3G genes when analyzed using transcriptome technology. These correlations were even stronger when assessing the changes in CD68+ antigen presenting cells after treatment ().
Our employment of these two newer technologies provided complementary information regarding the extent of post-treatment lymphocytic infiltration in the TME and the functional nature of the infiltrate. The transcriptome technology allowed for the analysis of 770 immune- and cancer- related genes and provided a read-out for the entire immune response. One of the most striking aspects of the IRX-2 treatment as compared to other investigational immune-oncology agents is that IRX-2 activates multiple immune cells to generate a coordinated response.Citation13-17,Citation23 As shown in , IRX-2 treatment upregulated genes expressed by T cells and B cells as well as dendritic cells. As immunosuppression in cancer can take many forms, an agent that broadly restores and activates the function of multiple immune cells should have a broader function than therapies that address single defects such as PDL1 expression. Previous clinical studies with IRX-2 have shown that treatment-induced immune infiltration correlates strongly with positive clinical outcome.Citation23
In addition to the direct effects of driving lymphocyte and dendritic cell infiltration into the tumor, IRX-2 treatment also functionally alters the activation state of the immune infiltrate. As shown in , IRX-2 treatment promotes expression of CCL, CCR, and CXCL chemokines. The increase in lymphocyte infiltration with IRX-2 may in good part be explained by the expression of these chemoattractants. Leading candidate chemokines for the IRX-2–driven recruitment of lymphocytes and DCs to the tumor include CXCL12, CCL2, CCL14, CCL19, and CCL21 (supplemental Fig. 8). CCL19 and CCL21 have been clearly shown to mediate migration of T cells and DCs.Citation24,Citation25
Our detailed analysis of the immune activation in each tumor (presented in supplemental Figures 1 through 7) shows that not all patients have the same level of response to IRX-2. That outcome is not unexpected given that the TME is complex and varies from tumor to tumor and patient to patient. That said, however, this small analysis did reveal functional immune activation in the majority of patients — a finding that qualifies IRX-2 as a useful and important clinical treatment option.
The clinical success of checkpoint inhibitors — as evidenced by the US Food and Drug Administration approval of ipilimumab, pembrolizumab, nivolumab, and atezolizumab for the treatment of melanoma and other cancers — has prompted attempts to extend this indication more broadly in oncology. Early findings, however, suggest that many tumors and patients are resistant to monotherapy with checkpoint blockade. As the limitations of checkpoint inhibitors are exposed, there is a strong interest in finding agents that can modify the TME and thus increase the response rate to checkpoint inhibitor therapy. Sustained expression of the inhibitory receptor programmed cell death 1 (PD-1) characterizes exhausted T cells, and therapies that block the PD-1 pathway have shown clinical activity in a wide variety of cancer types, particularly those characterized by an “inflamed” microenvironment with lymphocytic infiltration and expression of PDL1.Citation26-30 We have shown that IRX-2 promotes changes in the TME — including upregulation of PDL1 expression in the majority of patients tested. It is likely that the observed increases in the expression of PDL1 and other checkpoint molecules are compensatory, a consequence of an attempt on the part of the tumor to modulate the IRX-2-mediated immune response directed at that tumor. Interferons secreted by activated T cells upon tumor antigen recognition trigger tumor cells to upregulate PDL1 expression.Citation31 Thus the increased expression of interferon pathway members seen in the transcriptome analysis () may well be responsible for increases in PDL1 expression following IRX-2 treatment. In an in vitro model simulating the human TME, direct incubation of T cells with IRX-2 promoted the expansion of effector T cells without inducing the expansion of CTLA4-expressing regulatory T cells.Citation16
Compensatory upregulation of PDL1 may be effectively countered by complementary follow-on combination therapy with checkpoint inhibitors. Increased lymphocyte infiltration into the tumor such as that promoted by IRX-2 has been shown to be an important predictor of checkpoint inhibitor responsiveness. Another important aspect of IRX-2 treatment is the lack of toxicity associated with the treatments.Citation32 Thus the combination of IRX-2 treatment with checkpoint inhibitors should not add to overall toxicity in the way that has been a drawback with other combination therapies, as evidenced by the high rate of serious adverse events seen with anti-PD-1 and anti-CTLA4 combinations, for example.Citation33
Neoadjuvant IRX-2 immunotherapy is being studied further in an international multicenter randomized controlled trial in 100 patients with resectable HNSCC (NCT02609386) — with clinical endpoints including event-free survival as well as co-exploratory analyses utilizing multiplex IHC, transcriptome analysis, and T cell receptor immunosequencing. The goal of these exploratory studies is to better understand the IRX-2 mechanism of action, quantify the changes in the TME, and define a pretreatment prognostic phenotype that predicts for responsiveness to the IRX-2 immunotherapy regimen. The ability to prescreen patients and identify those that might have the best response to treatment could greatly enhance the clinical development timeline in future studies.
In summary, IRX-2 treatment is a modulator of the TME. The treatment is currently being tested as a stand-alone agent to restore and activate the immune system to recognize and attack tumors. The clinical response data from the ongoing international multicenter randomized controlled trial should be available in 2019, but some biologic data will be available earlier. IRX-2 is also currently being assessed as a neoadjuvant therapy in surgically operable breast cancer (NCT02950259) and as therapy for cervical and vulvar intraepithelial neoplasia (NCT03267680). Our data based on the employment of the multiplex IHC and transcriptome gene expression technologies show that activation of multiple immune cell types by IRX-2 drives intratumoral immune infiltration and stimulates adaptive increases in PDL1 expression. Based on these findings, we suggest that IRX-2 is an ideal candidate for combination with other immunomodulatory agents such as checkpoint inhibitors. Future studies will focus on the enhancement of activity that may derive from combining IRX-2 treatment with various checkpoint inhibitors and other immunomodulators.
Materials and methods
Phase 2a clinical trial
Patients with surgically resectable, potentially curable, but previously untreated HNSCC were consecutively screened at 16 academic research centers to participate in a multicenter phase 2a clinical study of IRX-2 (NCT00210470). Institutional review boards at the 16 participating centers individually approved the study. Eligible patients were aged 18 to 80 years, had a Karnofsky performance status ≥70%, and had stage II to IVa histologically proven SCC of the oral cavity, oropharynx, hypopharynx, or larynx. Twelve centers enrolled a total of 27 patients, all of whom gave informed consent. The experimental protocol was approved by the Institutional Review Board for Human Experimentation at each participating center, and the prospective study was conducted according to the principles of the Declaration of Helsinki. Details of the methods and clinical results of the study have been published.Citation20
The IRX-2 cytokine biologic used in this study was produced from healthy blood donors’ leukocytes obtained from FDA-licensed blood centers. Purified mononuclear cells were prepared and stimulated with phytohemagglutinin to induce cytokine production. Adherence to Good Manufacturing Practice ensured consistency, safety from bloodborne pathogens, and compliance with FDA guidelines under an approved Investigational New Drug Application. Each biologic lot was tested for adherence to FDA-approved specifications for content of IL-2, IL-1β, γ-IFN, TNF-α; for protein; for sterility; and for the absence of various viruses and endotoxins.Citation20
Prior to initiation of the treatment regimens, tumor biopsy samples were collected from all patients. Patients then received a non-cytotoxic dose of cyclophosphamide 3 days before initiating 10 days of peri-lymphatic IRX-2 therapy. Patients also received 21 days of indomethacin and zinc supplements prior to surgical resection. Surgical resection was performed on day 21 of the trial. All 27 subjects were treated with the IRX-2 regimen. Matched biopsy/resection samples from 7 patients were processed for multiplex immunohistochemistry (IHC) and transcriptome analysis
Tumor samples
Sites submitted one paraffin-embedded biopsy block and one representative tumor-resection block, chosen by the site pathologist according to standardized tissue-block selection guidelines, for each consented and enrolled subject. Blocks were shipped to PhenoPath Laboratories (Seattle, WA), where sections were cut from the paraffin blocks to perform hematoxylin and eosin (H&E) and IHC staining. In order to minimize site-to-site variations in tissue handling, guidelines were provided for fixing and processing the tissues. The time between tissue collection and placement in formalin was minimized. Each tissue sample was trimmed to a 4-mm thickness and fitted into the cassette with at least a 1-mm space on all sides. Cassettes were filled with 10% neutral buffered formalin to fix the tissue samples. The volume of fixative solution was 15 to 20 times greater than the volume of the tissue. If release and shipping of tissue blocks were not possible, sites were instructed to prepare unstained slides by cutting 4-μm sections onto charged glass slides (Fisherbrand Superfrost Plus, Catalogue #12-550-15 or equivalent, Thermo Fisher Scientific, Waltham, MA, USA). Slides were air dried and not baked. Sites provided 10 unstained sections per block.
Multiplex IHC
HNSCC specimens were labeled for CD4 (CD4+ T cells), CD8 (CD8+ T cells), CD20 (B cells), CD68 (macrophages), CD45 (total leukocytes), PDL1, Foxp3 (regulatory T cells), cytokeratin, and DAPI (all nuclei) using a serial same-species fluorescence-labeling approach that employs tyramide signal amplification and microwave-based antigen retrieval and antibody stripping (Opal Multiplex IHC, Perkin Elmer). Samples were imaged on a multispectral slide analysis system (Vectra Polaris Automated Quantitative Analysis System, Perkin Elmer) and analyzed with pattern-recognition software (inForm, Perkin Elmer) in order to segment tissue into tumor and stroma and to phenotype cells. All results were generated using de-identified clinical samples. Quantification of each immune population was defined in both relative (population as percent of total leukocytes) and spatial (cells per mm2) dimensions. PDL1 expression was quantified in several ways: percent of PDL1+ macrophages; total MFI; and H-score. Values for total CD3+ cells were computed by combining the values for CD4+ and CD8+ cells. Values reported in this study represent the total analyzed area for each biopsy or resection sample.
Transcriptome profiling
For each tumor biopsy and resection, one formalin-fixed paraffin-embedded (FFPE) tissue slide was stained with H&E and reviewed by a pathologist to delineate the tumor area. The mean tumor cell content was 60% (minimum 30%). MicroRNA (miRNA) or total RNA was isolated from the tumor area of 5-µm slices using the High Pure microRNA FFPE Isolation Kit (Roche, Basel, Switzerland) or High Pure FFPE RNA Micro Kit (Roche) according to the manufacturer protocols. Tissue sections were first de-paraffinized with xylene and washed with ethanol. The tissues were then lysed and treated with proteinase K for 3 hours at 55°C. Lysates were applied onto spin columns and after a washing step, miRNA was eluted in 50 µL elution buffer. Total RNA was eluted twice in 40 µL elution buffer. Afterward, the RNA was purified and concentrated using the RNA Clean & Concentrator-5 Kit (Zymo Research, Irvine, CA, USA) according to the manufacturer's protocol. RNA yield was measured by NanoDrop 2000 (Implen GmbH, Munich, Germany) or Qubit RNA BR Assay Kit (Thermo Fisher Scientific) on the Qubit 3.0 Fluorometer (Thermo Fisher Scientific). RNA quality was determined on a Lab-on-a-Chip 2100 Bioanalyzer (Agilent Technologies, Santa Clara, CA, USA). As RNA from FFPE material is generally of low quality (RNA Integrity Number [RIN] values <2), we did not exclude any sample solely based on RIN values.
Whole tumor transcriptome profiles were generated from matched biopsy and resection samples using the PanCancer Immune Profiling Panel (NanoString). This panel characterizes expression of 770 genes, including 109 that define 24 different immune cell types and populations, 30 encoding known cancer/testis antigens, >500 encoding critical proteins in immune response pathways, and 40 pan-cancer housekeeping genes. Expression data were normalized and analyzed with the nSolver Analysis Software 2.5 using the PanCancer Immune Profiling Advanced Analysis Module (NanoString). For background correction, the mean count of negative controls plus twice the standard deviation was subtracted from the count for each gene. The geNorm algorithm was used to identify the most stable housekeeping genes.Citation34 The geometric mean of the selected housekeeping genes was used to calculate a normalization factor for each sample.
Immuno-informatics analyses
Data generated from multiplex IHC, transcriptome, and pathology analyses were integrated, analyzed, and visualized using the open-source Biomarkers, Outcomes and Stats Software (BOSS) package (PPMC, Portland, OR, USA). This software incorporates interactive charting tools developed by Google (Mountain View, CA, USA) and HighSoft (Vik i Sogn, Norway). The direct correlation between parameters across analytical platforms was evaluated by linear regression. Gene signature values represent a weighted composite average of a subset of genes specific to each immune pathway or cell subset.
Disclosure of potential conflicts of interest
Dr. Neil L. Berinstein is a member of the management team for and has received research support from IRX Therapeutics. Dr. James Egan is a member of the management team for IRX Therapeutics. Drs. Michael McNamara and Ariane Nguyen have received research support from IRX Therapeutics. Dr. Gregory T. Wolf is a consultant for and has received research support from IRX Therapeutics.
Supplemental_figures_1_to_8__Berinstein_et_al.pdf
Download PDF (1.6 MB)Acknowledgments
For their contributions to the IRX-2 phase 2a studies, the authors acknowledge the following investigators: Cécile Badoual, MD, PhD (Hôpital Européen Georges Pompidou, Paris, France); Lorraine Baltzer, RN, BSN, MS (IRX Therapeutics, New York, NY); Harvey J. Brandwein, PhD (IRX Therapeutics, New York, NY); William R. Carroll, MD (University of Alabama Hospital, Birmingham, AL); Robert W. Dolan, MD (Lahey Clinic Medical Center, Burlington, MA); Adel K. El-Naggar, MD (M.D. Anderson Cancer Center, Austin, TX); Willard E. Fee Jr, MD (Stanford University Medical Center, Stanford CA); Scott M. Freeman, MD (IRX Therapeutics, New York, NY); Wolf-Hervé Fridman, MD (Hôpital Européen Georges Pompidou, Paris, France); M. Boyd Gillespie, MD (Medical University of South Carolina, Charleston, SC); Lynn C. Goldstein, MD (PhenoPath Laboratories, Seattle, WA); Daniel E. Kenady, MD (University of Kentucky, Lexington KY); Terry D Kirkley, BS (IRX Therapeutics, New York, NY); Jeffrey S. Moyer, MD (University of Michigan, Ann Arbor, MI); Paul H. Naylor, PhD (IRX Therapeutics, New York, NY); Jason G. Newman, MD (University of Pennsylvania, Philadelphia, PA); Paul M. Spring, MD (University of Arkansas for Medical Sciences, Little Rock, AR); James Suen, MD (University of Arkansas for Medical Sciences, Little Rock, AR); J. Michael White, PhD (JM White Associates, Mount Vernon, WA); and Theresa L. Whiteside, PhD (Hillman Cancer Center, Pittsburgh, PA).
Writing support services were provided by Galen Press, Inc. (Austerlitz, New York) and paid for by the study sponsor.
Additional information
Funding
References
- Martin-Liberal J, Ochoa de Olza M, Hierro C, Gros A, Rodon J, Tabernero J. The expanding role of immunotherapy. Cancer Treat Rev. 2017;54:74–86. doi:10.1016/j.ctrv.2017.01.008.
- Galon J, Costes A, Sanchez-Cabo F, Kirilovsky A, Mlecnik B, Lagorce-Pages C, Tosolini M, Camus M, Berger A, Wind P, et al. Type, density, and location of immune cells within human colorectal tumors predict clinical outcome. Science. 2006;313:1960–4. doi:10.1126/science.1129139.
- Mlecnik B, Tosolini M, Kirilovsky A, Berger A, Bindea G, Meatchi T, Bruneval P, Trajanoski Z, Fridman WH, Pagès F, et al. Histopathologic-based prognostic factors of colorectal cancers are associated with the state of the local immune reaction. J Clin Oncol. 2011;29:610–8. doi:10.1200/JCO.2010.30.5425.
- Becht E, Giraldo NA, Germain C, de Reynies A, Laurent-Puig P, Zucman-Rossi J, Dieu-Nosjean MC, Sautès-Fridman C, Fridman WH. Immune contexture, immunoscore, and malignant cell molecular subgroups for prognostic and theranostic classifications of cancers. Adv Immunol. 2016;130:95–190. doi:10.1016/bs.ai.2015.12.002.
- Galon J, Mlecnik B, Bindea G, Angell HK, Berger A, Lagorce C, Lugli A, Zlobec I, Hartmann A, Bifulco C, et al. Towards the introduction of the ‘Immunoscore’ in the classification of malignant tumours. J Pathol. 2014;232:199–209. doi:10.1002/path.4287.
- Gajewski TF, Schreiber H, Fu YX. Innate and adaptive immune cells in the tumor microenvironment. Nat Immunol. 2013;14:1014–22. doi:10.1038/ni.2703.
- Dempke WC, Fenchel K, Uciechowski P, Dale SP. Second- and third-generation drugs for immuno-oncology treatment — the more the better? Eur J Cancer. 2017;74:55–72. doi:10.1016/j.ejca.2017.01.001.
- Kourie HR, Awada G, Awada AH. Learning from the “tsunami” of immune checkpoint inhibitors in 2015. Crit Rev Oncol Hematol. 2016;101:213–20. doi:10.1016/j.critrevonc.2016.03.017.
- Ni L, Dong C. New checkpoints in cancer immunotherapy. Immunol Rev. 2017;276:52–65. doi:10.1111/imr.12524.
- Hughes PE, Caenepeel S, Wu LC. Targeted therapy and checkpoint immunotherapy combinations for the treatment of cancer. Trends Immunol. 2016;37:462–76. doi:10.1016/j.it.2016.04.010.
- Cully M. Combinations with checkpoint inhibitors at wavefront of cancer immunotherapy. Nat Rev Drug Discov. 2015;14:374–5. doi:10.1038/nrd4648.
- Egan JE, Quadrini KJ, Santiago-Schwarz F, Hadden JW, Brandwein HJ, Signorelli KL. IRX-2, a novel in vivo immunotherapeutic, induces maturation and activation of human dendritic cells in vitro. J Immunother. 2007;30:624–33. doi:10.1097/CJI.0b013e3180691593.
- Schilling B, Harasymczuk M, Schuler P, Egan J, Ferrone S, Whiteside TL. IRX-2, a novel immunotherapeutic, enhances functions of human dendritic cells. PLoS One. 2013;8:e47234. doi:10.1371/journal.pone.0047234.
- Czystowska M, Han J, Szczepanski MJ, Szajnik M, Quadrini K, Brandwein H, Hadden JW, Signorelli K, Whiteside TL. IRX-2, a novel immunotherapeutic, protects human T cells from tumor-induced cell death. Cell Death Differ. 2009;16:708–18. doi:10.1038/cdd.2008.197.
- Czystowska M, Szczepanski MJ, Szajnik M, Quadrini K, Brandwein H, Hadden JW, Whiteside TL. Mechanisms of T-cell protection from death by IRX-2: a new immunotherapeutic. Cancer Immunol Immunother. 2011;60:495–506. doi:10.1007/s00262-010-0951-9.
- Schilling B, Harasymczuk M, Schuler P, Egan JE, Whiteside TL. IRX-2, a novel biologic, favors the expansion of T effector over T regulatory cells in a human tumor microenvironment model. J Mol Med (Berl). 2012;90:139–47. doi:10.1007/s00109-011-0813-8.
- Schilling B, Halstead ES, Schuler P, Harasymczuk M, Egan JE, Whiteside TL. IRX-2, a novel immunotherapeutic, enhances and protects NK-cell functions in cancer patients. Cancer Immunol Immunother. 2012;61:1395–405. doi:10.1007/s00262-011-1197-x.
- Naylor PH, Egan JE, Berinstein NL. Peptide based vaccine approaches for cancer — a novel approach using a WT-1 synthetic long peptide and the IRX-2 immunomodulatory regimen. Cancers (Basel). 2011;3:3991–4009. doi:10.3390/cancers3043991.
- Naylor PH, Hernandez KE, Nixon AE, Brandwein HJ, Haas GP, Wang CY, Hadden JW. IRX-2 increases the T cell-specific immune response to protein/peptide vaccines. Vaccine. 2010;28:7054–62. doi:10.1016/j.vaccine.2010.08.014.
- Wolf GT, Fee WE, Jr., Dolan RW, Moyer JS, Kaplan MJ, Spring PM, Suen J, Kenady DE, Newman JG, Carroll WR. Novel neoadjuvant immunotherapy regimen safety and survival in head and neck squamous cell cancer. Head Neck. 2011;33:1666–74. doi:10.1002/hed.21660.
- Berinstein NL, Wolf GT, Naylor PH, Baltzer L, Egan JE, Brandwein HJ, Whiteside TL, Goldstein LC, El-Naggar A, Badoual C, et al. Increased lymphocyte infiltration in patients with head and neck cancer treated with the IRX-2 immunotherapy regimen. Cancer Immunol Immunother. 2012;61:771–82. doi:10.1007/s00262-011-1134-z.
- Dennis L, Kaufmann S, Danaher P, Bailey C, Beechem. Multiplexed cancer immune response analysis: nCounter® PanCancer Immune Profiling Panel for gene expression [white paper]. August 2015 [accessed 2017 August 11]. https://www.europeanpharmaceuticalreview.com/wp-content/uploads/WP_nCounter_PanCancer_Immune_Profiling_Panel-1.pdf.
- Whiteside TL, Butterfield LH, Naylor PH, Egan JE, Hadden JW, Baltzer L, Wolf GT, Berinstein NL. A short course of neoadjuvant IRX-2 induces changes in peripheral blood lymphocyte subsets of patients with head and neck squamous cell carcinoma. Cancer Immunol Immunother. 2012;61:783–8. doi:10.1007/s00262-011-1136-x.
- Cyster JG. Chemokines, sphingosine-1-phosphate, and cell migration in secondary lymphoid organs. Annu Rev Immunol. 2005;23:127–59. doi:10.1146/annurev.immunol.23.021704.115628.
- Lo CG, Xu Y, Proia RL, Cyster JG. Cyclical modulation of sphingosine-1-phosphate receptor 1 surface expression during lymphocyte recirculation and relationship to lymphoid organ transit. J Exp Med. 2005;201:291–301. doi:10.1084/jem.20041509.
- Tumeh PC, Harview CL, Yearley JH, Shintaku IP, Taylor EJ, Robert L, Chmielowski B, Spasic M, Henry G, Ciobanu V, et al. PD-1 blockade induces responses by inhibiting adaptive immune resistance. Nature. 2014;515:568–71. doi:10.1038/nature13954.
- van Rooij N, van Buuren MM, Philips D, Velds A, Toebes M, Heemskerk B, van Dijk LJ, Behjati S, Hilkmann H, El Atmioui D, et al. Tumor exome analysis reveals neoantigen-specific T-cell reactivity in an ipilimumab-responsive melanoma. J Clin Oncol. 2013;31:e439−42. doi:10.1200/JCO.2012.47.7521.
- Rizvi NA, Hellmann MD, Snyder A, Kvistborg P, Makarov V, Havel JJ, Lee W, Yuan J, Wong P, Ho TS, et al. Cancer immunology. Mutational landscape determines sensitivity to PD-1 blockade in non-small cell lung cancer. Science. 2015;348:124–8. doi:10.1126/science.aaa1348.
- Snyder A, Makarov V, Merghoub T, Yuan J, Zaretsky JM, Desrichard A, Walsh LA, Postow MA, Wong P, Ho TS, et al. Genetic basis for clinical response to CTLA-4 blockade in melanoma. N Engl J Med. 2014;371:2189–99. doi:10.1056/NEJMoa1406498.
- Kamphorst AO, Pillai RN, Yang S, Nasti TH, Akondy RS, Wieland A, Sica GL, Yu K, Koenig L, Patel NT, et al. Proliferation of PD-1+ CD8 T cells in peripheral blood after PD-1-targeted therapy in lung cancer patients. Proc Natl Acad Sci USA. 2017;114:4993–8. doi:10.1073/pnas.1705327114.
- Garcia-Diaz A, Shin DS, Moreno BH, Saco J, Escuin-Ordinas H, Rodriguez GA, Zaretsky JM, Sun L, Hugo W, Wang X, et al. Interferon receptor signaling pathways regulating PD-L1 and PD-L2 expression. Cell Rep 2017;19:1189–201. doi:10.1016/j.celrep.2017.04.031.
- Freeman SM, Franco JL, Kenady DE, Baltzer L, Roth Z, Brandwein HJ, Hadden JW. A phase 1 safety study of an IRX-2 regimen in patients with squamous cell carcinoma of the head and neck. Am J Clin Oncol. 2011;34:173–8
- Larkin J, Hodi FS, Wolchok JD. Combined nivolumab and ipilimumab or monotherapy in untreated melanoma. N Engl J Med. 2015;373:1270–1. doi:10.1056/NEJMoa1504030.
- Vandesompele J, De Preter K, Pattyn F, Poppe B, Van Roy N, De Paepe A, Speleman F. Accurate normalization of real-time quantitative RT-PCR data by geometric averaging of multiple internal control genes. Genome Biol. 2002;3:RESEARCH0034. doi:10.1186/gb-2002-3-7-research0034.

