
ABSTRACT
Bone marrow niches support multiple myeloma, providing signals and cell-cell interactions essential for disease progression. A 3D bone marrow niche model was developed, in which supportive multipotent mesenchymal stromal cells and their osteogenic derivatives were co-cultured with endothelial progenitor cells. These co-cultured cells formed networks within the 3D culture, facilitating the survival and proliferation of primary CD138+ myeloma cells for up to 28 days. During this culture, no genetic drift was observed within the genomic profile of the primary myeloma cells, indicating a stable outgrowth of the cultured CD138+ population.
The 3D bone marrow niche model enabled testing of a novel class of engineered immune cells, so called TEGs (αβT cells engineered to express a defined γδTCR) on primary myeloma cells. TEGs were engineered and tested from both healthy donors and myeloma patients. The added TEGs were capable of migrating through the 3D culture, exerting a killing response towards the primary myeloma cells in 6 out of 8 donor samples after both 24 and 48 hours. Such a killing response was not observed when adding mock transduced T cells. No differences were observed comparing allogeneic and autologous therapy. The supporting stromal microenvironment was unaffected in all conditions after 48 hours. When adding TEG therapy, the 3D model surpassed 2D models in many aspects by enabling analyses of specific homing, and both on- and off-target effects, preparing the ground for the clinical testing of TEGs. The model allows studying novel immunotherapies, therapy resistance mechanisms and possible side-effects for this incurable disease.
Introduction
The adult bone marrow (BM) contains niches that maintain and regulate various stem and progenitor cells. Hematopoietic stem cells (HSCs) home in these niches, which provide cell-cell interactions and signals needed for proper HSC self-renewal and differentiation.Citation1 A BM niche is a complex structure, composed of vasculature, bone, stromal cells, extracellular matrix and hematopoietic cells.Citation2,Citation3
Plasma cells also reside within the BM and depend on signals provided by the surrounding environment enabling quiescence, and regulating proliferation or differentiation.Citation4 Oncogenic transformation of plasma cells results in multiple myeloma. Myeloma cells utilize and alter the surrounding BM microenvironment,Citation5 to support tumor proliferation, resistance to therapy, cancer cell trafficking and homing.Citation6-8
Until recently, in vitro myeloma research mainly depended on 2D models using cell lines derived from advanced stage patients, which can be cultured independent of BM niche signals unlike primary myeloma cells. These 2D models are frequently not predictive for the clinical success of a treatment, emphasizing the need for the development of a patient-specific model supporting primary myeloma cells.Citation9,Citation10 Various mouse models have been developed that support the growth of primary myeloma cells within a 3D microenvironment.Citation11,Citation12 Although these are more complex and therefore regarded as more relevant, major limitations arise from the extensive numbers of animals needed and not being representative for the human microenvironment.
New models aim to culture primary myeloma cells in vitro, in a 3D environment mimicking the human BM.Citation13-18 Bone fragments from patients reconstitute an autologous BM environment, but lack reproducibility and availability.Citation13 Tissue-engineered bone can potentially overcome these problems, using off-the-shelf scaffold materials.Citation19 The combination of hydrogels with embedded cells and ceramic particles is known to result in fully functional bone and marrow ingrowth after implantation in vivo.Citation20-22 Natural or synthetic hydrogels such as collagen, fibrin, Puramatrix and Matrigel are biocompatible and have proven to be widely applicable for 3D tissue constructs, including in vitro myeloma models.Citation16-18,Citation23 Also porous silk scaffolds or polycarbonate membrane disks have been used as a mineralized bone model for primary myeloma culture.Citation14,Citation15 However until now, it was seen that primary myeloma survival and proliferation decreases in time resulting in short term cultures.Citation14-16,Citation18
The development of a patient-specific model supporting primary myeloma cell growth could be of great value not only for mechanistic studies addressing tumor progression and niche changes, but also in the design and testing of new treatment strategies for myeloma. Current treatment options depend on pharmaceutical and radio therapeutic interventions that already considerably improved patient outcome over the last decades.Citation24 However, novel targeted therapies hold the potential to further improve this progress through effective, well-tolerated targeting.
Adoptive T cell therapy aims to engineer tumor-specific T cells for a targeted approach.Citation25 One of these novel T cell therapies employs αβT cells engineered to express tumor-specific Vγ9Vδ2 TCRs (TEGs), eliminating cancer cells via an inside out mechanism involving CD277, targeting a wide variety of tumor cells including myeloma cells.Citation26-29 αβT cells are present abundantly in the blood with extensive proliferation capacities, making it possible to generate large numbers of TEGs in vitro with defined tumor-specificity.Citation30 TEGs targeted response has been shown using myeloma cell lines, but not using primary myeloma cells.Citation31 It is also not known whether TEGs are effective in the physiological environment of human BM. At present, there is no suitable myeloma model available for pre-clinical in vitro testing of immunotherapies on primary patient samples for their tumor specificity within a heterogeneous tumor population, or to study the role of the tumor microenvironment in therapy resistance.
The aims of the current study were 1. to develop an in vitro 3D BM niche model for the prolonged maintenance and proliferation of primary myeloma cells, 2. to determine genetic stability of the cultured myeloma cells within the model, and 3. to assess effectivity of both allogeneic and autologous TEG mediated immunotherapy on primary myeloma cells cultured within the model. In order to do so, various hydrogels and combinations of cell types present in the BM were analyzed for their suitability to support primary CD138+ myeloma cells. Genetic changes of myeloma cells and supportive stromal cell in co-culture were investigated, and TEGs were analyzed for their ability to home towards the cultured myeloma cells and exert a killing response, and their potential harming of bystander cells.
Results
Establishment of a 3D BM niche model
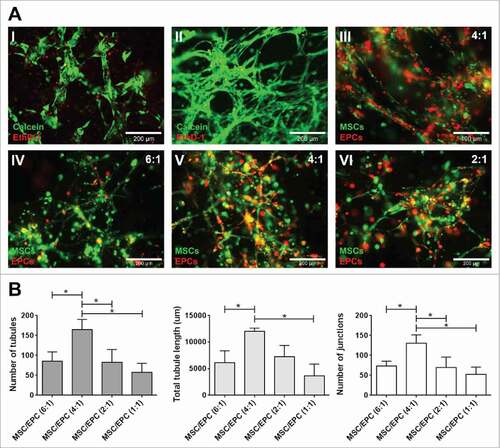
After optimizing the 3D matrix (S-Fig. 1), the best ratio and composition of cellular components were examined. The optimal ratio was determined looking at the ability of embedded endothelial progenitor cells (EPCs) and multipotent mesenchymal stromal cells (MSCs) to form networks, as this indicates the formation of a prevascular structure.Citation32 The most extensive network formation was obtained by culturing MSCs and EPCs at a 4:1 ratio, with significantly more tubules, tubule length and number of junctions when compared to the other ratios tested ().
Figure 1. Network formation of MSC-EPC co-cultures. (A) Fluorescent images of networks formed by EPCs (I) and MSCs alone (II). Live cells in green (calcein); dead cells in red (ethidium homodimer-1). The scale bar represents 200 µm. Fluorescent image of MSCs (DiO, green) and EPCs (DiI, red) co-cultures after 7 days in 50% Matrigel (III). The scale bar represents 100 µm. Fluorescent images, MSCs (DiO, green) and EPCs (DiI, red) at a 6:1, 4:1 and 2:1 ratios after 14 days of culture (IV,V,VI). The scale bar represents 200 µm. (B) Day 14 analysis of three MSC donors combined with three EPC donors at different ratios, looking at number of tubules, total tubule length (µm) and number of junctions.
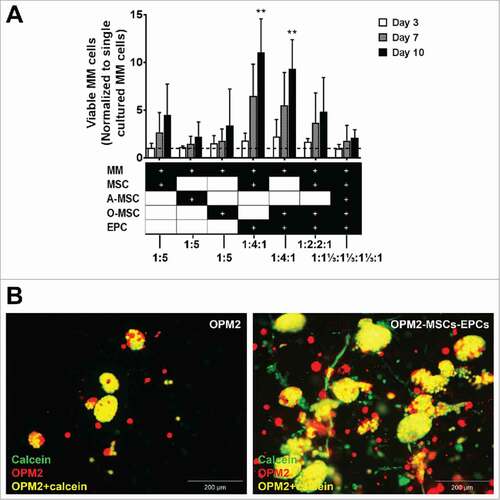
To investigate the optimal cellular composition, the supportive abilities of these networks towards myeloma cells were examined, using both undifferentiated and differentiated MSCs. Myeloma cell lines (OPM2, U266 and L363) were added to different cellular environments, after which myeloma cell survival and proliferation was analyzed. No significant increase in myeloma cell proliferation was observed when co-cultured with MSCs, adipogenic MSCs or osteogenic MSCs alone. A significant increase in myeloma cell proliferation was observed after 10 days of co-culture with a combination of MSCs-EPCs or osteogenic MSCs-EPCs. Combining all three supportive cell types in a single construct (MSCs, osteogenic MSCs and EPCs) did not show the effect of either MSCs-EPCs or osteogenic MSCs-EPCs separately ().
Figure 2. Expansion of (co-)cultured cell lines in a 3D BM niche model. (A) Number of viable co-cultured myeloma cell lines (cultured with MSCs, adipogenic MSCs (A-MSCs), osteogenic MSCs (O-MSCs) and/or EPCs) after 3, 7 or 10 days of culture, normalized to single cultured myeloma cell lines (n = 3). Dashed line represents single cultured myeloma cell lines. Statistical analysis compared all groups to the single cultured control group. ## = P < 0.01. (B) Fluorescent images of OPM2 cells (DiI, red) without supporting cells after 10 days of culture with added calcein-AM (green) and fluorescent images of OPM2 cells (DiI, red) with added calcein-AM (green) cultured with supporting MSCs and EPCs at day 10. Overlay of green and red appears yellow, demonstrating living OPM2 cells. The scale bar represents 200 µm.
Developed model supports long term primary myeloma cultures
The major criteria for relevance of the reconstituted BM niche model is survival and proliferation of primary myeloma cells, and in parallel experiments not reported here, maintenance of hematopoietic stem and progenitor cells. CD138+ myeloma cells (S-Fig. 2) were co-cultured with different combinations of supportive cells (). The combinations of MSCs-EPCs and osteogenic MSCs-EPCs were selected as most promising in supporting myeloma cells expansion based on previous co-cultures using cell lines (). MSCs and EPCs were also individually co-cultured with primary myeloma cells to look at their separate effects.
Figure 3. (Co-)culture of primary CD138+ myeloma cells in a 3D BM niche model for 14 days. (A) CD138+ myeloma (MM) cells expanded for 14 days in a 3D Matrigel environment, with or without supporting cells (MSCs, osteogenic MSCs (O-MSCs) and/or EPCs) n = 5. Statistical analysis compared all groups to the single cultured control group. # = P < 0.05, ## = P < 0.01. (B) Confocal images showing an overview of one representative donor (DiO, red) cultured in 3D with MSCs and EPCs for either 7 (I) or 14 days (II). DAPI (blue), MSC-EPC networks are visualized using phalloidin (yellow). Aggregates of CD138+ myeloma cells are indicated with white dashed circles. The scale bar represents 500 µm.
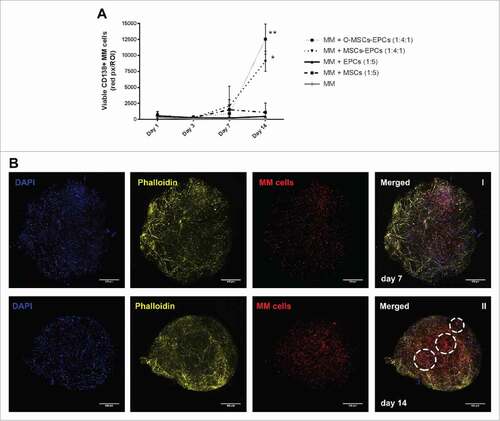
The first 5 donors displayed no significant increase in myeloma survival when co-cultured for 14 days with solely MSCs or EPCs. A significant increase was observed when myeloma cells were co-cultured with MSCs-EPCs or osteogenic MSCs-EPCs, similar to the myeloma cell line co-cultures. Increased numbers of myeloma cells started to become visible after 14 days, with a lag time of more than a week (). Isolated CD138+ myeloma cells from newly diagnosed donors showed less myeloma cell survival at day 14, compared to relapsed or relapsed/refractory donors (data not shown). The formation of networks by the supporting cells was observed throughout all cultures.
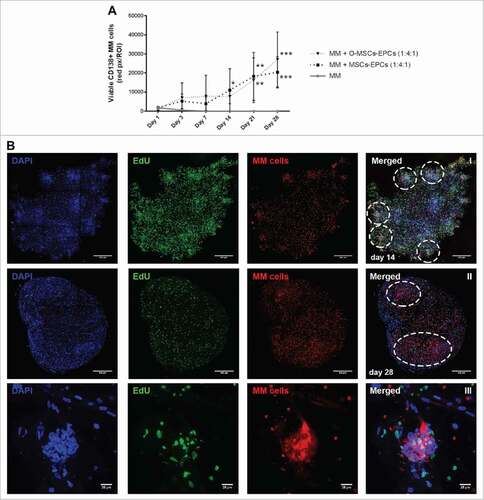
The experiment was repeated with myeloma cells from 4 more donors, and extended to a culture duration of 28 days. The two most optimal culture conditions of the previous experiment were compared to the maintenance of myeloma cells without supportive cells. Sustained viability of CD138+ myeloma cells was observed for up to 28 days of culture (). Aggregates of myeloma cells were visible starting from day 14 onwards. These aggregates enlarged and became large diffuse tumor mass as the culture continued until day 28 (). Cycling CD138+ myeloma cells were detected at day 28, as seen by EdU incorporation (). However in general, more cycling cells were present at day 14 compared to day 21 and 28, indicating a decline in total proliferation after 14 days. Also shrinkage of the Matrigel hybrid construct could be observed over time. Therefore a culture duration longer than 28 days was not performed.
Figure 4. Extended (co-)culture of primary CD138+ myeloma cells in a 3D BM niche model up to 28 days. (A) CD138+ myeloma (MM) cells expanded in a 3D Matrigel environment for 28 days, with or without supporting cells (EPCs with MSCs or osteogenic MSCs (O-MSCs)) n = 4. Statistical analysis compared all groups to the single cultured control group. # = P < 0.05, ## = P < 0.01, ### = P < 0.001. (B) Confocal images of CD138+ myeloma cells of one representative donor co-cultured for either 14 (I) or 28 days (II) with MSCs and EPCs (DAPI (blue), EdU (green)). Aggregates of CD138+ myeloma cells are indicated with white dashed circles. The scale bar represents 500 µm. A zoomed in picture of a CD138+ myeloma cell aggregate at day 28 (III) shows proliferation during culture (EdU, green). The scale bar represents 25 µm.
Cellular interactions within the BM niche model appeared reminiscent of the patient native BM as seen by the change in MSCs' mineralization capacity (S-Fig. 3). Additionally, the genomic profile of 3 myeloma donors was analyzed, with a microarray technology that enables genome-wide analysis based on single-nucleotide polymorphisms (SNPs).Citation33 The donors were analyzed before and after 28 days of co-culture with supporting cells. At day 28, the DNA of the cultured myeloma represented 23.3% ± 12.5% of the total DNA. At day 0, this relative contribution was16.7% ± 4.2%. Most importantly, no genetic drift was observed within the population of cultured cells, indicating the model's capacity to reliably represent the genomic profile of the patient derived cells at time of isolation ().
Figure 5. Whole genome analysis using single-nucleotide polymorphisms (SNP) mapping revealing gains and losses, as well as regions of loss of heterozygosity. (A) Genome overview showing the log2 R ratio (top) and B allele frequency (bottom) of the CD138+ cells of one representative donor at day 0 before co-culture. In the whole genome, 19 sites of gains and losses could be identified within this donor. (B) Genome analysis showing the log2 R ratio (top) and B allele frequency (bottom) of the CD138+ cells and supporting cells of the same donor at day 28. In the whole genome, 17 sites of gains and losses could still be identified, all corresponding with gains and losses present at day 0. All 17 gains and losses identified at day 28 were mosaic, with a presence of 80–85% at day 0. The 2 gains and losses no longer identifiably at day 28 were also mosaic at day 0, with a presence of 10–15%. Similar results were obtained for 2 other donors.
3D BM niche model provides a platform for immunotherapy testing
The developed BM niche model was investigated for its potential to test immunotherapies in a 3D BM environment, as a pre-clinical model. For these experiments, MSCs and EPCs were selected as the cellular environment in which the OPM2 cells and all primary CD138+ myeloma cells were first grown before therapy addition. This co-culture showed the capability to sustain the viability of primary CD138+ myeloma cells over the course of weeks (), without the need to first differentiate the MSCs towards the osteogenic lineage for at least 14 days, as in the osteogenic MSC-EPC combination.
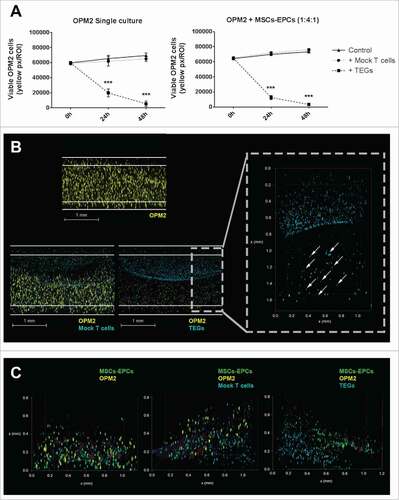
The TEGs used were engineered to exert a killing response towards various cancer cells, including myeloma cells.Citation28 After adding a layer of either TEGs or transduced T cells expressing a nonfunctional TCR (mock T cells) to the 3D model, migration of TEGs occurred from the added Matrigel layer towards the OPM2 (co)culture, as shown by live cell confocal microscopy (). This demonstrates that the 3D model representing the BM microenvironment supported migration of TEGs necessary for its killing response. A killing response was observed in the presence of TEGs in both the single cultured OPM2 cells and the OPM2 cells co-cultured with supportive cells. No differences were observed between the control co-cultures with the mock T cell co-cultures, both with or without supportive cells, confirming a lacking alloreactivity from the mock T cells ().
Figure 6. TEGs migrate and target OPM2 in a 3D BM niche model. (A) Left panel: quantification of viable OPM2 cells present in culture during 48 hours, untreated or after addition of either mock T cells or TEGs. Right panel: quantification of viable OPM2 cells co-cultured with MSCs and EPCs during 48 hours, untreated or after addition of either mock T cells or TEGs. Statistical analysis compared all groups to the non-treated control group. ### = P < 0.001. (B) Confocal 3D images of OPM2 cultures after 24 hours of culture, showing OPM2 (DiI, yellow), mock T-cells or TEGs (DiD, cyan) and apoptotic cells (Caspase-3, red). The scale bars represent 1 mm. A zoomed in confocal 3D image shows the migration of TEGs (DiD, cyan, indicated by white arrow) into the OPM2 culture (DiI, yellow) after 24 hours. TEGs can be found throughout the entire height of the Matrigel 50% (v/v) plug. (C) Confocal 3D images of OPM2 co-cultures after 24 hours of culture, showing OPM2 (DiI, yellow), mock T cells or TEGs (DiD, cyan), MSCs and EPCs (DiO, green) and apoptotic cells (Caspase-3, red).
A layer of TEGs or mock T cells were also added to primary myeloma cells of 6 donors, cultured in the 3D BM niche model. TEGs efficiently migrated into the construct whereas mock T cells did not (S-Fig. 4). A killing response was observed in the presence of TEGs () at varying degrees of efficacy. A significant killing response was seen in 4 donors (1 newly diagnosed, 1 relapsed and 2 relapsed/refractory), 2 donors (both relapsed/refractory) showed a non-significant killing response after both 24 and 48 hours, with a trend of less primary CD138+ cells where TEGs were added. Importantly, 2D co-cultureCitation31 of the same myeloma cells and TEGs did not reveal significant targeting of the primary myeloma samples by TEGs (S-Table 1), indicating the high sensitivity of tumor reactivity seen in the 3D BM niche model.
Figure 7. TEGs migrate and target primary myeloma in a 3D BM niche model. (A) Quantification of primary CD138+ myeloma (MM) cells present in the 3D BM niche model after 16 days (n = 6). Average presence of CD138+ myeloma cells in the controls, or 48 hours after mock T cell or TEG addition. # = P < 0.05. (B) Confocal images (merged z-stack, maximum intensity) showing one representative donor after 16 days of culture (14 days pre-culture, 48 hours of culture with added T cells). CD138+ myeloma cells (DiI, yellow) co-cultured with both MSCs and EPCs (DiO, green) 48 hours after mock T cell addition (DiD, cyan). No differences are observed in number of CD138+ myeloma cells comparing the periphery (left dashed region) and center (right dashed region) of the construct, the mock T-cells did not migrate into the co-culture (white dashed squares). CD138+ myeloma cells (DiI, yellow) co-cultured with both MSCs and EPCs (DiO, green), 48 hours after TEG addition (DiD, cyan). Less CD138+ myeloma cells are present in the periphery, compared to the center of the culture. TEGs migrated from the left border into the BM niche model (white dashed squares). (C) Quantification of primary CD138+ myeloma (MM) cells present in the 3D BM niche model after 16 days (14 days pre-culture, 48 hours of culture with added T cells), comparing the previously used allogeneic T cell treatment with an autologous T cell treatment (n = 2). No differences were observed when comparing MM viability after allogeneic or autologous TEG treatment, nor between control and Mock T cells. # = P < 0.05, ## = P < 0.01.
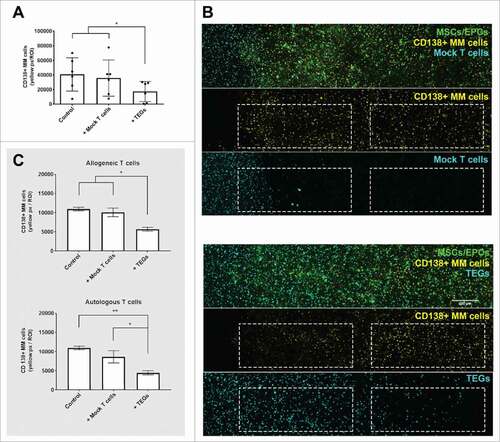
Table 1. Patient demographics and characteristics
To allow future translation of TEG therapy to the clinic, allogeneic TEG therapy was compared to autologous TEG therapy in 2 additional donors (both newly diagnosed). TEGs were generated successfully from the T cells of these myeloma patients, which expanded well (S-Table 2). The yield of autologous myeloma TEGs was comparable to allogeneic healthy donor derived TEGs (S-Fig. 5). Both the allogeneic and autologous TEGs were capable of migrating into the 3D bone marrow niche model. A killing response was observed against the primary CD138+ myeloma cells using autologous TEGs, comparable to that of the allogeneic TEGs ().
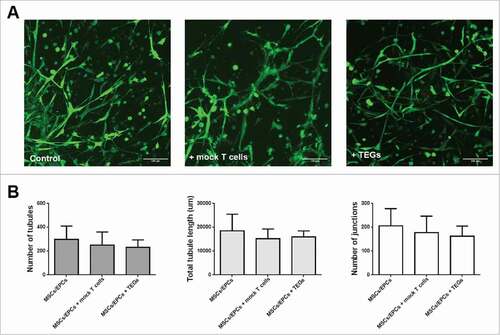
The added TEGs left the supporting cells untouched with respect to viability and network morphology, tubule length and number of junctions within their prevascular networks (). Thus no off-target effects (alloreactivity) of the TEGs were observed towards the supporting MSC/EPC networks. These data demonstrate the model's potential to assess not only homing and efficacy of TEGs but also monitor off-target toxicity in the context of a physiological BM environment.
Figure 8. Intact viable MSC/EPC networks in the 3D BM niche model, 48 hours after T-cell addition. (A) Fluorescent images of networks formed by MSCs and EPCs co-cultured with myeloma cells, in the control, mock T-cell and TEG condition (n = 6). Live cells in green (calcein); The scale bar represents 100 µm. (B) Analysis of the number of junctions, number of tubules or the total tubule length (µm) within the living MSC/EPC networks 48 hours after T-cell addition. There were no significant differences between the groups when analyzing different parameters of network formation.
Discussion
The developed novel in vitro 3D BM niche model harbors the characteristics of a representative tumor microenvironment model.Citation34 The model supports the survival and proliferation of primary CD138+ myeloma cells for up to 28 days, indicating an in vitro environment sufficiently mimicking the in vivo environment over time. The human form of the disease is modeled, with no need of animals classically used to reproduce the disease in a 3D microenvironment.Citation11,Citation12 In addition, the model has shown reproducible results from a heterogeneous panel of primary CD138+ myeloma cells, a genetically stable outgrowth of CD138+ myeloma cells, and supports cell migration and T cell mediated immunotherapy studies. The interactions between the cultured CD138+ myeloma cells and the surrounding supporting cells of the model proved representative for the patients' BM, which is of great value for mechanistic studies as well as for prognostic personalized medicine.
We advanced on currently available models by providing solid reproducibility and availability,Citation13,Citation18 providing a more natural 3D instead of a 2D attachment surface to the seeded cells.Citation14,Citation15 Also various cellular BM components were added, this compared to models based on a single cell type (MSCs or osteoblasts).Citation23,Citation35 The MSCs and EPCs were capable to form bioactive networks within the 3D culture, which are regarded as an indicator of functional prevascular structures, present in native tissues.Citation36 The vasculature within the myeloma BM is known to have a paracrine stimulatory effect on myeloma cells.Citation37
Healthy allogeneic MSCs isolated from BM of the iliac crest or the supra acetabular sulcus were used in the performed co-culture experiments. Earlier studies have shown that MSCs isolated from the BM of various locations have similar yields, phenotype, proliferation capacities and differentiation potential compared to MSCs isolated from the iliac crest.Citation38,Citation39 However in myeloma BM, it is known that myeloma cells utilize and alter the surrounding BM microenvironment, creating abnormal MSCs supporting tumor growth.Citation5-8,Citation40 A fully autologous BM niche model is in theory possible, but requires more culture time before use within the 3D model. Only low number of MSCs and EPCs can be directly obtained from the BM, requiring expansion for several weeks to obtain sufficient cell numbers.Citation18,Citation23,Citation41 When using a 3D model for therapy testing, the use of already expanded allogeneic supportive cells saves time and ensures reproducibility of the model. Additionally, it has been shown that healthy MSCs can in vitro change their phenotype within hours of co-culture with MM cells, and become similar to patient-derived myeloma MSCs.Citation42
With our allogeneic BM niche model, we show that healthy MSCs do have the capability to support and maintain primary myeloma cells for a prolonged period of time. We also showed myeloma induced differences in osteogenic potential of the allogeneic MSCs after myeloma co-culture. It is known that the expansion of myeloma cells in the BM disrupts the process of bone remodeling through the exchange of soluble factors and direct cell-cell contact between myeloma cells and the surrounding tissue.Citation8,Citation43,Citation44 The cultured myeloma cells thus have the ability to change the phenotype of the allogeneic healthy MSCs to one more resembling its autologous MSCs. These results indicate that the cellular interactions in the in vitro model reflect the in vivo complexity.
Primary CD138+ myeloma cells and supporting niche cells were able to physically interact for at least 28 days, enabling the investigation of both early and late interactions. Our data confirmed that low myeloma proliferation rates were observed within the first 7 days of culture in the BM niche model, in accordance with others.Citation18 However, a clear increase in proliferation (as seen by increased numbers of EdU positive cells in myeloma clusters) was observed from day 14 onwards. Overall, proliferation in the first 7 days seems to be poorly predictive for later culture time points. Importantly, absence of genetic drift was observed within the population of cultured myeloma cells during 28 days, indicating outgrowth of all tumor genotypes present rather than a preferential outgrowth of a subset of the tumor cells.
A patient-specific myeloma culture model is particularly interesting for performing therapies, including pharmacological testing and cellular immunotherapy, as myeloma is still an incurable disease.Citation45 Models that resemble the malignant BM are needed, as the role of the BM microenvironment in tumor progression and resistance to therapy is well established.Citation7,Citation46
The testing of cellular immunotherapy demands an environment in which the immune cells can infiltrate the construct. T cells are known to infiltrate and migrate through Matrigel after activationCitation47,Citation48 and our data using TEGsCitation30,Citation49-51 demonstrate the feasibility of this approach within the BM niche model. TEGs migrated towards the myeloma cells, and thereafter demonstrated a killing response. The presence of MSCs/EPCs did not greatly influence the OPM2 killing efficiency by the TEGs, possibly because OPM2 cells are no longer dependent on MSC derived signals. Since primary myeloma cells are dependent on MSCs for survival, their role in escape mechanisms for immunotherapy could not be investigated. This will require more detailed analysis of T cell-MSC interactions. The addition of the TEG therapy to 8 primary myeloma donors showed varying degrees of efficacy, results that are in line with an expected donor variability. Previous experiments also showed varying TEG responses to primary acute myeloid leukemia donors.Citation31 TEGs were also engineered from myeloma patients, and compared to the healthy donor TEGs, used as the standard treatment in our studies. No differences were observed in generation efficiency or killing response. The developed model also has the power to detect off-target toxicity within the 3D in vitro BM environment, which is a major safety concern in the context of cancer immunotherapies based on metabolic cancer targeting. Preferably this should be complemented with monitoring of off-target toxicity in other models and with careful clinical measurements.
In conclusion, the developed 3D BM niche model allows studying individual cells and cell populations, which can be followed in time using non-invasive time-lapse imaging and can be retrieved from the co-culture, making this system suitable for mechanistic evaluation, and also for automated screening of novel (chemo)therapeutic compounds. As such, this provides a tool to study the biology and interactions of primary myeloma cells within the engineered microenvironment, as well as the novel TEG mediated myeloma therapy within the context of the engineered BM niche. This model generates a potential solution for rapidly exploring new assets in terms of on- and off-targeting effects of novel therapies, as well as investigating mechanisms underlying therapy resistance.
Materials and methods
Primary tissue collection
BM was aspirated from the acetabulum of 3 otherwise healthy patients undergoing hip replacement surgery, or from the spina iliaca posterior superior of 13 myeloma patients. The demographics of all patients included in the study are detailed in . Umbilical cord blood was collected from 3 full term pregnancies. Peripheral blood mononuclear cells were obtained from Sanquin Blood bank (Amsterdam, the Netherlands). All samples were obtained after written informed consent, and protocols were approved by the local ethics committee of the University Medical Center Utrecht.
Cell lines and primary cells
Human myeloma cell lines OPM2, L363 and U266 were obtained from the American Type Culture Collection. CD138+ cell were isolated from the mononuclear cells (MNCs) of the myeloma BM by microbeads (Miltenyi Biotec, Germany), reaching an average purity of 88% ± 8% assessed by flow cytometry. All myeloma cells were cultured in advanced RPMI 1640 medium, 10% (v/v) fetal bovine serum (FBS), 2 mM of L-glutamine, 100 U/ml penicillin and 100 µg/ml streptomycin (all Gibco, ThermoFisher, USA). Multipotent mesenchymal stromal cells (MSCs) were isolated from healthy BM by adherence to tissue culture plastic and expanded in MSC-medium (α-minimal essential media (αMEM, Gibco, USA),10% (v/v) FBS, 0.2 mM L-ascorbic acid 2-phosphate, 100 U/ml penicillin and 100 µg/ml streptomycin). Endothelial progenitor cells (EPCs) were isolated from cord blood by density-gradient centrifugation of MNCs using Ficoll-paque, seeded on collagen I (BD Biosciences)-coated wells and expanded in EGM-2 medium (Lonza, Switzerland), SingleQuots™ Kit (Lonza, Switzerland), 10% (v/v) FBS, 100 U/ml penicillin and 100 µg/ml streptomycin. αβT cells from both healthy donors and myeloma patients were retrovirally transduced into TEGs with engineered T cell receptors (TCRs) using the Vγ9Vδ2-TCR clone G115Citation52 as described earlier.Citation28,Citation53 The transduced T cells were stimulated biweekly with 1 μg/ml PHA-L (Sigma-Aldrich, USA), 50 U/ml IL-2 (Novartis Pharma, Switzerland), 5 ng/ml IL-15 (R&D Systems, USA), and irradiated allogeneic PBMCs, Daudi and LCL-TM cell lines. Mock αβT cells were transduced with a non-functional γδTCR (γ9-G115LM1/δ2-G115 wt).Citation27 Transgenic TCR expression and purity of CD4+ populations were routinely assessed by flow cytometry.
Osteogenic and adipogenic differentiation
Osteogenic MSCs were grown in osteogenic medium (MSC-medium plus 10 nM dexamethasone and 10 mM β-glycerophosphate (both Sigma, USA)). Adipogenic MSCs were also grown in adipogenic medium (MSC-medium plus 0.2 mM indomethacin (Sigma), 0.5 mM 3-isobutyl-1-methylxanthine (IBMX, Sigma, USA), 1 µM dexamethasone and 1.72 µM human insulin (Sigma, USA)). All cells were differentiated for 14 days.
3D co-cultures
All 3D co-cultures were performed in growth factor-reduced Matrigel 50% (Corning, USA) diluted by an equal volume of MSC-medium. The various cell types were labelled using the Vybrant Multicolor Cell-Labeling Kit (DiO, DiI, DiD, ThermoFisher, USA). MSCs, EPCs and myeloma cells were mixed in a 4:1:1 ratio unless stated otherwise. After combining all cells, Matrigel 50% (v/v) was added to the cell pellet, resuspended and plugs of 50 µL were made. Medium was changed twice a week. TEGs embedded in Matrigel were added in equal numbers to the myeloma cells cultured.
Ratio optimization supporting cells: MSCs (DiO) of 3 donors were co-cultured with EPCs (DiI) of 3 donors at different ratios (6:1, 4:1, 2:1, 1:1) for 14 days. Images were taken with an Olympus BX60 fluorescence microscope. Images were analyzed using the Angiogenesis Analyzer, ImageJ 1.51 g.
Supporting cell type optimization: OPM2, L363 and U266 (DiI) were co-cultured as detailed in . Before read-out, calcein-AM (ThermoFisher, USA) was added. Images were taken with an Olympus BX60 fluorescence microscope. Three randomly chosen fields were analyzed using Adobe Photoshop CS6. The amount of fluorescence in each channel (number of pixels) was quantified and calculated to living cell numbers using reference samples.
Co-culture primary myeloma cells: CD138+ myeloma cells from 5 donors were cultured as detailed in . CD138+ myeloma cells were prelabeled with DiO and before read-out, ethidium-homodimer-1 (ThermoFisher, USA) was added. CD138+ myeloma cells from 4 other donors were cultured as detailed in . CD138+ myeloma cells were pre-labeled with DiI, EdU (Click-iT Plus EdU Alexa Fluor 488 Imaging Kit (ThermoFisher, USA)) was added in the medium. Before read-out, calcein-AM was added. Living cell numbers were determined as detailed above on day 1, 3, 7 and 14 or on day 1, 3, 7, 14, 21 and 28. For each time point, half of the cultures (n = 2) were used for live cell imaging, the other half (n = 2) were fixed and used for immunocytochemistry.
Co-culture myeloma cells and T cells: OPM2 cells (DiI) or CD138+ myeloma cells (DiI), MSCs and EPCs (DiO) were co-cultured in the ratio as detailed in . After 7 (OPM2) or 14 (CD138+ myeloma cells) days of culture, TEGs (DiD) or mock T cells (DiD) were layered on top of the cultured cells, embedded in 50% (v/v) Matrigel. Pamidronate (10 μM, Calbiochem, USA) was added to the medium. NucView 405 Caspase-3 Substrate (Biotium, USA) was added to identify apoptotic cells in the OPM2 co-cultures. To primary myeloma cells of 6 donors, an allogeneic TEG therapy and a mock T cell therapy was given. Primary myeloma cells of 2 donors were treated with an autologous TEG therapy, an allogeneic TEG therapy and a mock T cell therapy. The viability of the myeloma cells was analyzed at 0, 24 and 48 hours after T cell addition. Calcein-AM was added after 48 hours in the primary myeloma co-cultures. Images were taken with a Leica SP8X confocal microscope.
Immunocytochemistry
Co-cultured MSCs, EPCs and myeloma cells plugs were fixed overnight in 4% formaldehyde. The first 5 donors were stained for F-actin and DAPI (both FAK100 kit, Merck Millipore, USA) according to the manufactures protocol. The proliferation marker EdU was visualized in the samples of the next 4 donors, followed by DAPI (Click-iT Plus EdU Alexa Fluor 488 Imaging Kit, ThermoFisher, USA) for 30 min at RT. Images were taken with a Leica SP8X confocal microscope.
Confocal imaging
All confocal images were taken with a Leica SP8X Laser Scanning Confocal Microscope using a 405 nm or white light laser (470–670 nm) and Leica LASX acquisition software. Hybrid detectors collected fluorescence signal from DAPI (405/430–480), EdU-Alexa Fluor 488 (488/490–525), calcein (494/500–525), phalloidin-TRITC (532/540–575) or ethidium homodimer-1 (528/600–640) receptively, which were given pseudo colors. During all live imaging, hybrid detectors collected fluorescence signal from DiO (484/500–540), DiI (549/565–605) and DiD (644/665–705) which were given the pseudo colors green, yellow and cyan. All z-stack images were processed using ImageJ 1.51 h software to create single maximum projections. Images of the 3D cultures were taken using the mosaic function of the Leica LASX software, stitching the images together using smooth and linear blending.
SNP array analysis
Genomic DNA was isolated from CD138+ myeloma cells of 3 donors on day 0 and CD138+ myeloma cells plus supporting MSCs and EPCs on day 28 using the PureLink Genomic DNA Mini Kit (Invitrogen). SNP-array copy number profiling and analysis of regions of homozygosity were performed according to standard procedures using the Infinium CytoSNP-850K v1.1 BeadChip (Illumina, USA). Subsequently, visualizations of SNP-array results and data analysis were performed using Nexux Copy Number v8.0 software (BioDiscovery, USA). Human genome build Feb. 2009 GRCh37/hg19 was used.
Statistics
All experimental groups were performed in technical triplicates. Results are presented as mean ± standard deviation for the indicated number of donors. P values are based on a repeated measurements analysis of variance (2-way ANOVA) for multiple hypothesis using Dunnett's multi comparison post hoc test, or analysis of variance (1-way ANOVA) for multiple hypothesis testing using Tukey's honestly significant difference (HSD) post hoc test. Normality of the data was determined using a Normal Quantile Plot to test for non-normality (Q–Q plot). Data analysis was performed using Prism GraphPad Software and IBM SPSS Statistics version 22. In all tests, p values < 0.05 were considered statistically significant.; # = P < 0.05, ## = P < 0.01, ### = P < 0.001.
Disclosure of potential conflicts of interest
Prof. Kuball reports grants from Piere Fabre, Novartis, and Miltenyi Biotech. He is scientific co-founder and CSO of gadeta (www.gadeta.nl) and inventor on multiple patents on γδ TCR receptors and isolation strategies for engineered immune cells. All other authors declare no competing financial interests.
2017ONCOIMM0749R1-s02.docx
Download MS Word (3.4 MB)Acknowledgments
We are grateful to Gaby de Vries - Simons and Lars van der Veken (Department of Genetics, University Medical Center Utrecht, the Netherlands) for the SNP-array execution and SNP-array analyses respectively.
Additional information
Funding
Related Research Data
References
- Morrison SJ, Scadden DT. The bone marrow niche for haematopoietic stem cells. Nature. 2014;505:327–34. doi:10.1038/nature12984. PMID:24429631.
- Noll JE, Williams SA, Purton LE, Zannettino ACW. Tug of war in the haematopoietic stem cell niche: do myeloma plasma cells compete for the HSC niche? Blood Cancer J. 2012;2:e91. doi:10.1038/bcj.2012.38. PMID:22983434.
- Toscani D, Bolzoni M, Accardi F, Aversa F, Giuliani N. The osteoblastic niche in the context of multiple myeloma. Ann N Y Acad Sci. 2015;1335:45–62. doi:10.1111/nyas.12578. PMID:25424768.
- Nair JR, Rozanski CH, Lee KP. Under one roof: the bone marrow survival niche for multiple myeloma and normal plasma cells. Oncoimmunology. 2012;1:388–9. doi:10.4161/onci.18746. PMID:22737625.
- Sanderson RD, Epstein J. Myeloma bone disease. J Bone Miner Res. 2009;24:1783–8. doi:10.1359/jbmr.090901. PMID:19839769.
- Hideshima T, Mitsiades C, Tonon G, Richardson PG, Anderson KC. Understanding multiple myeloma pathogenesis in the bone marrow to identify new therapeutic targets. Nat Rev Cancer. 2007;7:585–98. doi:10.1038/nrc2189. PMID:17646864.
- Bianchi G, Munshi NC. Pathogenesis beyond the cancer clone(s) in multiple myeloma. Blood. 2015;125:3049–58. doi:10.1182/blood-2014-11-568881. PMID:25838343.
- Delgado-Calle J, Anderson J, Cregor MD, Hiasa M, Chirgwin JM, Carlesso N, Yoneda T, Mohammad KS, Plotkin LI, Roodman GD, et al. Bidirectional notch signaling and osteocyte-derived factors in the Bone Marrow microenvironment promote tumor cell proliferation and bone destruction in multiple Myeloma. Cancer Res. 2016;76:1089–100. doi:10.1158/0008-5472.CAN-15-1703. PMID:26833121.
- Schuler J, Ewerth D, Waldschmidt J, Wasch R, Engelhardt M. Preclinical models of multiple myeloma: a critical appraisal. Expert Opin Biol Ther. 2013;13(Suppl 1):S111–23. doi:10.1517/14712598.2013.799131. PMID:23742200.
- Gillet JP, Varma S, Gottesman MM. The clinical relevance of cancer cell lines. J Natl Cancer Inst. 2013;105:452–8. doi:10.1093/jnci/djt007. PMID:23434901.
- Lwin ST, Edwards CM, Silbermann R. Preclinical animal models of multiple myeloma. BoneKEy Rep. 2016;5:772. doi:10.1038/bonekey.2015.142. PMID:26909147.
- Libouban H. The use of animal models in multiple myeloma. Morphologie: bulletin de l'Association des anatomistes. 2015;99:63–72. doi:10.1016/j.morpho.2015.01.003. PMID:25898798.
- Ferrarini M, Steimberg N, Ponzoni M, Belloni D, Berenzi A, Girlanda S, Caligaris-Cappio F, Mazzoleni G, Ferrero E. Ex-Vivo Dynamic 3-D culture of human tissues in the RCCS (TM) bioreactor allows the study of multiple myeloma biology and response to therapy. PLoS ONE. 2013;8:e71613. doi:10.1371/annotation/d7d8e0a7-aa3d-4620-98e5-c5a7bbf31dc8.
- Reagan MR, Mishima Y, Glavey SV, Zhang Y, Manier S, Lu ZN, Memarzadeh M, Zhang Y, Sacco A, Aljawai Y, et al. Investigating osteogenic differentiation in multiple myeloma using a novel 3D bone marrow niche model. Blood. 2014;124:3250–9. doi:10.1182/blood-2014-02-558007. PMID:25205118.
- Zhang W, Gu Y, Sun Q, Siegel DS, Tolias P, Yang Z, Lee WY, Zilberberg J. Ex vivo maintenance of primary human multiple myeloma cells through the optimization of the osteoblastic niche. PLoS ONE. 2015;10:e0125995.
- Kirshner J, Thulien KJ, Martin LD, Marun CD, Reiman T, Belch AR, Pilarski LM. A unique three-dimensional model for evaluating the impact of therapy on multiple myeloma. Blood. 2008;112:2935–45. doi:10.1182/blood-2008-02-142430. PMID:18535198.
- Zdzisinska B, Rolinski J, Piersiak T, Kandefer-Szerszen M. A comparison of cytokine production in 2-dimensional and 3-dimensional cultures of bone marrow stromal cells of multiple myeloma patients in response to RPMI8226 myeloma cells. Folia histochemica et cytobiologica / Pol Acad Sci Pol Histochem Cytochemical Soc. 2009;47:69–74.
- de la Puente P, Muz B, Gilson RC, Azab F, Luderer M, King J, Achilefu S, Vij R, Azab AK. 3D tissue-engineered bone marrow as a novel model to study pathophysiology and drug resistance in multiple myeloma. Biomaterials. 2015;73:70–84. doi:10.1016/j.biomaterials.2015.09.017. PMID:26402156.
- Amini AR, Laurencin CT, Nukavarapu SP. Bone tissue engineering: recent advances and challenges. Crit Rev Biomed Eng. 2012;40:363–408. doi:10.1615/CritRevBiomedEng.v40.i5.10. PMID:23339648.
- Fedorovich NE, Wijnberg HM, Dhert WJ, Alblas J. Distinct tissue formation by heterogeneous printing of osteo- and endothelial progenitor cells. Tissue Eng Part A. 2011;17:2113–21. doi:10.1089/ten.tea.2011.0019. PMID:21513466.
- Fedorovich NE, Leeuwenburgh SC, van der Helm YJ, Alblas J, Dhert WJ. The osteoinductive potential of printable, cell-laden hydrogel-ceramic composites. J Biomed Mater Res Part A. 2012;100:2412–20.
- Loozen LD, Wegman F, Oner FC, Dhert WJA, Alblas J. Porous bioprinted constructs in BMP-2 non-viral gene therapy for bone tissue engineering. J Mater Chem B. 2013;1:6619–26. doi:10.1039/c3tb21093f.
- Jakubikova J, Cholujova D, Hideshima T, Gronesova P, Soltysova A, Harada T, Joo J, Kong SY, Szalat RE, Richardson PG, et al. A novel 3D mesenchymal stem cell model of the multiple myeloma bone marrow niche: biologic and clinical applications. Oncotarget. 2016;7:77326–41. doi:10.18632/oncotarget.12643. PMID:27764795.
- Bianchi G, Richardson PG, Anderson KC. Promising therapies in multiple myeloma. Blood. 2015;126:300–10. doi:10.1182/blood-2015-03-575365. PMID:26031917.
- Boussi L, Niesvizky R. Advances in immunotherapy in multiple myeloma. Curr Opin Oncol. 2017;29(6):460–466. doi:10.1097/CCO.0000000000000407. PMID:28877078.
- Scheper W, van Dorp S, Kersting S, Pietersma F, Lindemans C, Hol S, Heijhuurs S, Sebestyen Z, Gründer C, Marcu-Malina V, et al. gammadeltaT cells elicited by CMV reactivation after allo-SCT cross-recognize CMV and leukemia. Leukemia. 2013;27:1328–38. doi:10.1038/leu.2012.374. PMID:23277330.
- Grunder C, van Dorp S, Hol S, Drent E, Straetemans T, Heijhuurs S, Scholten K, Scheper W, Sebestyen Z, Martens A, et al. gamma9 and delta2CDR3 domains regulate functional avidity of T cells harboring gamma9delta2TCRs. Blood. 2012;120:5153–62. doi:10.1182/blood-2012-05-432427. PMID:23018643.
- Marcu-Malina V, Heijhuurs S, van Buuren M, Hartkamp L, Strand S, Sebestyen Z, Scholten K, Martens A, Kuball J. Redirecting alphabeta T cells against cancer cells by transfer of a broadly tumor-reactive gammadeltaT-cell receptor. Blood. 2011;118:50–9. doi:10.1182/blood-2010-12-325993. PMID:21566093.
- Sebestyen Z, Scheper W, Vyborova A, Gu S, Rychnavska Z, Schiffler M, Cleven A, Chéneau C, van Noorden M, Peigné CM, et al. RhoB Mediates Phosphoantigen Recognition by Vgamma9Vdelta2 T Cell Receptor. Cell Rep. 2016;15:1973–85. doi:10.1016/j.celrep.2016.04.081. PMID:27210746.
- Scheper W, Sebestyen Z, Kuball J. Cancer immunotherapy using gamma delta T cells: dealing with diversity. Front Immunol. 2014;5:601. doi:10.3389/fimmu.2014.00601. PMID:25477886.
- Straetemans T, Grunder C, Heijhuurs S, Hol S, Slaper-Cortenbach I, Bonig H, Sebestyen Z, Kuball J. Untouched GMP-ready purified engineered immune cells to treat cancer. Clin Cancer Res. 2015;21:3957–68. doi:10.1158/1078-0432.CCR-14-2860. PMID:25991821.
- Gawlitta D, Fledderus JO, van Rijen MHP, Dokter I, Alblas J, Verhaar MC, Dhert WJ. Hypoxia impedes vasculogenesis of in vitro engineered bone. Tissue Eng Pt A. 2012;18:208–18. doi:10.1089/ten.tea.2010.0731.
- Lopez-Corral L, Sarasquete ME, Bea S, Garcia-Sanz R, Mateos MV, Corchete LA, Sayagués JM, García EM, Bladé J, Oriol A, et al. SNP-based mapping arrays reveal high genomic complexity in monoclonal gammopathies, from MGUS to myeloma status. Leukemia. 2012;26:2521–9. doi:10.1038/leu.2012.128. PMID:22565645.
- Schuessler TK, Chan XY, Chen HJ, Ji K, Park KM, Roshan-Ghias A, Sethi P, Thakur A, Tian X, Villasante A, et al. Biomimetic tissue-engineered systems for advancing cancer research: NCI strategic workshop report. Cancer Res. 2014;74:5359–63. doi:10.1158/0008-5472.CAN-14-1706. PMID:25095784.
- Zhang W, Lee WY, Siegel DS, Tolias P, Zilberberg J. Patient-specific 3D microfluidic tissue model for multiple myeloma. Tissue Eng Part C Methods. 2014;20(8):663–70. doi:10.1089/ten.TEC.2013.0490.
- Koike N, Fukumura D, Gralla O, Au P, Schechner JS, Jain RK. Tissue engineering: creation of long-lasting blood vessels. Nature. 2004;428:138–9. doi:10.1038/428138a. PMID:15014486.
- Jakob C, Sterz J, Zavrski I, Heider U, Kleeberg L, Fleissner C, Kaiser M, Sezer O. Angiogenesis in multiple myeloma. Eur J Cancer. 2006;42:1581–90. doi:10.1016/j.ejca.2006.02.017. PMID:16797965.
- Narbona-Carceles J, Vaquero J, Suarez-Sancho S, Forriol F, Fernandez-Santos ME. Bone marrow mesenchymal stem cell aspirates from alternative sources: is the knee as good as the iliac crest? Injury. 2014;45(Suppl 4):S42–7. doi:10.1016/S0020-1383(14)70009-9. PMID:25384474.
- Via AG, Frizziero A, Oliva F. Biological properties of mesenchymal Stem Cells from different sources. Muscles Ligaments Tendons J. 2012;2:154–62. PMID:23738292.
- Corre J, Mahtouk K, Attal M, Gadelorge M, Huynh A, Fleury-Cappellesso S, Danho C, Laharrague P, Klein B, Rème T, et al. Bone marrow mesenchymal stem cells are abnormal in multiple myeloma. Leukemia. 2007;21:1079–88. doi:10.1038/sj.leu.2404621. PMID:17344918.
- Vacca A, Ria R, Semeraro F, Merchionne F, Coluccia M, Boccarelli A, Scavelli C, Nico B, Gernone A, Battelli F, et al. Endothelial cells in the bone marrow of patients with multiple myeloma. Blood. 2003;102:3340–8. doi:10.1182/blood-2003-04-1338. PMID:12855563.
- Reagan MR, Ghobrial IM. Multiple myeloma mesenchymal stem cells: characterization, origin, and tumor-promoting effects. Clin Cancer Res. 2012;18:342–9. doi:10.1158/1078-0432.CCR-11-2212. PMID:22065077.
- Roodman GD. Pathogenesis of myeloma bone disease. Leukemia. 2009;23:435–41. doi:10.1038/leu.2008.336. PMID:19039321.
- Andersen TL, Soe K, Sondergaard TE, Plesner T, Delaisse JM. Myeloma cell-induced disruption of bone remodelling compartments leads to osteolytic lesions and generation of osteoclast-myeloma hybrid cells. Br J Haematol. 2010;148:551–61. doi:10.1111/j.1365-2141.2009.07980.x. PMID:19919653.
- Boyle EM, Davies FE, Leleu X, Morgan GJ. Understanding the multiple biological aspects leading to myeloma. Haematologica. 2014;99:605–12. doi:10.3324/haematol.2013.097907. PMID:24688108.
- Hughes V. Microenvironment: neighbourhood watch. Nature. 2011;480:S48–9. doi:10.1038/480S48a. PMID:22169803.
- Hecht M, Heider U, Kaiser M, von Metzler I, Sterz J, Sezer O. Osteoblasts promote migration and invasion of myeloma cells through upregulation of matrix metalloproteinases, urokinase plasminogen activator, hepatocyte growth factor and activation of p38 MAPK. Br J Haematol. 2007;138:446–58. doi:10.1111/j.1365-2141.2007.06665.x. PMID:17593251.
- Corthay A, Skovseth DK, Lundin KU, Rosjo E, Omholt H, Hofgaard PO, Haraldsen G, Bogen B. Primary antitumor immune response mediated by CD4+ T cells. Immunity. 2005;22:371–83. doi:10.1016/j.immuni.2005.02.003. PMID:15780993.
- Kabelitz D, Wesch D, He W. Perspectives of gammadelta T cells in tumor immunology. Cancer Res. 2007;67:5–8. doi:10.1158/0008-5472.CAN-06-3069. PMID:17210676.
- Fisher JP, Heuijerjans J, Yan M, Gustafsson K, Anderson J. gammadelta T cells for cancer immunotherapy: a systematic review of clinical trials. Oncoimmunology. 2014;3:e27572. doi:10.4161/onci.27572. PMID:24734216.
- Kocoglu M, Badros A. The role of immunotherapy in multiple Myeloma. Pharmaceuticals (Basel). 2016;9:3. doi:10.3390/ph9010003. PMID:26784207.
- Allison TJ, Winter CC, Fournie JJ, Bonneville M, Garboczi DN. Structure of a human gammadelta T-cell antigen receptor. Nature. 2001;411:820–4. doi:10.1038/35081115. PMID:11459064.
- Stanislawski T, Voss RH, Lotz C, Sadovnikova E, Willemsen RA, Kuball J, Ruppert T, Bolhuis RL, Melief CJ, Huber C, et al. Circumventing tolerance to a human MDM2-derived tumor antigen by TCR gene transfer. Nat Immunol. 2001;2:962–70. doi:10.1038/ni1001-962. PMID:11577350.