
ABSTRACT
Cancer-associated fibroblasts (CAFs) are involved in the proliferative and invasive behavior of colorectal cancer (CRC). Nonetheless, CAFs represent a heterogeneous population with both cancer-promoting and cancer-restraining actions, lacking specific markers to target them. Expression of the immune checkpoint molecule CD70 is normally limited to cells of the lymphoid lineage. Instead, tumor cells hijack CD70 to facilitate immune evasion by increasing the amount of suppressive regulatory T cells (Tregs). The aim of this study was to explore CD70 expression patterns in CRC, not merely focusing on the tumor cells, but also taking the tumor stromal cells into account. We have analyzed the prognostic value of CD70 expression by immunohistochemistry in CRC specimens and its relationship with well-known fibroblast markers and Tregs. In addition, in vitro experiments were conducted to unravel the role of CD70-positive CAFs on migration and immune escape. We reveal prominent expression of CD70 on a specific subset of CAFs in invasive CRC specimens. Cancer cells show almost no expression of CD70. The presence of CD70-positive CAFs proved to be an independent adverse prognostic marker. Functionally, CD70-positive CAFs stimulated migration and significantly increased the frequency of naturally occurring Tregs. In conclusion, we have identified the expression of CD70 on CAFs as a novel prognostic marker for CRC. We have found evidence of a cross talk between CD70+ CAFs and naturally occurring Tregs, paving the way towards immune escape. As such, this study provides a strong rationale for the exploration of CD70-targeting antibodies in CRC.
Introduction
Colorectal cancer (CRC) is the fourth leading cause of cancer-related deaths, mainly due to the development of metastases in liver and lung, with a median survival of 2 years.Citation1,Citation2 Cancer progression and metastasis is controlled by the tumor microenvironment (TME) and does not depend solely on cancer cells. A dominant component of this TME are the cancer associated fibroblasts (CAFs), residing within the tumor margins or infiltrating the tumor mass and contributing to tumor progression by invasion, angiogenesis and manipulation of the immune response.Citation3-Citation6 On the other hand, the pro-tumorigenic role of CAFs in cancer progression has recently been challenged as depletion of CAFs by its general marker, α-smooth muscle actin (αSMA), led to more invasive tumors, associated with an immunosuppressive T-cell response.Citation7-Citation9 This heterogeneity of CAFs raises the question whether we can identify distinct subsets of pro-tumorigenic CAFs for developing stromal cell targeted therapies.Citation10
Immune checkpoint inhibitors targeting the cytotoxic T-lymphocyte associated protein-4 (CTLA-4) and programmed cell death-1 (PD-1) receptors have recently made their way into the clinic, producing substantial clinical benefits. Considering advanced colorectal cancer, the early signals of activity are largely involving microsatellite instable (MSI) tumors.Citation11,Citation12 Unfortunately, this still leaves a great need for effective immunotherapies in the majority of CRC. Here, we focused on the immune checkpoint molecule CD70 as a potential new target in CRC. Under normal conditions, CD70, member of the tumor necrosis factor (TNF) family, is only transiently expressed on activated T and B cells. Instead, constitutive overexpression of CD70 has been described on malignant cells in a range of solid and haematological malignancies.Citation13 In addition, CD70 expression has been occasionally shown on certain non-immunological stromal cells.Citation14 Through its receptor, CD27, the overexpression of CD70 can facilitate evasion of the immune system by three important mechanisms: induction of T cell apoptosis, T cell exhaustion and increasing the amount of suppressive regulatory T cells (Tregs).Citation13,Citation15
In the present study, we are the first to display the expression patterns of CD70 in CRC specimens. We report that CD70 expression is almost absent from tumor cells but is strongly present on a subset of CAFs. Moreover, CD70+ CAFs play an important role as predictors for the outcome of CRC patients. Finally, our results implicate a role of CD70+ CAFs in cancer cell migration and Treg accumulation, designating CD70+ CAFs as a potential new tool in anti-cancer treatment.
Results
CD70 expression and association with clinicopathological parameters
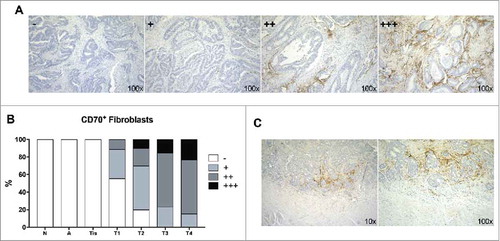
Immunohistochemical (IHC) analysis was performed to evaluate CD70 protein expression in 51 CRC tumor samples, 9 adenoma samples and 7 healthy colon specimens (Table S1). We found no expression of CD70 on adenoma samples and normal colon tissue. Expression of CD70 on the tumor cells could only be detected in a small subset of malignant cells in 3.9% of CRC samples. Instead, CD70 appeared to be highly abundant on CAFs in the TME of invasive cancer specimens. CD70 expression on CAFs was scored as 1+ in 13 (25.5%), 2+ in 19 (37.3%) and 3+ in 6 (11.8%) tumor specimens, as demonstrated in . Thereby no CD70-positive CAFs were found in normal tissue, adenoma or in situ carcinoma (Tis). As demonstrated in , almost all invasive tumor specimens showed CD70-positive CAFs with 84.6% of specimens staining positive (>10% CD70+ CAFs) in T4NxMx stages. This could also be demonstrated when biopsies from various disease stages of the same patient were tested for the expression of CD70 (N = 6). Here, CAFs showed increased positivity of CD70 with increasing TNM classification (Table S2). Finally, CD70-expression could always be shown adjacent to the tumor cells and appeared to be more present at the invasive margin of the tumor ().
Figure 1. CD70 expression determined by immunohistochemistry. A: Representative samples of the various categories of CD70 expression, graded as - (<1%), 1+ (1–10%), 2+ (11–50%), 3+ (>50%); B: Graph displaying the expression of CD70 in normal (N), adenoma (A), in situ carcinoma (Tis) and invasive (T1-T4) CRC specimens; C: CD70 expression at the invasive front of the tumor. Magnitude is depicted at the bottom right.
To explore clinical relevance of CD70-expressing CAFs in CRC, associations between clinicopathological characteristics and stromal CD70 expression were analysed in all patients. Thereby, CD70 was divided into a low (≤10% CD70+CAFs) (grade 0 and 1+) and high (>10% CD70+CAFs) (grade 2+ and 3+) positive group. As described in , stromal CD70 expression showed a significant association with strong tumor invasiveness (P<0.001), nodal invasion (P = 0.006), clinical stage (P = 0.001) and the presence of liver metastasis (P = 0.009). In addition, CD70 expression was mostly seen in association with moderate desmoplastic reactions (P = 0.005). We did not find any association between the CD70 expression level and MSI-status of the tumor.
Table 1. Association of CD70 expression with clinicopathological parameters.
Characterization of CD70-positive CAFs
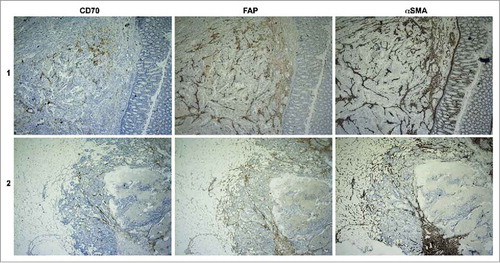
To confirm the expression of CD70 on CAFs and to distinguish the CD70+ CAFs from other known subsets of CAFs, we examined the expression of αSMA and Fibroblast-activation protein α (FAP) in 5 CRC specimens with negative (−), low (1+) and moderate (2+) CD70-positivity. As displayed in and Table S3, high scoring (>50%, 3+) of αSMA and FAP was found in all biopsies, pointing towards the presence of CAFs. On the other hand, CD70 characterized a specific subset within the αSMA+FAP+ CAFs.
Figure 2. Distribution of CD70, FAP and αSMA expression on CRC specimens. Representative IHC pictures of CD70, FAP and αSMA expression on serial cuts of one tissue sample from 2 different patients. Magnitude is 40x.
Association of CD4 and tregs with clinicopathological parameters
Forty-four samples were available for the detection of CD4 and Tregs (CD4+FOXP3+). CD4 was scored as 0 in 8 (18.2%), 1+ in 6 (13.6%), 2+ in 22 (50.0%) and 3+ in 8 (18.2%) tumor specimens. No associations were found between the presence of CD4+ T cells and gender, age, tumor invasion, nodal invasion, tumor location, clinical stage, differentiation or metastasis. Tregs were scored as 0 in 9 (20.5%), 1+ in 6 (13.6%) and 2+ in 29 (65.9%) of tumor specimens. No association of Tregs with gender, age, tumor invasion, nodal invasion, tumor location or differentiation were found. However, a weak association was seen with metastasis (P = 0.084), whereby presence of metastasis was associated with elevated amounts of Tregs in the primary resection specimens. In addition, high Treg scoring was associated with stage II-IV as compared to stage I (P = 0.005) patients and progressive disease (P = 0.044).
Association of CD70 expression with tregs
We found a significant association between high Treg amounts and high (2+, 3+) CD70 staining (P = 0.002, correlation coefficient (R) = 0.45), whereby the highest scoring grade for Tregs was detected in 86.6% of CD70high specimens (). In addition, we were able to compare the extent of Treg infiltration within CD70high versus CD70low regions in the same specimen of 31 patients. In 45.2% of cases, an increased grade of Treg scoring could be observed in the presence of CD70high regions. Identical Treg patterns between CD70low and CD70high regions were seen in 48.4% of cases. The remaining 6.5% displayed a lower scoring of Tregs in CD70high regions.
Correlations between CD70, tregs, and survival
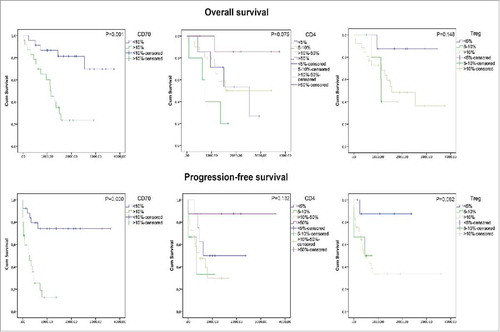
Follow-up data were available for all CRC patients. Twenty-one (41%) patients died during the follow-up period and 25 (49%) patients showed disease progression after a mean follow-up of 171 months. Kaplan Meier analysis was used to assess overall survival (OS) and progression-free survival (PFS) probability for CD70, CD4 and Tregs (). The mean OS was reduced from 3057 ± 273 days in the CD70low group to 1344 ± 213 days in the CD70high group. As such, CD70 expression was a significant predictor of worse OS (P = 0.001). Similarly, CD70 correlated with reduced PFS (P<0.001). No statistically significant difference in OS and PFS was observed with CD4, although high CD4 scoring showed a trend towards prolonged OS (P = 0.075). In contrast, Tregs, marked by coexpression of CD4 and FoxP3, showed a trend towards decreased survival (P = 0.082). Interestingly, CRC patients with high infiltration of CD70+ CAFs in combination with high grading of Tregs showed a significantly shorter PFS time compared to patients with either high Treg scoring, CD70-positive CAFs or none of these factors (P = 0.019). In addition to univariate analysis, we fitted a cox proportional hazard model with CD70 as predictor for OS and accounting for potential confounders including age, gender, differentiation, tumor location, metastasis, stage, desmoplasia, Tregs and MSI status (). Stepwise backward model building showed that CD70 expression (Hazard ratio (HR): 4.585; 95% confidence interval (CI): 1.008-20.853; P = 0.049) and tumor location (HR: 4.626; 95% CI: 1.304–16.142; P = 0.018) acted as significant, independent predictors for OS. Similarly, a cox model was fitted with CD70 as predictor for PFS whereby stepwise backward modelling showed that only CD70 (HR: 3.282; 95% CI: 1.061–10.148; P = 0.039) and metastasis (HR: 3.887; 95% CI: 1.446–10.448; P = 0.007) acted as significant independent predictors for PFS.
Table 2. Independent predictors of overall survival and progression-free survival (Multivariate Cox Regression model).
Figure 3. Kaplan-Meier curves for overall survival and progression-free survival. P-values are depicted at the top right.
Effect of CD70-expressing CAFs on tregs
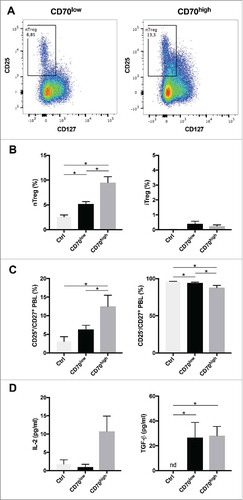
Tregs are key cells contributing to an immune suppressive tumor microenvironment of CRC. Our IHC results revealed a significant association between high CD4+FoxP3+ cell amounts and the presence of CD70-positive CAFs in the tumor microenvironment. To analyse the effect of CD70 on Tregs in more detail, CD70high or CD70low CAFs were co-cultured with CD4+ T cells for 7 days. Afterwards, nTreg (CD4+CD25+CD127low) and iTreg (CD4+CD25−TGF-β+IL-10+) amounts were determined by flow cytometry. The presence of CD70high CAFs significantly increased the frequency of nTregs when compared with CD70low CAFs (9.92 ± 1.1% vs 5.52 ± 0.63% nTregs) (). Thereby, nearly double amounts of nTregs could be detected in co-cultures with CD70high CAFs compared to CD70low CAFs. No differences in CD27+ T cell amounts was observed but a significant shift from CD25− cells to CD25+ positive cells could be detected in the CD27+ T-cell subset in the presence of CD70high CAFs (). In contrast, we observed no differences in the frequency of iTregs, regardless of the CAF's CD70 positivity (0.08 ± 0.0% (CD70high) vs 0.04 ± 0.06% (CD70low) nTregs) (). CD27 signalling has been shown to increase Interleukin-2 (lL-2) secretion and IL-2 is a crucial growth survival factor for nTregs.Citation16 Therefore, we have analysed the IL-2 protein levels and found a strong increase in IL-2 protein levels when CD70high CAFs were present (). We have found no difference in TGF-ß production. In conclusion, our results suggest an immune evasive effect of CD70high CAFs by increasing the survival of nTregs.
Figure 4. Role of CD70-positive CAFs on regulatory T cell accumulation. CT5.3 hTERT CAFs were sorted on the membrane expression of CD70 (see also Fig. S1). CD3+CD4+ T-cells were cultured alone (Ctrl) or co-cultured with CD70pos/CD70neg CAFs for 7 days. Afterwards, lymphocytes were analysed with a multicolour panel on a BD FACSAria II system (see also Fig. S2 for gating strategy). A: Representative dot plots showing the percentage of naturally occurring Tregs (nTregs) (CD3+CD4+CD25+CD127low) after 7 days of co-culturing with CD70low (left) or CD70high (right) CAFs; B: Percentage nTregs (left) within CD4+ T-cell subset and induced Tregs (iTreg) (right) within CD4+CD25− T-cell subset; C: Percentage CD25+ (left) and CD25− (right) cells within CD27+ T cells. D: IL-2 (left) and TGF-ß (right) protein levels in supernatants, 5 days after (co-)culture. Experiments were run in parallel with CD4+ T-cells from four different donors. *P < 0.05. Bars represent the mean ± SEM. nd, not detected.
Role of CD70-positive CAFs in migration
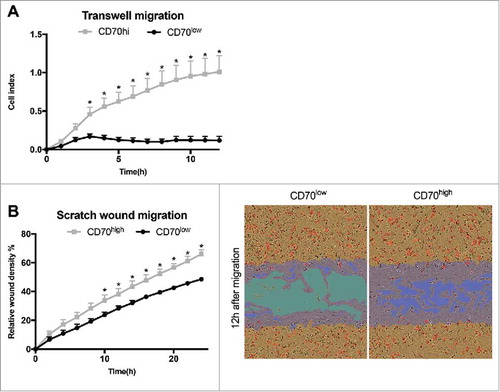
The aforementioned presence of CD70-positive CAFs at the invasive margin of the tumor suggests a role of these CAFs in cancer cell migration. We analysed the migratory capacities of CD70high and CD70low CAFs by real-time analysis of Transwell migration. Twelve hours after initiation, we observed an 8.7-fold increase in migration of the CD70high CAFs compared to its CD70low counterpart (). In a next set of experiments, CD70high and CD70low CAFs were co-cultured with CRC cells and subjected to scratch wound migration. Interestingly, CRC cells alone were not capable of spontaneously migrating towards the gap (data not shown). Instead, CAFs showed strong migratory capacities. We revealed a significant increase in migration of the CD70high CAFs with a relative wound density of 66.03 ± 3.08% compared to 28.33 ± 1.72% for the CD70low CAFs (P<0.05), 12 h after wound initiation (). In summary, these data indicate the strong migratory capabilities of CD70high CAFs.
Figure 5. Role of CD70-positive CAFs on migration. CT5.3 hTERT CAFs were sorted on the membrane expression of CD70 and assessed for migratory capacity in real-time. A: Graph represents the time-dependent migratory pattern of CD70high or CD70low CAFs detected by Transwell experiments using xCELLigence RTCA system. Graph represents net chemoattraction after subtraction of random migration signal; B: CD70high or CD70low CAFs were co-cultured with HCT116 (represented by pictures) or HT29 (represented by graph) and followed in real-time during wound closure using the Incucyte ZOOM LiveCell Imaging System; Left: Graph represents the relative wound density of CD70high or CD70low CAFs as a function of time for migration. Bars represent the mean ± SEM of 3 experiments. *P < 0.05; Right: Representative images of migration (12 h). Confluence mask (orange); initial wound mask (blue); CRC cells (red).
Discussion
Numerous studies indicate that tumor progression and invasiveness are determined not only by the malignant cancer cells themselves, but also by the surrounding tumor microenvironment. We are the first study to demonstrate the expression of the immune checkpoint molecule CD70 on CAFs. Moreover, we have found that CAF CD70-positivity was significantly associated with poor clinicopathological parameters and served as an independent prognostic marker in CRC. Finally, we revealed the potential role of CD70-positive CAFs in immune escape by the accumulation of naturally occurring Tregs and their increased migratory capacities.
Over the past years, the discovery of immune checkpoint receptors such as CTLA-4 and PD-1 introduced a new, exciting era in cancer immunotherapy. Moreover, accumulating clinical evidence points toward a promising role for checkpoint blocking antibodies in a rapidly expanding spectrum of solid tumors.Citation17-Citation20 However, immunotherapy in human CRC is limited to a small subset of patients with MSI-positive tumors.Citation21,Citation22 The rationale behind this observation might be the dense immune infiltrate in MSI tumors due to the increased antigenicity as well as the expression of targetable immune checkpoints such as PDL-1.Citation21,Citation23,Citation24 However, there also could be alternative mechanisms underlying this difference in responsiveness between MSI and MSS, such as the predominance of tumor stroma in the latter.Citation25 Therefore, in this report, we have not merely focused on the expression of immune checkpoint molecules by cancer cells but also taken the tumor stroma into account. Unexpectedly, CD70 overexpression could only be strongly detected on the CAFs. Moreover, CD70 expression on CAFs acted as an independent predictor for shorter OS and PFS. In addition, CD70-positivity was correlated with adverse clinicopathological parameters and displayed no association with MSI-status, highlighting the potential of this target in CRC subsets that do not benefit from immune checkpoint blockade.
The role of wound healing-associated fibroblasts is well understood, but the functional role of CAFs in cancer progression and metastasis is emerging as being complex and bimodal with both cancer-promoting and cancer-restraining actions.Citation26 For example, genetic depletion of proliferating CAFs, identified through its marker αSMA, gave rise to more aggressive tumors with suppressed immune surveillance and increased CD4+Foxp3+ Tregs in pancreatic mice models.Citation8 On the contrary, therapeutics directed to FAP appeared more effective as ablation of FAP+ stromal cells inhibited tumor growth in several cancer models. However, the importance of FAP-positive cells in the maintenance of normal muscle mass, lymph node homeostasis, and haematopoiesis makes it challenging to use FAP as a future therapeutic target.Citation26,Citation27 In our series, we found the expression of αSMA as well as FAP in nearly all CAFs. On the other hand, CD70 marked a distinct subset of CAFs within these dual positive CAFs. We could also demonstrate a substantial increase in migratory capacities within CD70high CAFs supporting our IHC data on the role of CD70 in tumor progression. Although we are the first to describe this effect by CD70-positive CAFs, CD70 overexpression on tumor cells has already been linked with migration in non-small cell lung cancer, melanoma and glioblastoma.Citation28-Citation30 In the latter, knockdown of the CD70 gene resulted in a decrease in genes associated with tumor epithelial-mesenchymal transition (EMT) such as CD44 and SOX2. Also in CRC, overexpression of CD44 has been shown to drive EMT changes.Citation31,Citation32 One other possible mechanism of action is the activation of CD70. Recently, it has been described that CD70 is not only a ligand but contains an underlying signalling cascade whereby activation leads to MAPK activation, RhoE overexpression and cytoskeletal changes, driving migration in melanoma.Citation29
It has been demonstrated that targeting the CD70/CD27 axis can inhibit an effective anti-tumor immune response by three modes of action: accumulation of Tregs, T-cell apoptosis and skewing T-cell towards T-cell exhaustion.Citation13 Increased numbers of Tregs have been particularly found in the presence of CD70-expressing tumor cells due the expression of CD27 on the Tregs.Citation13,Citation33,Citation34 The interaction of CD70 and CD27 even promoted tumor growth in solid tumor-bearing mice by a decrease in Treg apoptosis and the production of IL-2, a key player in Treg survival.Citation15 In support of this view, we detected a significant association between high CD70-scoring and increased CD4+FOXp3+ T cell amounts in primary CRC specimens. However, this present study is the first to reveal such a crosstalk with Tregs by the presence of CD70 on the CAFs instead of the cancer cells. Tregs are associated with decreased survival in a variety of malignancies and elevated proportions are typically associated with unfavourable outcome.Citation35-Citation37 Yet, in CRC, the role of Tregs is ambiguous as high densities of tumor-infiltrating Tregs in CRC patients are reported to be correlated with both worse and better outcomes (reviewed inCitation38). One important reason for these discrepancies are the presence of functionally distinct subpopulations of Tregs with different levels of immune suppression in the TME.Citation38-Citation40 Jafarinia et al. recently demonstrated that not all FoxP3+ cells can be considered as functional Tregs. CD25−FoxP3+ cells in CRC patients showed lower suppressive and higher effector properties in comparison to the CD4+CD25+ FoxP3+ nTregs.Citation41 Moreover, evidence accumulates that IL-10, produced by these CD25− Tregs, plays a pivotal role in preventing inflammation and hereditary colon cancer.Citation38 Instead, nTregs, isolated from PBMC of CRC patients, were capable of inhibiting anti-tumor immune responses.Citation42 We demonstrated that the presence of CD70-positive CAFs nearly doubled the proportion of nTregs amounts when co-cultured with CD4+ T-cells. In contrast, we did not find such effect on CD25− Tregs. Additionally, we observed a significant shift within the CD27+ T-cell subset from CD25− towards CD25+ regulatory T cells in the presence of CD70high CAFs and an enhanced production of IL-2, crucial for Treg survival. Recent studies have demonstrated that CD27 expression on CD25+ Tregs positively correlates with their suppressive activity in vitro and with the expression of FoxP3.Citation43,Citation44 Consequently, our data strongly suggest a role of the CD70pos CAFs in immune escape by the accumulation of nTregs.
Although we believe that blocking the CD70/CD27 interaction can release the effect of CD70-positive CAFs on the immune system, we don't presume this hold true for its other pro-tumorigenic effects. Moreover, in our experiments, CD70-positive CAFs showed increased migratory capacities without the presence of CD27. Several antibodies targeting CD70 are being evaluated in clinical trials and can therefore also be beneficial to deplete CD70+ CAFs. Thereof, SGN-CD70A and MDX-1203 are antibody-drug conjugates that rely upon internalization for a toxin to exert its anti-tumor function.Citation45,Citation46 On the other hand, ARGX-110 is an anti-CD70 antibody with a complement-dependent cytotoxicity, antibody-dependent cellular cytotoxicity and antibody-dependent cellular phagocytosis activity with no need for internalization, providing extra dimensions to the anti-tumor effect.Citation47
Our findings clearly show an important role for CD70-positive CAFs as predictors for the outcome of CRC patients. Furthermore, our data suggest a function of CD70 in immune escape by the accumulation of nTregs and display increased pro-migratory capacities of CD70high CAFs. These results demonstrate that targeting CD70 holds great potential in CRC, especially in light of the limited immunotherapeutic options available in MSS colorectal cancer.
Material and methods
Patient selection and tissue specimens
Fifty-one formalin-fixed paraffin embedded (FFPE) specimens (Biobank@UZA, Antwerp, Belgium; ID: BE 71030031000) were collected from CRC patients, of which the main characteristics are described in Table S1.Citation48 In addition, 9 adenoma samples and 7 healthy colon specimens were available. The average age (±SD) of the patients included in this study was 66 ± 11 years (age range 36 to 85 years). This study was approved by the Ethics Committee of the Antwerp University Hospital. A written informed consent from all patients regarding tissue sampling has been obtained.
Immunohistochemistry
Protein expression
Tissue sections were prepared as previously described.Citation33 MSI status was determined by 4 primary monoclonal antibodies: anti-MLH1 (clone ES05, RTU, DAKO), anti-MSH2 (clone FE11, RTU, DAKO), anti-MSH6 (clone EP49, RTU, DAKO) and anti-PMS2 (clone EP51, RTU, DAKO) incubated at RT for 30 min followed by the Envision FLEX+ detection kit (DAKO) on a DAKO autostainer Link 48 instrument. The expression of αSMA (1A4, RTU, Dako) and CD70 (clone 301731, diluted 1:40, R&D systems) was assessed by incubation at RT for 20 min and visualized as formerly described.Citation33 For CD70 and PMS2, an additional step was included after antibody incubation using an enhanced polymer-based linker (30 min, RT, DAKO). To evaluate FAP (EPR20021, 1:250, Abcam) and Tregs, dual staining of CD4 (SP35, RTU, Roche) and FOXP3 (clone 236 A/E7, 1:50, Abcam), antibodies were engaged for 36 min by the ultraView DAB detection kit (Roche) and/or ultraView universal alkaline phosphatase detection kit (Roche) on a Ventana BenchMark ULTRA (Roche). Sections were counterstained with haematoxylin, dehydrated and mounted. Positive controls and negative controls, consisting of tonsil tissue, were included in each staining run. Furthermore, biopsies were checked for internal positive controls.
Scoring
For MSI analysis, loss of protein expression was scored as absence of nuclear staining in tumor cells despite nuclear staining in proliferating cells in normal crypts and stroma. Stromal staining of CD70, αSMA and FAP was assessed as 0, 1+, 2+ and 3+ as previously described.Citation49 Grade 0 was defined as the near absence of expression in <1% of the CAFs; grade 1+ was positivity in 1%–10% of stromal cells; grade 2+ was described when 11% to 50% of stromal cells showed positivity; grade 3+ was positive immunostaining in >50% of stromal cells. In addition, positive staining of CD70 on the tumor cells was assigned when at least 10% of the tumor cells showed specific CD70 staining of any intensity and any distribution (membranous, cytoplasmic). Ten percent was chosen based on inclusion criteria for Phase 1 clinical trials using CD70-targeting antibodies.Citation50 For CD4 staining, the percentage positive immune cells were scored 0 to 3+ (<5%, 5–10%, 11–50%, >50% of immune cells stained). Tregs were divided into 3 groups (<5%, 5–10%, >10% of immune cells stained). Scoring was performed by an independent observer as well as two experienced pathologists (PP/VS). Prior analysis, the positive internal control (or if lacking, an additional external positive run control) was assessed.
Cell lines and cell culture
CAFs were isolated from primary CRC tumors and immortalized through hTERT (CT5.3-hTERT).Citation51 HT29 and HCT116 CRC cells were purchased from ATCC. Cells were cultured in DMEM supplemented with 10% foetal bovine serum (FBS), 1% penicillin/streptomycin and 1% L-glutamine (Life Technologies), grown as monolayers and maintained in exponential growth at 5% CO2/95% air in a humidified incubator at 37°C. Cell cultures were regularly tested for absence of mycoplasma using the Mycoalert® Mycoplasma detection kit (Lonza). To examine specific effects of CD70-expressing CAFs, CT5.3 hTERT cells were sorted using a PE-conjugated anti-human CD70 antibody (Clone Ki-24, Becton Dickinson) on a BD FACSAria II (Becton Dickinson) and analysed using FlowJo v10.1 software (FlowJo LLC) (Fig. S1). CRC cells showed no expression of CD70 by flow cytometry. Characterization of primary CAFs (unsorted, CD70high CAFs and CD70low CAFs) was performed by examination of Vimentin, Desmin and αSMA expression using an IHC staining protocol as described before with minor modifications.Citation52
In vitro tregs assay
Peripheral blood mononuclear cells (PBMC) were obtained by Ficoll-paque gradient separation from buffy coats (Blood transfusion centre) of 4 different donors. CD4+ T cells were directly isolated by immunomagnetic bead selection (Miltenyi Biotec) and cultured alone or co-cultured with CD70high or CD70low CT5.3-hTERT CAFs (Effector/target = 3/1). After 7 days, flow cytometric analysis was performed to identify the amount of Tregs by the following procedure. Cells were stained with fluorophore-conjugated antibodies to CD3, CD4, CD25, CD127, CD27 (Becton Dickinson) and Fixable Violet Dead Stain (Thermo Fisher Scientific) for 20 min at RT, followed by fixation for 30 min at 4°C and permeabilization using the FOXP3 Transcription factor staining buffer set (Thermo Fisher Scientific). Thereafter, cells were stained for intracellular TGF-β (IQ products), IL-10 (Biolegend) or FOXp3 (Thermo Fisher Scientific), acquired on a BD FACSAria II instrument (BD) and analysed using FlowJo v10.1 software (Fig. S2). In addition, supernatants was collected 5 days after co-culture and used to measure IL-2 protein levels (multiplexed particle-based flow cytometry cytokine assay (cytokine assay, R&D Systems)) and TGF-ß protein levels (enzyme-linked immunosorbent assay, Thermo Fisher Scientific) following the instructions of the manufacturer.
Transwell and scratch wound migration assay
Transwell migration experiments were performed using modified 16-well plates (CIM-16, Roche) in the xCELLigence real-time cell analysis (RTCA) system with each well consisting of an upper and a lower chamber separated by a microporous membrane containing randomly distributed 8 µm-pores.Citation53 Initially, 160 µL and 30 µL of media was added to the lower and upper chambers respectively and the CIM-16 plate was locked in the RTCA DP device at 37°C for 1 h to measure a background signal. Cells, deprived from FBS for 24 h, were detached using TrypLE Express™ (Invitrogen), resuspended in serum-free (SF) medium and counted. Thirty thousand CAFs (CD70high or CD70low) were seeded in the upper chamber and allowed to settle for 30 minutes at RT. Lower chambers contained media with or without FBS. Signals representing net chemoattraction were obtained by subtracting background (SF) values from the positive control (medium containing FBS) signals. Each condition was performed in duplicate and ran for 12 h.
The IncuCyte Zoom Scratch Wound assay (Essen Bioscience, Hertfordshire, United Kingdom) was used to examine the migration of CD70high versus CD70low CT5.3 CAFs during wound closure in co-culture with CRC cells. First, 96-well plates (ImageLock) were coated with Matrigel (100 ug/ml, Corning) overnight at 37°C. Each well was seeded with 3 × 10³ CRC cells, distinguished from CAFs by fluorescent tagging using NucLight Red reagent (Bacmam, Essen Bioscience), together with an equal amount of either CD70high or CD70low CAFs. After 4 h, scratches were introduced using the IncuCyte WoundMaker™ (Essen Bioscience), which creates wounds of equal width. Wound confluency was monitored every 2 h with the Incucyte LiveCell Imaging System (Essen Bioscience) for a total of 24 h. The IncuCyte scratch-wound analysis software allowed for quantification of the increasing cell confluence inside the wound using the “Relative Wound Density” metric. Scratches were performed at least in triplicate and wells with inappropriate or uneven scratches were excluded from analysis.
Statistical analysis
Associations between CD70, CD4 and Treg with clinicopathological parameters of CRC patients were investigated by χ2 analysis or Fisher's exact test (when appropriate). Spearman correlation coefficients were calculated to investigate the correlation between the expression of CD70, CD4 and Tregs in CRC specimens. The prognostic value was determined by survival analysis. Thereby, PFS was defined as the time until disease progression. Overall survival OS was defined as the time until cancer related death occurred. Univariate OS and PFS probability were estimated using the Kaplan-Meier method. Statistical significance was determined using the log-rank test. Multivariate cox proportional-hazard model was assessed to identify independent prognostic markers, presented as a hazard ratio and its 95% confidence interval. For in vitro experiments, Kruskal-Wallis tests were assessed for comparisons between three groups. If significant differences were revealed, Mann-Whitney U tests were performed for pairwise comparisons. All analyses were performed using SPSS version 23 and significance was reached if P<0.05 (two-tailed).
Disclosure of potential conflicts of interest
No potential conflicts of interest were disclosed.
2017ONCOIMM0808R1-s02.docx
Download MS Word (23.2 MB)Acknowledgments
We would to express our gratitude to the Tumor Biobank at Antwerp university hospital for providing tissue specimens.
Additional information
Funding
References
- Ferlay J, Soerjomataram I, Dikshit R, Eser S, Mathers C, Rebelo M, Parkin DM, Forman D, Bray F. Cancer incidence and mortality worldwide: sources, methods and major patterns in GLOBOCAN 2012. Int J Cancer. 2015;136:E359–86. doi:10.1002/ijc.29210. PMID:25220842.
- Tommelein J, Verset L, Boterberg T, Demetter P, Bracke M, De Wever O. Cancer-associated fibroblasts connect metastasis-promoting communication in colorectal cancer. Front Oncol. 2015;5:63. doi:10.3389/fonc.2015.00063. PMID:25853091.
- Herrera M, Islam AB, Herrera A, Martin P, Garcia V, Silva J, Garcia JM, Salas C, Casal I, de Herreros AG, et al. Functional heterogeneity of cancer-associated fibroblasts from human colon tumors shows specific prognostic gene expression signature. Clinical Cancer Research: An Official Journal of the American Association for Cancer Research. 2013;19:5914–26. doi:10.1158/1078-0432.CCR-13-0694. PMID:24052018.
- Harper J, Sainson RC. Regulation of the anti-tumour immune response by cancer-associated fibroblasts. Semin Cancer Biol. 2014;25:69–77. doi:10.1016/j.semcancer.2013.12.005. PMID:24406209.
- Pinchuk IV, Beswick EJ, Saada JI, Boya G, Schmitt D, Raju GS, Brenmoehl J, Rogler G, Reyes VE, Powell DW. Human colonic myofibroblasts promote expansion of CD4+ CD25high Foxp3+ regulatory T cells. Gastroenterology. 2011;140:2019–30. doi:10.1053/j.gastro.2011.02.059. PMID:21376048.
- Gunaydin G, Kesikli SA, Guc D. Cancer associated fibroblasts have phenotypic and functional characteristics similar to the fibrocytes that represent a novel MDSC subset. Oncoimmunology. 2015;4:e1034918. doi:10.1080/2162402X.2015.1034918. PMID:26405600.
- Kalluri R. The biology and function of fibroblasts in cancer. Nat Rev Cancer. 2016;16:582–98. doi:10.1038/nrc.2016.73. PMID:27550820.
- Ozdemir BC, Pentcheva-Hoang T, Carstens JL, Zheng X, Wu CC, Simpson TR, Laklai H, Sugimoto H, Kahlert C, Novitskiy SV, et al. Depletion of carcinoma-associated fibroblasts and fibrosis induces immunosuppression and accelerates pancreas cancer with reduced survival. Cancer Cell. 2014;25:719–34. doi:10.1016/j.ccr.2014.04.005. PMID:24856586.
- Cortez E, Roswall P, Pietras K. Functional subsets of mesenchymal cell types in the tumor microenvironment. Semin Cancer Biol. 2014;25:3–9. doi:10.1016/j.semcancer.2013.12.010. PMID:24412106.
- Koliaraki V, Pallangyo CK, Greten FR, Kollias G. Mesenchymal Cells in Colon Cancer. Gastroenterology. 2017;152:964–79. doi:10.1053/j.gastro.2016.11.049. PMID:28111227.
- Xiao Y, Freeman GJ. The microsatellite instable subset of colorectal cancer is a particularly good candidate for checkpoint blockade immunotherapy. Cancer Discov. 2015;5:16–8. doi:10.1158/2159-8290.CD-14-1397. PMID:25583798.
- Boland CR, Goel A. Microsatellite instability in colorectal cancer. Gastroenterology. 2010;138:2073–87e3. doi:10.1053/j.gastro.2009.12.064. PMID:20420947.
- Jacobs J, Deschoolmeester V, Zwaenepoel K, Rolfo C, Silence K, Rottey S, Lardon F, Smits E, Pauwels P. CD70: An emerging target in cancer immunotherapy. Pharmacology & Therapeutics. 2015;155:1–10. doi:10.1016/j.pharmthera.2015.07.007. PMID:26213107.
- De Meulenaere A, Vermassen T, Aspeslagh S, Zwaenepoel K, Deron P, Duprez F, Ferdinande L, Rottey S. CD70 Expression and Its Correlation with Clinicopathological Variables in Squamous Cell Carcinoma of the Head and Neck. Pathobiology. 2016;83:327–33. doi:10.1159/000446569. PMID:27389010.
- Claus C, Riether C, Schurch C, Matter MS, Hilmenyuk T, Ochsenbein AF. CD27 signaling increases the frequency of regulatory T cells and promotes tumor growth. Cancer Res. 2012;72:3664–76. doi:10.1158/0008-5472.CAN-11-2791. PMID:22628427.
- Fontenot JD, Rasmussen JP, Gavin MA, Rudensky AY. A function for interleukin 2 in Foxp3-expressing regulatory T cells. Nat Immunol. 2005;6:1142–51. doi:10.1038/ni1263. PMID:16227984.
- Rolfo C, Caglevic C, Santarpia M, Araujo A, Giovannetti E, Gallardo CD, Pauwels P, Mahave M. Immunotherapy in NSCLC: A Promising and Revolutionary Weapon. Adv Exp Med Biol. 2017;995:97–125. doi:10.1007/978-3-319-53156-4_5. PMID:28321814.
- Luke JJ, Flaherty KT, Ribas A, Long GV. Targeted agents and immunotherapies: optimizing outcomes in melanoma. Nat Rev Clin Oncol. 2017;14:463–482. doi:10.1038/nrclinonc.2017.43. PMID:28374786.
- Callahan MK, Postow MA, Wolchok JD. CTLA-4 and PD-1 Pathway Blockade: Combinations in the Clinic. Front Oncol. 2014;4:385. PMID:25642417.
- Donin NM, Lenis AT, Holden S, Drakaki A, Pantuck A, Belldegrun A, Chamie K. Immunotherapy for the Treatment of Urothelial Carcinoma. J Urol. 2017;197:14–22. doi:10.1016/j.juro.2016.02.3005. PMID:27460757.
- Le DT, Uram JN, Wang H, Bartlett BR, Kemberling H, Eyring AD, Skora AD, Luber BS, Azad NS, Laheru D, et al. PD-1 Blockade in Tumors with Mismatch-Repair Deficiency. N Engl J Med. 2015;372:2509–20. doi:10.1056/NEJMoa1500596. PMID:26028255.
- Jacobs J, Smits E, Lardon F, Pauwels P, Deschoolmeester V. Immune Checkpoint Modulation in Colorectal Cancer: What's New and What to Expect. J Immunol Res. 2015;2015:158038. doi:10.1155/2015/158038. PMID:26605342.
- Smyrk TC, Watson P, Kaul K, Lynch HT. Tumor-infiltrating lymphocytes are a marker for microsatellite instability in colorectal carcinoma. Cancer. 2001;91:2417–22. doi:10.1002/1097-0142(20010615)91:12%3c2417::AID-CNCR1276%3e3.0.CO;2-U. PMID:11413533.
- Llosa NJ, Cruise M, Tam A, Wicks EC, Hechenbleikner EM, Taube JM, Blosser RL, Fan H, Wang H, Luber BS, et al. The vigorous immune microenvironment of microsatellite instable colon cancer is balanced by multiple counter-inhibitory checkpoints. Cancer Discov. 2015;5:43–51. doi:10.1158/2159-8290.CD-14-0863. PMID:25358689.
- Huijbers A, Tollenaar RA, v Pelt GW, Zeestraten EC, Dutton S, McConkey CC, Domingo E, Smit VT, Midgley R, Warren BF, et al. The proportion of tumor-stroma as a strong prognosticator for stage II and III colon cancer patients: validation in the VICTOR trial. Ann Oncol. 2013;24:179–85. doi:10.1093/annonc/mds246. PMID:22865778.
- Pure E, Lo A. Can Targeting Stroma Pave the Way to Enhanced Antitumor Immunity and Immunotherapy of Solid Tumors? Cancer Immunol Res. 2016;4:269–78. doi:10.1158/2326-6066.CIR-16-0011. PMID:27036971.
- Mukaida N, Sasaki S. Fibroblasts, an inconspicuous but essential player in colon cancer development and progression. World J Gastroenterol. 2016;22:5301–16. doi:10.3748/wjg.v22.i23.5301. PMID:27340347.
- Ortiz-Cuaran S, Swalduz A, Albaret MA, Menetrier-Caux C, Haddad V, Paré A, De Souza G, Morel AP, Pérol M, Caux C, et al. Abstract 2320: CD70 immune checkpoint ligand is associated with the epithelial-to-mesenchymal transition in non-small cell lung cancer. Cancer Res. 2016;76:2320 -. doi:10.1158/1538-7445.AM2016-2320.
- Pich C, Sarrabayrouse G, Teiti I, Mariame B, Rochaix P, Lamant L, Favre G, Maisongrosse V, Tilkin-Mariame AF. Melanoma-expressed CD70 is involved in invasion and metastasis. Br J Cancer. 2016;114:63–70. doi:10.1038/bjc.2015.412. PMID:26671750.
- Ge H, Mu L, Jin L, Yang C, Chang Y, Long Y, De Leon G, Deleyrolle L, Mitchell DA, Kubilis PS, et al. Tumor Associated with CD70 Expression is Involved in Promoting Tumor Migration and Macrophage Infiltration in GBM. International Journal of Cancer. 2017;141:1434–44. doi:10.1002/ijc.30830. PMID:28612394.
- Mashita N, Yamada S, Nakayama G, Tanaka C, Iwata N, Kanda M, Kobayashi D, Fujii T, Sugimoto H, Koike M, et al. Epithelial to mesenchymal transition might be induced via CD44 isoform switching in colorectal cancer. J Surg Oncol. 2014;110:745–51. doi:10.1002/jso.23705. PMID:24975268.
- Huh JW, Kim HR, Kim YJ, Lee JH, Park YS, Cho SH, Joo JK. Expression of standard CD44 in human colorectal carcinoma: association with prognosis. Pathol Int. 2009;59:241–6. doi:10.1111/j.1440-1827.2009.02357.x. PMID:19351367.
- Jacobs J, Zwaenepoel K, Rolfo C, Van den Bossche J, Deben C, Silence K, Hermans C, Smits E, Van Schil P, Lardon F, et al. Unlocking the potential of CD70 as a novel immunotherapeutic target for non-small cell lung cancer. Oncotarget. 2015;6:13462–75. doi:10.18632/oncotarget.3880. PMID:25951351.
- Yang ZZ, Novak AJ, Stenson MJ, Witzig TE, Ansell SM. Intratumoral CD4+CD25+ regulatory T-cell-mediated suppression of infiltrating CD4+ T cells in B-cell non-Hodgkin lymphoma. Blood. 2006;107:3639–46. doi:10.1182/blood-2005-08-3376. PMID:16403912.
- deLeeuw RJ, Kost SE, Kakal JA, Nelson BH. The prognostic value of FoxP3+ tumor-infiltrating lymphocytes in cancer: a critical review of the literature. Clinical Cancer Research: An Official Journal of the American Association for Cancer Research. 2012;18:3022–9. doi:10.1158/1078-0432.CCR-11-3216. PMID:22510350.
- Hanke T, Melling N, Simon R, Sauter G, Bokemeyer C, Lebok P, Terracciano LM, Izbicki JR, Marx AH. High intratumoral FOXP3(+) T regulatory cell (Tregs) density is an independent good prognosticator in nodal negative colorectal cancer. Int J Clin Exp Pathol. 2015;8:8227–35. PMID:26339391.
- Tu JF, Ding YH, Ying XH, Wu FZ, Zhou XM, Zhang DK, Zou H, Ji JS. Regulatory T cells, especially ICOS+ FOXP3+ regulatory T cells, are increased in the hepatocellular carcinoma microenvironment and predict reduced survival. Sci Rep. 2016;6:35056. doi:10.1038/srep35056. PMID:27725696.
- Zhuo C, Xu Y, Ying M, Li Q, Huang L, Li D, Cai S, Li B. FOXP3+ Tregs: heterogeneous phenotypes and conflicting impacts on survival outcomes in patients with colorectal cancer. Immunol Res. 2015;61:338–47. doi:10.1007/s12026-014-8616-y. PMID:25608795.
- Lin Y-C, Mahalingam J, Chiang J-M, Su P-J, Chu Y-Y, Lai H-Y, Fang J-H, Huang C-T, Chiu C-T, Lin C-Y. Activated but not resting regulatory T cells accumulated in tumor microenvironment and correlated with tumor progression in patients with colorectal cancer. Int J Cancer. 2013;132:1341–50. doi:10.1002/ijc.27784. PMID:22907255.
- Miyara M, Yoshioka Y, Kitoh A, Shima T, Wing K, Niwa A, Parizot C, Taflin C, Heike T, Valeyre D, et al. Functional delineation and differentiation dynamics of human CD4+ T cells expressing the FoxP3 transcription factor. Immunity. 2009;30:899–911. doi:10.1016/j.immuni.2009.03.019. PMID:19464196.
- Jafarinia M, Mehdipour F, Hosseini SV, Ghahramani L, Hosseinzadeh M, Ghaderi A. Determination of a CD4+CD25-FoxP3+ T cells subset in tumor-draining lymph nodes of colorectal cancer secreting IL-2 and IFN-gamma. Tumour Biol. 2016;37:14659–66. doi:10.1007/s13277-016-5345-y. PMID:27619682.
- Clarke SL, Betts GJ, Plant A, Wright KL, El-Shanawany TM, Harrop R, Torkington J, Rees BI, Williams GT, Gallimore AM, et al. CD4+CD25+FOXP3+ regulatory T cells suppress anti-tumor immune responses in patients with colorectal cancer. PLoS One. 2006;1:e129. doi:10.1371/journal.pone.0000129. PMID:17205133.
- Hoffmann P, Eder R, Kunz-Schughart LA, Andreesen R, Edinger M. Large-scale in vitro expansion of polyclonal human CD4(+)CD25high regulatory T cells. Blood. 2004;104:895–903. doi:10.1182/blood-2004-01-0086. PMID:15090447.
- Ruprecht CR, Gattorno M, Ferlito F, Gregorio A, Martini A, Lanzavecchia A, Sallusto F. Coexpression of CD25 and CD27 identifies FoxP3+ regulatory T cells in inflamed synovia. J Exp Med. 2005;201:1793–803. doi:10.1084/jem.20050085. PMID:15939793.
- Jeffrey SC, Burke PJ, Lyon RP, Meyer DW, Sussman D, Anderson M, Hunter JH, Leiske CI, Miyamoto JB, Nicholas ND, et al. A potent anti-CD70 antibody-drug conjugate combining a dimeric pyrrolobenzodiazepine drug with site-specific conjugation technology. Bioconjug Chem. 2013;24:1256–63. doi:10.1021/bc400217g. PMID:23808985.
- Owonikoko TK, Hussain A, Stadler WM, Smith DC, Kluger H, Molina AM, Gulati P, Shah A, Ahlers CM, Cardarelli PM, et al. First-in-human multicenter phase I study of BMS-936561 (MDX-1203), an antibody-drug conjugate targeting CD70. Cancer Chemother Pharmacol. 2016;77:155–62. doi:10.1007/s00280-015-2909-2. PMID:26576779.
- Silence K, Dreier T, Moshir M, Ulrichts P, Gabriels SM, Saunders M, Wajant H, Brouckaert P, Huyghe L, Van Hauwermeiren T, et al. ARGX-110, a highly potent antibody targeting CD70, eliminates tumors via both enhanced ADCC and immune checkpoint blockade. mAbs. 2014;6:523–32. doi:10.4161/mabs.27398. PMID:24492296.
- Goethals S, De Wilde A, Lesage K, Smits E, Pauwels P, Peeters M. Tumorbank@UZA: A Collection of Tissue, Fluid Samples and Associated Data of Oncology Patients for the Use in Translational Research. Open J Bioresour, 2018;5:4. doi:10.5334/ojb.30.
- Henry LR, Lee HO, Lee JS, Klein-Szanto A, Watts P, Ross EA, Chen WT, Cheng JD. Clinical implications of fibroblast activation protein in patients with colon cancer. Clinical Cancer Research: An Official Journal of the American Association for Cancer Research. 2007;13:1736–41. doi:10.1158/1078-0432.CCR-06-1746. PMID:17363526.
- Aftimos P, Rolfo C, Rottey S, Offner F, Bron DD, Maerevoet M, Soria JC, Moshir M, Dreier T, van Rompaey L, et al. Phase 1 dose-escalation study of the anti-CD70 antibody ARGX-110 in Advanced Malignancies. Clinical Cancer Research: An Official Journal of the American Association for Cancer Research. 2017;23:6411–20. doi:10.1158/1078-0432.CCR-17-0613. PMID:28765328.
- Van Hoorde L, Braet K, Mareel M. The N-cadherin/catenin complex in colon fibroblasts and myofibroblasts. Cell Adhes Commun. 1999;7:139–50. doi:10.3109/15419069909034397. PMID:10427966.
- Jesnowski R, Furst D, Ringel J, Chen Y, Schrodel A, Kleeff J, Kolb A, Schareck WD, Lohr M. Immortalization of pancreatic stellate cells as an in vitro model of pancreatic fibrosis: deactivation is induced by matrigel and N-acetylcysteine. Lab Invest. 2005;85:1276–91. doi:10.1038/labinvest.3700329. PMID:16127427.
- Limame R, Wouters A, Pauwels B, Fransen E, Peeters M, Lardon F, De Wever O, Pauwels P. Comparative analysis of dynamic cell viability, migration and invasion assessments by novel real-time technology and classic endpoint assays. PLoS One. 2012;7:e46536. doi:10.1371/journal.pone.0046536. PMID:23094027.