
ABSTRACT
Meningiomas WHO grade I and II are common intracranial tumors in adults that normally display a benign outcome, but are characterized by a great clinical heterogeneity and frequent recurrence of the disease. Although the presence of an immune cell infiltrate has been documented in these tumors, a clear phenotypical and functional characterization of the immune web is missing. Here, we performed an extensive immunophenotyping of peripheral blood and fresh tumor tissue at surgery by multiparametric flow cytometry in 34 meningioma patients, along with immunosuppressive activity of sorted cells of myeloid origin. Four subsets of myeloid cells, phenotypically corresponding to myeloid-derived suppressor cells (MDSCs) are detectable in the blood and in the tumor tissue of patients and three of them are significantly expanded in the blood of patients, but show no evidence of suppressive activity. At the tumor site, a large leukocyte infiltrate is present, predominantly constituted by CD33+ myeloid cells, largely composed of macrophages endowed with suppressive activity and significantly expanded in grade II meningioma patients as compared to grade I.
Introduction
The tumor microenvironment holds a complex network of communications between tumor, immune and stromal cells, driven by signals provided by extracellular matrix components and by soluble factors. Such interactions influence the outcome of the tumor, being potentially able to drive tumor expansion or tumor regression. The complexity of the anti-tumor immunity is emphasized by the notion that many infiltrating immune cells possess a dual function in the tumor context, because of their plasticity. Therefore, the presence of an immune infiltrate does not necessarily imply an anti-tumor response or, conversely, tumor tolerance, and thus only a careful characterization and analysis of the immune infiltrate can provide information associated to disease outcome.
An evolving aspect of brain tumors' research is the appreciation of the presence of an immune suppressive microenvironment and, in fact, a number of investigators documented the presence of several immune-mediated suppressive mechanisms. Among them, myeloid-derived suppressor cells (MDSCs) have been recognized both in the blood and at the tumor site in patients with glioblastoma, a very aggressive tumor associated with a poor prognosis.Citation1,Citation2 An intriguing aspect of MDSC biology is their appearance in different phenotypic subsets, both of monocytic and polimorphonuclear (PMN) type, probably because of the reaction to a conditional environment induced by the tumor. This characteristic aspect of MDSC biology, however, challenges at present their phenotypic identification, and a large variance has been recognized among different laboratories in their characterization.Citation3 Moreover, another element of complexity is the fact that phenotypic evaluation is only one element for the analysis of MDSC, since these cells must be accompanied by suppressive activity. In this respect, it has recently been proposed that cells with MDSC phenotype, but lacking suppressive activity should be termed as MDSC-like cells (MDSC-LC), and the role of such myeloid cell population in early stages of cancer or initial stages of chronic inflammation needs to be defined. Ample evidence documents the presence of MDSC in several malignant tumors of different histology, but data are scarce regarding benign tumors, and absent in meningiomas.
Meningiomas are among the most common adult primary brain tumors and although more than 90% of meningiomas are of benign histology (grade I), the WHO classification system also recognizes atypical (grade II) and anaplastic or malignant (grade III) meningiomas. These more aggressive histologies have a propensity for recurrence and infiltration of surrounding brain parenchyma. Surgical resection is the standard treatment for symptomatic and growing tumors. Radiation therapy should be considered in selected situations, while chemotherapeutic agents have been reported to be ineffective.
Some data report the presence of tumor infiltrating immune cells in meningiomas, both of myeloid and lymphoid origin, in some cases by immunohistochemistry, in others by flow cytometry from fresh or frozen samples,Citation4 but a clear picture of the immune infiltrate, including the tolerogenic mechanisms, is absent.
In this study, we performed an in-depth immunophenotyping of peripheral blood and fresh tumor tissue from 34 grade I and II meningioma patients at surgery, along with immunosuppressive activity of sorted cells of myeloid origin. We document the presence of myeloid cell subsets with the phenotype of MDSCs in the blood, but lacking suppressive activity, and of a large suppressive myeloid infiltrate in the tumor tissue.
Results
Identification of different myeloid cell subsets in peripheral blood and tumor tissue of meningioma patients . The role of MDSCs in malignant tumors has been clearly established in several studies, but in benign tumors it needs to be addressed. To evaluate whether expansion of MDSCs is present in meningioma patients, we analyzed the presence of four subsets of MDSCs among 34 WHO grade I/II meningioma patients. To this aim, we performed MDSC immunophenotyping in the blood of treatment naïve patients undergoing surgery for tumor resection and compared these values with a cohort of 34 healthy donors (HD) matched for age (). This analysis was carried out with a 7-color panel on whole blood allowing the simultaneous identification of four subsets: MDSC 1: CD14+/IL4Rα+, MDSC 2: CD15+/IL4Rα+, MDSC 3: Lin−/HLA-DR−/CD11b+/CD33+, MDSC 4: CD14+/HLA-DRlow/−. MDSC 1 and 4 are gated on peripheral blood mononuclear cells (PBMC) and are monocytic MDSCs (M-MDSC), MDSC 3 is an immature cell subset, named early MDSC (eMDSC) evaluated on peripheral blood leukocytes (PBLs), while granulocytic MDSCs (MDSC 2 or PMN-MDSC) are gated on PMNs.Citation5
Table 1. Participants' characteristics
As shown in , meningioma patients had a significant expansion of circulating MDSC 1, MDSC 2 and MDSC 4 subsets, while MDSC 3 were significantly decreased as compared to matched HD.
Figure 1. Analysis of immunosuppressive factors in meningioma patients. A) Analysis of four MDSC subsets on the peripheral blood of healthy donors (n = 34) and meningioma patients (n = 32 for MDSC 1, 3, 4; n = 30 for MDSC 2). MDSC 1 (CD14+/IL4Rα+) and MDSC 4 (CD14+/HLA-DRlow/−) are gated on PBMCs, MDSC 2 (CD15+/IL4Rα+) are gated among PMN and MDSC 3 (Lin−/HLA-DR−/CD11b+/CD33+) were evaluated in CD15- cells, gating first in Lin−HLA-DR− and then in CD33+/CD11b+ cells. B) Evaluation of ARG-1 levels and functional activity in the plasma of meningioma patients (HD = 22; MG = 32). Mean ±SE is reported. Mann-Whitney U test was performed. Asterisks denote significant P values: ***P< .001. C) Levels of MDSC subsets in tumor biopsy of meningioma patients (n = 24 for MDSC 1 and 2; n = 28 for MDSC 3; n = 26 for MDSC 4) are reported in the graphs, referred to leukocytes. Mann-Whitney U test was performed. Asterisks denote significant P values: *P < .05; ***P < .001.
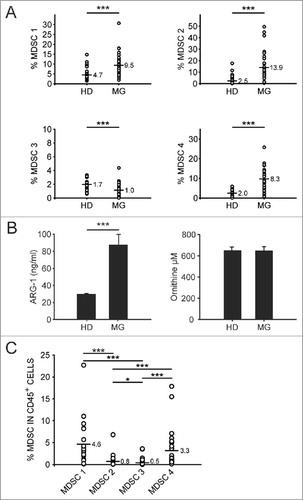
The immunosuppressive function of specific MDSC subsets relies on multiple mechanisms, including the expression of arginase-1 (ARG-1). It has been extensively reported, in several tumor types,Citation6 that depletion of arginine by arginase-expressing myeloid cells contributes to an immunosuppressive environment which inhibits proliferation and T cell effector functions. We thus assayed ARG-1 levels and activity in plasma samples from both meningioma patients and healthy donors. As shown in (left panel), we observed a significant increase of ARG-1 levels in plasma from meningioma patients as compared to the control group, but this was not associated to an increase of ARG activity (right panel), that remained instead unchanged between the two groups (, right panel).
We assessed the presence of the myeloid subsets evaluated in the blood also in tumor biopsies from the same patients. Thus, after tissue dissociation cells were stained with 2 panels containing nine different markers, and MDSC subsets were analyzed using the gating strategy shown in Supplementary Fig. 1. MDSC 1 and MDSC 4 were identified among CD15− cells, while MDSC 2 were gated in the CD15+ subset and MDSC 3 were discriminated from the whole leukocyte population as Lin−/HLA-DR− cells expressing CD33 and CD11b. This analysis revealed that MDSC levels are detectable in the tumor infiltrate, and the most expanded subsets are the monocytic subsets 1 and 4, while MDSC 2 and 3 are less abundant (). MDSC levels both in the peripheral blood and at tumor site were also analyzed stratifying meningioma patients on the basis of the WHO grade (I or II) but we did not observe statistically significant variations (data not shown).
Composition of myeloid and lymphoid cell infiltrate in meningiomas . To characterize the immune contexture in meningiomas at the time of surgery, we performed multicolor flow cytometry analysis with 3 panels covering 14 antigens (Suppl. Fig. 1 and Suppl. Fig. 2) thus allowing the measurement of expression of immune cells infiltrating the tumor in each patient. This analysis demonstrated the presence of a large and well-defined pattern of expression of tumor infiltrating myeloid cells. Suppl. Fig. 2 shows the gating strategy used to identify the different cell subsets present in the tumor microenvironment, which are then summarized in and . We observed that more than 50% of the live cells were CD45+ leukocytes (59.5±25.6%) and, interestingly, that the large majority is constituted by myeloid cells (79.8± 14.6%), as determined by the CD33 expression ( and ). Myeloid cells at the tumor site are often a complex mixture of cells including granulocytes, tissue-resident and bone-marrow derived macrophages, and MDSCs. Therefore, to dissect the presence of different myeloid cells, we added HLA-DR marker that allowed us to distinguish three different myeloid subsets, CD33+/HLA-DR+, CD33+/HLA-DRdim and CD33dim/HLA-DR− cells. We thus separated by FACS sorting CD45− cells, lymphocytes, CD33+/HLA-DR+ and CD33dim/HLA-DR− myeloid cells and prepared a cytospin for morphological evaluation. CD33+/HLA-DR+ cells correspond phenotypically and morphologically to macrophages, while CD33dim/HLA-DR− subset correspond to PMNs (Suppl. Fig. 2). CD33+/HLA-DRdim cells match phenotypically to MDSC 4 since they are also CD14+ (data not shown). Macrophages represent the 80.4± 20.6% of total CD33+ cells, PMN the 16.2 ± 17.6% and MDSC 4 the 3.4 ± 4.2% (). Of note, we found that in grade II meningiomas there is a significantly higher presence of macrophages, as compared to grade I tumors and a significantly lower level of PMNs ().
Figure 2. Characterization of myeloid and lymphoid populations present at the tumor site. A) Representation of the levels of different cell subsets contained in tumor biopsies of meningioma patients. B) The mean and SD are reported in the table. C) CD33+/HLA-DR+ (left panel) and CD33dim/HLA-DR− cells (right panel) were evaluated in grade I (n = 23) and grade II (n = 11) meningioma patients. D) Frequency of PD-L1 in CD45− cells, and in CD33+, CD33+/HLA-DR+, CD33dim/HLA-DR− cells are reported in the graph (n = 28). E) PD-1+(left panel) and LAG-3+ cells (right panel) were calculated in CD3+/CD8− and CD3+/CD8+T cell subsets (n = 24). F) LAG-3 expression was analyzed in CD3+/CD8− cells in grade I (n = 16) and grade II (n = 8) meningioma patients. Mann-Whitney U test was performed. Asterisks denote significant P values: *P < .05; **P < .01.
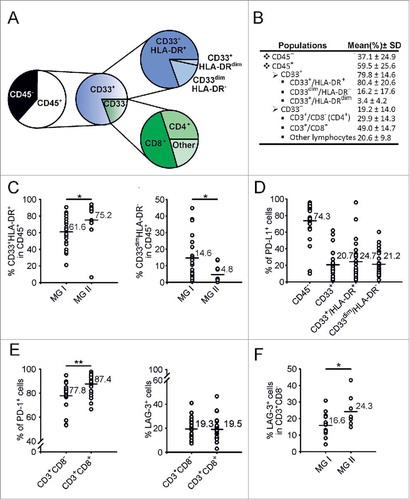
In the same tumor tissue, we also determined the presence of T cells, along with the cell-surface molecules related to T cell responsiveness. To analyze T cells, we first gated on CD33− population, that phenotypically and morphologically corresponds to lymphocytes (Suppl. Fig. 2), and then used CD3 and CD8 markers to identify CD3+CD8− and CD3+CD8+ T cells. CD33− cells constitute the 19.2±14.0% of leukocytes present at the tumor site and they contain 29.9±14.3% of CD3+CD8− T cells and 49.0±14.7% of CD8+ T cells, representing, respectively, 6.5 ± 8.0 and 8.7 ± 5.1% of total leukocytes (). We next analyzed in the immune infiltrate the expression of PD-L1, a molecule involved in immunoregulatory pathways and in the mechanism of suppression of MDSCs.Citation7 Our results show that PD-L1 is present at high levels in CD45− cells (mean: 74.3±22.3%), but its expression was present also on myeloid cells (CD33+ mean 20.7±15.1%, CD33+/HLA-DR+ mean 24.7±21.5% and CD33dim/HLA-DR− mean 21.2.1±14.5%), although at lower levels. On average, the expression does not differ between macrophages and PMNs, but the macrophages of some patients show a very high expression of PD-L1, comparable to that of tumor cells ().
Since PD-L1 was expressed on tumor and myeloid cells, we checked whether its receptor PD-1 was increased on infiltrating T cells, and observed a very high expression of PD-1 on CD3+ T cells (mean 83.8±9.8%, data not shown), with significantly higher levels in CD3+CD8+ T cells as compared to CD3+CD8− T lymphocytes (, left panel). Besides PD-1, we also evaluated LAG-3 expression on T cells, a marker that is involved in T cell exhaustionCitation8,Citation9 and up-regulated in T cells after the co-culture with in vitro-induced MDSCs.Citation7 Our data indicate that LAG-3 is expressed in CD3+ T cells infiltrating meningioma biopsies (mean 19.2±8.3%, data not shown) and that it reaches comparable levels in CD3+CD8− and CD3+CD8+ T cells (mean 19.3±8.2% in CD3+CD8− T cells; mean 19.5±9.3% in CD3+CD8+ T cells) (, right panel). Interestingly, we found that LAG-3 expression was significantly higher in CD3+CD8− T cells of grade II meningiomas, compared to grade I ().
Functional characterization of myeloid cell subsets isolated from peripheral blood and tumor biopsies of meningioma patients . Given the presence of myeloid cells with the phenotype of MDSC in the peripheral blood of meningioma patients and the expression at tumor level of markers of immunosuppression, we set out to test the potential suppressive activity of myeloid populations present both in the blood and in tumor biopsies. The whole CD14+ cell population and two MDSC subsets, one monocytic (MDSC 4) and one immature (MDSC 3 or eMDSC), were separated either by magnetic beads (total CD14+ cells) or by FACS sorting (MDSC 4 and 3) from the PBMCs of HDs and meningioma patients, and their immunosuppressive ability was tested on the proliferation of mitogen activated, CellTrace-labelled T cells. CD14+/HLA-DRlow/− and Lin−/HLA-DR− cells were chosen among patients in which a significant expansion of these cell subsets was present. Representative examples shown in , and cumulative data in show that the addition of monocytes or of cell subsets corresponding to MDSC 4 and MDSC 3 from meningioma patients or from HD did not induce immune suppression. As control, we also added PMN isolated from peripheral blood of meningioma patients by dextran sedimentation that, similarly, did not show inhibitory effect on the proliferation of T cells (data not shown).
Figure 3. Functional analysis of myeloid cells isolated from peripheral blood and tumor tissue. A) CD14+ cells (left plots), CD14+/HLA-DRlow/− cells and Lin−/HLA-DR− cells (lower plots) were separated from PBMCs, while CD33+ or CD33+/HLA-DR+cells were isolated from biopsies (right plots) by immunomagnetic or FACS sorting. The immunosuppressive activity of these populations was tested on the proliferation of CellTrace-labelled allogeneic PBMCs activated with anti-CD3/CD28 for four days. Representative examples from three meningioma patients are reported (MG# 1, MG# 2 and MG# 3). Red peaks refer to activated T cells alone, while grey peaks represent the proliferation of T cells in the presence of sorted subsets of myeloid cells. B) The histograms show the proliferation of T cells cultured alone (first left histograms) or in the presence of different populations of myeloid cells added at 1:1 ratio (n = 6 for CD14+ cells, 3 for CD14+/HLA-DRlow/− cells and Lin−/HLA-DR− cells isolated from PBMCs of HDs; n = 12 for CD14+ cells, 4 for CD14+/HLA-DRlow/− cells and 3 for Lin−/HLA-DR− cells isolated from PBMCs of meningioma patients). Inhibition of T cell proliferation of CD33+ (n = 3) or CD33+/HLA-DR+cells (n = 6) isolated from tumor biopsies of meningioma patients is showed in the right part of the graph. The proliferation of T cells calculated considering the absolute number of T cells is reported in black, while the percentage of proliferating T lymphocytes as assessed by CellTrace profile is reported in grey. Mean ± SE is reported. Mann-Whitney U test was performed between the immunosuppression exerted by CD14+ cells isolated from peripheral blood and that of either total CD33+ or CD33+/HLA-DR+ cells from biopsies. Asterisks denote significant P values: *P <. 05; **P <.01.
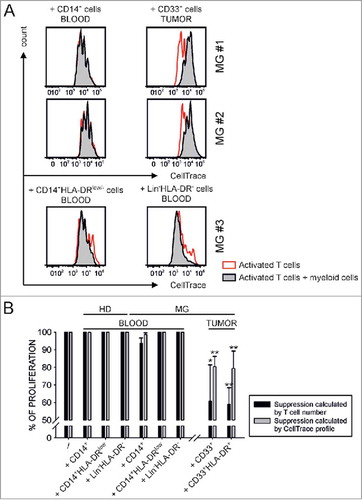
To evaluate the potential suppressive ability of myeloid cells present in tumor biopsies, we sorted total CD33+ cells or CD33+/HLA-DR+ subset for the samples with a higher cell number. Representative examples reported in the right panels of and cumulative data of total CD33+ cells isolated from 3 patients and CD33+HLA-DR+ cells from 6 patients (right histograms of ) show that myeloid cells isolated from meningioma biopsies exert strong immunosuppression on the proliferation of T cells. By dividing myeloid cells isolated from grade I (n = 5) and grade II (n = 4) meningioma patients we observed a trend towards increased immunosuppression in grade II meningioma patients, although not statistically significant (data not shown).
Discussion
The presence of an immune infiltrate is a common finding in many tumors, but only in recent years it has become evident that the type and the composition of this infiltrate has a relevance to tumor progression.Citation10 Most of the studies addressed this topic in malignant tumors, while less is known in benign tumors. In this study we identified a recurrent pattern of a large leukocyte infiltration in WHO grade I/II meningioma biopsies; such infiltrate contains a large proportion of myeloid cells, in which there is the prevalence of cells with markers and morphology of macrophages endowed with suppressive activity. Interestingly, we found a higher presence of suppressive macrophages in grade II meningiomas, compared to grade I tumors, and this result supports the notion that tumor progression is accompanied by an increased presence of an immune suppressive microenvironment. Moreover, also the lymphoid compartment shows signs of dysfunctional activity, since CD3+CD8− T cells expressing LAG-3 are present at a higher level in grade II meningiomas (). To the best of our knowledge, these are the first indications that a benign tumor shows a progressive dysfunctional and immune suppressive microenvironment along its progression toward a malignant phenotype.
Another interesting observation of our results is the expansion of myeloid cells bearing the markers of MDSCs, but lacking immune suppressive activity on T cells, which is considered the “gold” standard to define myeloid cells as MDSCs. Currently, such cells in the blood of meningioma patients should be regarded as MDSC-like cells, as recently suggested by an international committee.Citation11 The finding that MDSC devoid of suppressive activity are present in the blood of patients with a benign tumor needs to be expanded to other benign tumors and raises the intriguing possibility that the modulation of the immune suppressive activity in these cells is a distinct event from the mobilization of the cells from the bone marrow.
In line with these findings, we also found an increased level of ARG-1 in the plasma of meningioma patients, which did not correlate with an increased activity of the protein. Even though this result seems in line with the lack of suppressive activity of circulating myeloid cells, it should also be considered that published resultsCitation12 have clearly indicated that the formation of ornithine, at high ARG-1 concentration, is limited by decreasing arginine availability. Moreover, our activity test was performed at alkaline pH at which only the full length ARG-1 is active but not the ARG-1 cleaved form, which has been described to be secreted by PMN and has an optimal pH around 7.Citation13 Therefore, further studies are needed to clarify whether ARG-1 present in the plasma of meningioma patients is functionally active.
At the tumor site, we sorted CD33+/HLA-DR+ cells that are likely constituted by both resident and bone-marrow derived macrophages and MDSC 1. These cells display morphological features of macrophages and in this study we proved that they have a relevant immunosuppressive activity. The presence of tumor-associated macrophages in meningioma is in line with other studies.Citation14–Citation19 Myeloid cells have been characterized by CD68 expressionCitation14,Citation19 together with CD14, HLA-DR and CD163 expressionCitation15,Citation17 and described as a heterogeneous population composed of round, oval, ameboid or ramified mononuclear cells with small, dense nuclei together with mononuclear cells with slight to marked vacuolation,Citation16 all morphologic characteristics that we found also in our cytospin evaluation. Differently from Domingues et al.,Citation18 in our analyses we also observed a myeloid cell population with low expression of HLA-DR that morphologically corresponds to granulocytes. This discrepancy could be due to different methods of sample handling, since we processed and analyzed biopsies immediately after withdrawing, thus preventing PMN loss that are highly sensitive to cryopreservation.Citation20 Of note, a number of studies pointed out that tumor microenvironment has a profound effect on MDSCs, and that a complex interplay takes place among tumor reprogrammed myeloid cells present in the tumor microenvironment.Citation21 It should also be considered that differences between tumor-associated macrophages (TAMs) and MDSCs cannot be clearly defined in the tumor microenvironment, as the boundaries becomes rather blurry, given also the inherent plasticity of TAMs and cellular heterogeneity of MDSCs. Moreover, we showed that MDSCs change their phenotype and become immunosuppressive only after having encountered activated T cells because a crosstalk between the two populations activates a loop of molecular events that “prime” MDSC functions. We also showed that molecules involved in this activation loop are expressed in melanoma and colorectal cancer metastases, thus highlighting that “MDSC priming” takes place at the tumor site, where MDSCs and activated T cells are in contact.Citation7
Our data highlight the immunosuppressive function of CD33+/HLA-DR+ cells infiltrating meningioma biopsies, and is emphasized by the statistically significant difference in the percentage of these cells between grade I and grade II meningiomas. Moreover, immunosuppressive CD33+/HLA-DR+ cells also expressed PD-L1, a marker associated to impaired immune responses in cancer patientsCitation22 and that we previously demonstrated to be involved in MDSC mechanism of action.Citation7 We found PD-L1 expression at comparable levels in macrophages and granulocytes present at the tumor site, and this expression was not associated to tumor grading, as grade I and II meningiomas had similar levels of PD-L1. Two other papers reported similar results, documenting the expression of PD-L1 on CD33+ cells, but demonstrating also that it was not increased in higher grade meningiomas. Both studies instead underlined that PD-L1 was expressed by tumor cells and that its levels increased with the progression of the disease.Citation19,Citation23 Moreover, Han et al.Citation19 identified PD-L1 expression on CD68− tumor cells as an independent predictor of overall survival. We also found high levels of PD-L1 expression in CD45− tumor cells, with a trend to increase between grade I and II meningiomas, although these levels did not reach a statistical significance.
Besides myeloid cells, we found that leukocyte infiltrate in meningioma biopsies contained also lymphocytes, constituted for the vast majority by T cells with almost 50% of CD8+ T cells, in line with previous resultsCitation18,Citation19,Citation23,Citation24 and no differences were observed with tumor grading (data not shown), as shown by other studies.Citation19,Citation24 However, in grade III meningiomas Du et al. reported a significant decrease in the number of CD3+ T lymphocytes, both CD4+ and CD8+, as compared to low-grade meningiomas,Citation23 thus suggesting that T cells are reduced in high-grade meningiomas.
To further characterize the T cell infiltrate, we analyzed the expression of two markers, PD-1 and LAG-3, which have been associated to T cell impairment and involved in MDSC interaction with T lymphocytes.Citation7 We observed that PD-1 expression was very high both on CD3+CD8− and on CD3+CD8+ T cells. The presence of PD-1 on T lymphocytes in meningioma biopsies was already reported in two independent studies. One of them noted a decrease in the number of PD-1+ cells restricted to anaplastic meningioma cases,Citation23 the other showed a statistically significant increase of PD-1 expression in CD4+ and CD8+ tumor-infiltrating lymphocytes as compared to PBMCs.Citation25 PD-1 up-regulation was also associated to an increase of another marker of T cell exhaustion, T cell immunoglobulin and mucin protein 3 (TIM-3), although not statistical significance was reached.Citation25 In our study, besides PD-1, we evaluated the expression of LAG-3, another marker of T cell dysfunction, never investigated before in meningioma patients and observed that LAG-3 was present on both CD3+CD8− and CD3+CD8+ T lymphocytes, although at lower levels if compared to PD-1 expression, and moreover that its expression is higher on CD3+CD8−from grade II meningiomas, thus highlighting a possible dysfunction in the T cell compartment related to tumor progression.
In conclusion, in this study we observed in meningioma patients the expansion of MDSC subsets, devoid of suppressive activity. However, at the tumor site a large amount of suppressive myeloid-infiltrating cells are present, suggesting that MDSCs present in the peripheral blood may become functionally active only at tumor site, possibly undertaking a process of differentiation into macrophages. All these data, together with the presence of PD-1 and LAG-3 on T cells and the expression of PD-L1 by both tumor and myeloid cells, suggest that an immunosuppressive microenvironment is present in low-grade meningioma patients, and support the possibility of using a combined immunotherapeutic approach in grade II patients, for which a clear therapeutic option is missing, in order to relieve immune suppression and activate the immune activity toward a growing tumor.
Materials and methods
Patients' characteristics . Patients were recruited at the Department of Neurosurgery, Padova University Hospital, Italy. The ethical committee of the IOV-IRCCS and of Padova University Hospital approved all experiments and all patients gave their informed consent. We obtained peripheral blood and freshly resected tumor material from 34 patients: 24 affected by a WHO grade I and 10 affected by a WHO grade II meningioma (). One patient had four biopsies, three diagnosed as grade I and one as grade II.
Blood and tumor samples . Blood sample was withdrawn from the patient the same day of surgery, before anesthesia induction. Whole blood was used for flow cytometry analysis, while for functional assays peripheral blood mononuclear cells (PBMCs) were isolated by density gradient centrifugation on Ficoll-Paque PLUS (GE Healthcare-Amersham, NJ, USA), followed by dextran sedimentation to obtain PMNs, as previously described.Citation26 To produce single-cell suspension, all tumors were processed by enzymatic digestion using Tumor Dissociation Kit, human (MiltenyiBiotec), following manufacturer's instructions for soft tumors. Red blood cells were lysed by hypotonic solution of ammonium chloride.
Multiparametric flow cytometry . Peripheral blood and tumor cell suspensions were analyzed by multicolor flow cytometry to determine levels of myeloid and T cell subsets. Blood MDSC subsets were identified by a 7-color staining, containing anti-CD11b Alexa700 (BD Biosciences), anti-CD14 APC-H7 (BD Biosciences), anti-CD15 V450 (BD Biosciences), anti-CD33, anti-α chain of interleukin 4 receptor (IL4Rα), Lineage cocktail (Lin), anti-HLA-DR as reported in.Citation5 Standardization of the immunophenotyping assay was performed as described in.Citation5
Biopsies were labelled with LIVE/DEAD Fixable Aqua (Life Techonologies, MA, USA), anti-CD45 BV421 (BD Biosciences), anti-CD33 PE-Cy7 (eBioscience) or anti-CD33 APC (BD Biosciences), anti-HLA-DR APC (BD Biosciences), anti-IL4Rα PE (R&D SYSTEMS), Lin cocktail 1 FITC (BD Biosciences), anti-CD11b Alexa700 (BD Pharmingen), anti-PD-L1 PE (eBioscience), anti-CD14 APC-H7 (BD Biosciences), anti-CD15 FITC (BD Biosciences), anti-CD3 PE-Cy7 (Beckman Coulter), anti-CD8 APC-H7 (BD Biosciences), anti-LAG-3 FITC (AdipoGen), anti-PD1 PE (MiltenyiBiotec). Data were acquired with a LSRII flow cytometer (BD Biosciences) and analysis was performed by FlowJo software (Three Star Inc). Fluorescence minus one (FMO) controls for HLA-DR, IL4Rα, PD-L1, PD-1 and LAG-3 were used as negative controls.
Arginase type I ELISA . Plasma samples from meningioma (n = 32) patients and healthy donors (n = 22) were obtained upon previous centrifugation over Ficoll-Paque Plus of peripheral blood. The supernatant was collected and further spun at 1,300 rpm, 4 °C for 6 minutes and stored at −80°C. Plasma level of arginase type I (ARG1) was analyzed using Arginase Liver Type Human ELISA (BioVendor Laboratory Medicine Inc.) following the manufacturer's instructions. Hemolized samples were excluded from the analysis. Samples were assayed in duplicates and ARG1 concentration was extrapolated from the standard curve.
Arginase activity assay . Plasma samples from meningioma patients (n = 32) and healthy donors (n = 22), obtained as before, were tested for arginase activity by measuring the production of L-ornithine. Briefly, 25μl of MnCl2 21.6 mM were added to 30 µl of plasma and the mixture was heated at 55°C for 20 minutes to activate arginase. Then, 150μl of carbonate buffer (100 mM, pH 10) and 50μl L-arginine (100 mM) were added and the reaction was further incubated at 37°C for 10 minutes. The hydrolysis reaction converting L-arginine to L-ornithine was identified by a colorimetric assay after the addition of ninhydrin solution and incubation at 100°C for 30 minutes. Absorbance was acquired at 490 nm. Samples were assayed in duplicates and L-ornithine concentration was derived from a standard curve.
Isolation of myeloid cell subsets and proliferation assay . CD14+ cells were isolated from PBMCs of HDs and meningioma patients by either immunomagnetic cell sorting using anti-CD14 beads (Miltenyi Biotec), following manufacturer's instructions or by FACS (MofloAstrios, Beckman Coulter). CD14+/HLA-DRlow/− and Lin−/HLA-DR− cells were separated by FACS sorting after staining PBMCs with anti-CD14 FITC or with the Lineage cocktail (anti-CD14, anti-CD19, anti-CD56, anti-CD3) FITC and anti- HLA-DR APC. To separate CD33+ and CD33+/HLA-DR+ cells present in the tumor, the cell suspension obtained after enzymatic digestion of meningioma biopsies was stained with BD Horizon Fixable Viability Stain 520 (BD Biosciences), anti-CD45 BV421 (BD Biosciences), anti-CD33 PE-Cy7 (eBioscience) and HLA-DR APC (BD Biosciences) and filtered through a 100 μM cell strainer. CD33+ and CD33+/HLA-DR+ cell subsets were separated by FACS sorting. The purity of each fraction was >90%. The immunosuppressive activity of CD14+cells isolated from the peripheral blood and of CD33+ or CD33+/HLA-DR+ cells isolated from tumor was tested on the proliferation of PBMCs isolated from the peripheral blood of healthy donors by density gradient centrifugation on Ficoll-Paque PLUS (GE Healthcare-Amersham, NJ, USA), as previously described.Citation26 PBMCs were stained with 0.5 μM CellTrace™ Violet Cell Proliferation Kit (Invitrogen, Molecular Probes, MA, USA), according to manufacturer's instructions. CellTrace-labelled PBMCs were activated with coated 1μg/ml anti-CD3 and 5 μg/ml soluble anti-CD28 (BioLegend, CA, USA) for four days and co-cultured in flat bottom 96 or 384 well plates at the 1:1 ratio with myeloid cells separated from peripheral blood or biopsies of meningioma patients. Cell cultures were incubated at 37°C and 5% CO2 in arginine free-RPMI (Biological Industries, Kibbutz Beit Haemek, Israel), supplemented with 150 μM arginine, 10% FBS. Proliferation of T cells was evaluated by assessing the signal of CellTrace on CD3+ cells and TruCount™ tubes (BD Biosciences) were used to determine the absolute number of CD3+ cells in the samples. Immunosuppression was calculated considering the absolute number of proliferating T cells, or analyzing the percentage of proliferating cells from generation 3 onwards as assessed by CellTrace profile. In both cases data were normalized assuming the proliferation of T cells cultured alone as 100%.
Cytological preparations and May-Grünwald-Giemsa (MGG) staining . Cytospins were obtained by centrifuging 2.5 × 10⁴ cells on microscope slides by Shandon Cytospin 3 centrifuge. MGG staining was performed using the MGG kit for smears (Bio-Optica), following manufacturer's instructions. Cell morphology was examined using a Olympus BX-40 microscope (Leica Microsystems) with Leica lenses at 40 × magnification. Pictures were taken using a Leica DFC 295 camera (Vashaw Scientific Inc) and acquired with Leica Application Suite Version 4.1.0 (Meyer Instruments).
Statistical analysis . Mann-Whitney U-test was used to compare the groups of samples. Differences were considered statistically significant with P<0.05. All statistical analyses were performed using the Sigmaplot software (Systat Software Inc., CA, USA). Absence of significance was not reported for brevity.
Abbreviations
| ARG-1 | = | Arginase-1 |
| eMDSC | = | early MDSC |
| FACS | = | fluorescence- activated cell sorting |
| FMO | = | fluorescence minus one |
| FSC | = | forward scatter |
| HD | = | healthy donors |
| IL4Rα | = | α chain of interleukin 4 receptor |
| LAG-3 | = | lymphocyte-activation gene 3 |
| Lin | = | lineage cocktail |
| MDSC | = | myeloid-derived suppressor cell |
| MDSC-LC | = | MDSC-like cells |
| MDSC 1 | = | CD14+/IL4Rα+ cells |
| MDSC 2 | = | CD15+/IL4Rα+ cells |
| MDSC 3 | = | Lin−/HLA-DR−/CD11b+/CD33+ cells |
| MDSC 4 | = | CD14+/HLA-DRlow/− cells |
| MG | = | meningioma |
| MGG | = | May-Grünwald Giemsa |
| M-MDSC | = | monocytic MDSC |
| n | = | number |
| NA | = | not applicable |
| PBMC | = | peripheral blood mononuclear cell |
| PBL | = | peripheral blood leukocytes |
| PD-1 | = | programmed death 1 |
| PD-L1 | = | Programmed death-ligand 1 |
| PMN | = | polimorphonuclear cell |
| PMN-MDSC | = | polymorphonuclear MDSC |
| SD | = | standard deviation |
| SE | = | standard error |
| SSC | = | side scatter |
| TAM | = | tumor-associated macrophage |
| TIM-3 | = | T cell immunoglobulin and mucin protein 3 |
| WHO | = | World Health Organization |
Ethical approval
All procedures performed in studies involving human participants were in accordance with the ethical standards of the institutional and/or national research committee and with the 1964 Helsinki declaration and its later amendments or comparable ethical standards.
Informed consent
Informed consent was obtained from all individual participants included in the study.
Disclosure of potential conflicts of interest
No potential conflicts of interest were disclosed.
2017ONCOIMM0965R1-f04-z-4c.pptx
Download MS Power Point (333.4 KB)2017ONCOIMM0965R1-f05-z-4c.pptx
Download MS Power Point (429.2 KB)Additional information
Funding
References
- Dubinski D, Wolfer J, Hasselblatt M, Schneider-Hohendorf T, Bogdahn U, Stummer W, Wiendl H, Grauer OM. CD4+ T effector memory cell dysfunction is associated with the accumulation of granulocytic myeloid-derived suppressor cells in glioblastoma patients. Neuro Oncol. 2016;18:807–18. doi:10.1093/neuonc/nov280. PMID:26578623
- Gielen PR, Schulte BM, Kers-Rebel ED, Verrijp K, Petersen-Baltussen HM, ter Laan M, Wesseling P, Adema GJ. Increase in both CD14-positive and CD15-positive myeloid-derived suppressor cell subpopulations in the blood of patients with glioma but predominance of CD15-positive myeloid-derived suppressor cells in glioma tissue. J Neuropathol Exp Neurol. 2015;74:390–400. doi:10.1097/NEN.0000000000000183. PMID:25853692
- Mandruzzato S, Brandau S, Britten CM, Bronte V, Damuzzo V, Gouttefangeas C, Maurer D, Ottensmeier C, van der Burg SH, Welters MJ, et al. Toward harmonized phenotyping of human myeloid-derived suppressor cells by flow cytometry: results from an interim study. Cancer Immunol Immunother. 2016;65:161–9. doi:10.1007/s00262-015-1782-5. PMID:26728481
- Domingues P, Gonzalez-Tablas M, Otero A, Pascual D, Miranda D, Ruiz L, Sousa P, Ciudad J, Gonçalves JM, Lopes MC, et al. Tumor infiltrating immune cells in gliomas and meningiomas. Brain Behav Immun. 2016;53:1–15. doi:10.1016/j.bbi.2015.07.019. PMID:26216710
- Damuzzo V, Solito S, Pinton L, Carrozzo E, Valpione S, Pigozzo J, Arboretti Giancristofaro R, Chiarion-Sileni V, Mandruzzato S. Clinical implication of tumor-associated and immunological parameters in melanoma patients treated with ipilimumab. Oncoimmunology. 2016;5:e1249559. doi:10.1080/2162402X.2016.1249559. PMID:28123888
- Mondanelli G, Ugel S, Grohmann U, Bronte V. The immune regulation in cancer by the amino acid metabolizing enzymes ARG and IDO. Curr Opin Pharmacol. 2017;35:30–9. doi:10.1016/j.coph.2017.05.002. PMID:28554057
- Pinton L, Solito S, Damuzzo V, Francescato S, Pozzuoli A, Berizzi A, Mocellin S, Rossi CR, Bronte V, Mandruzzato S. Activated T cells sustain myeloid-derived suppressor cell-mediated immune suppression. Oncotarget. 2016;7:1168–84. doi:10.18632/oncotarget.6662. PMID:26700461
- Blackburn SD, Shin H, Haining WN, Zou T, Workman CJ, Polley A, Betts MR, Freeman GJ, Vignali DA, Wherry EJ. Coregulation of CD8+ T cell exhaustion by multiple inhibitory receptors during chronic viral infection. Nat Immunol. 2009;10:29–37. doi:10.1038/ni.1679. PMID:19043418
- Grosso JF, Goldberg MV, Getnet D, Bruno TC, Yen HR, Pyle KJ, Hipkiss E, Vignali DA, Pardoll DM, Drake CG. Functionally distinct LAG-3 and PD-1 subsets on activated and chronically stimulated CD8 T cells. J Immunol. 2009;182:6659–69. doi:10.4049/jimmunol.0804211. PMID:19454660
- Galon J, Mlecnik B, Bindea G, Angell HK, Berger A, Lagorce C, Lugli A, Zlobec I, Hartmann A, Bifulco C, et al. Towards the introduction of the ‘Immunoscore’ in the classification of malignant tumours. J Pathol. 2014;232:199–209. doi:10.1002/path.4287. PMID:24122236
- Bronte V, Brandau S, Chen SH, Colombo MP, Frey AB, Greten TF, Mandruzzato S, Murray PJ, Ochoa A, Ostrand-Rosenberg S, et al. Recommendations for myeloid-derived suppressor cell nomenclature and characterization standards. Nat Commun. 2016;7:12150. doi:10.1038/ncomms12150. PMID:27381735
- van de Poll MC, Hanssen SJ, Berbee M, Deutz NE, Monbaliu D, Buurman WA, Dejong CH. Elevated plasma arginase-1 does not affect plasma arginine in patients undergoing liver resection. Clin Sci (Lond). 2008;114:231–41. doi:10.1042/CS20070143. PMID:17708746
- Rotondo R, Bertolotto M, Barisione G, Astigiano S, Mandruzzato S, Ottonello L, Dallegri F, Bronte V, Ferrini S, Barbieri O. Exocytosis of azurophil and arginase 1-containing granules by activated polymorphonuclear neutrophils is required to inhibit T lymphocyte proliferation. J Leukoc Biol. 2011;89:721–7. doi:10.1189/jlb.1109737. PMID:21330347
- Bo L, Mork SJ, Nyland H. An immunohistochemical study of mononuclear cells in meningiomas. Neuropathol Appl Neurobiol. 1992;18:548–58. doi:10.1111/j.1365-2990.1992.tb00825.x. PMID:1488087
- Grund S, Schittenhelm J, Roser F, Tatagiba M, Mawrin C, Kim YJ, Bornemann A. The microglial/macrophagic response at the tumour-brain border of invasive meningiomas. Neuropathol Appl Neurobiol. 2009;35:82–8. doi:10.1111/j.1365-2990.2008.00960.x. PMID:19187060
- Asai J, Suzuki R, Fujimoto T, Suzuki T, Nakagawa N, Nagashima G, Miyo T, Hokaku H, Takei A. Fluorescence automatic cell sorter and immunohistochemical investigation of CD68-positive cells in meningioma. Clin Neurol Neurosurg. 1999;101:229–34. doi:10.1016/S0303-8467(99)00052-9. PMID:10622450
- Domingues PH, Teodosio C, Otero A, Sousa P, Ortiz J, Macias Mdel C, Gonçalves JM, Nieto AB, Lopes MC, de Oliveira C, et al. Association between inflammatory infiltrates and isolated monosomy 22/del(22q) in meningiomas. PLoS One. 2013;8:e74798. doi:10.1371/journal.pone.0074798. PMID:24098347
- Domingues PH, Teodosio C, Ortiz J, Sousa P, Otero A, Maillo A, Bárcena P, García-Macias MC, Lopes MC, de Oliveira C, et al. Immunophenotypic identification and characterization of tumor cells and infiltrating cell populations in meningiomas. Am J Pathol. 2012;181:1749–61. doi:10.1016/j.ajpath.2012.07.033. PMID:22982440
- Han SJ, Reis G, Kohanbash G, Shrivastav S, Magill ST, Molinaro AM, McDermott MW, Theodosopoulos PV, Aghi MK, Berger MS, et al. Expression and prognostic impact of immune modulatory molecule PD-L1 in meningioma. J Neurooncol. 2016;130:543–52. doi:10.1007/s11060-016-2256-0. PMID:27624915
- Damuzzo V, Pinton L, Desantis G, Solito S, Marigo I, Bronte V, Mandruzzato S. Complexity and challenges in defining myeloid-derived suppressor cells. Cytometry B Clin Cytom. 2015;88:77–91. doi:10.1002/cytob.21206. PMID:25504825
- Ugel S, De Sanctis F, Mandruzzato S, Bronte V. Tumor-induced myeloid deviation: when myeloid-derived suppressor cells meet tumor-associated macrophages. J Clin Invest. 2015;125:3365–76. doi:10.1172/JCI80006. PMID:26325033
- Kuang DM, Zhao Q, Peng C, Xu J, Zhang JP, Wu C, Zheng L. Activated monocytes in peritumoral stroma of hepatocellular carcinoma foster immune privilege and disease progression through PD-L1. J Exp Med. 2009;206:1327–37. doi:10.1084/jem.20082173. PMID:19451266
- Du Z, Abedalthagafi M, Aizer AA, McHenry AR, Sun HH, Bray MA, Viramontes O, Machaidze R, Brastianos PK, Reardon DA, et al. Increased expression of the immune modulatory molecule PD-L1 (CD274) in anaplastic meningioma. Oncotarget. 2015;6:4704–16. doi:10.18632/oncotarget.3082. PMID:25609200
- Becker I, Roggendorf W. Immunohistological investigation of mononuclear cell infiltrates in meningiomas. Acta Neuropathol. 1989;79:211–6. doi:10.1007/BF00294381. PMID:2596270
- Fang L, Lowther DE, Meizlish ML, Anderson RC, Bruce JN, Devine L, Huttner AJ, Kleinstein SH, Lee JY, Stern JN, et al. The immune cell infiltrate populating meningiomas is composed of mature, antigen-experienced T and B cells. Neuro Oncol. 2013;15:1479–90. doi:10.1093/neuonc/not110. PMID:23978377
- Mandruzzato S, Solito S, Falisi E, Francescato S, Chiarion-Sileni V, Mocellin S, Zanon A, Rossi CR, Nitti D, Bronte V, et al. IL4Ralpha+ myeloid-derived suppressor cell expansion in cancer patients. J Immunol. 2009;182:6562–8. doi:10.4049/jimmunol.0803831. PMID:19414811