
ABSTRACT
D-2-hydroxyglutarate (D-2HG) is released by various types of malignant cells including acute myeloid leukemia (AML) blasts carrying isocitrate dehydrogenase (IDH) gain-of-function mutations. D-2HG acting as an oncometabolite promotes proliferation, anoikis, and differentiation block of hematopoietic cells in an autocrine fashion. However, prognostic impact of IDH mutations and high D-2HG levels remains controversial and might depend on the overall mutational context. An increasing number of studies focus on the permissive environment created by AML blasts to promote immune evasion. Impact of D-2HG on immune cells remains incompletely understood. Here, we sought out to investigate the effects of D-2HG on T-cells as key mediators of anti-AML immunity. D-2HG was efficiently taken up by T-cells in vitro, which is in line with high 2-HG levels measured in T-cells isolated from AML patients carrying IDH mutations. T-cell activation was slightly impacted by D-2HG. However, D-2HG triggered HIF-1a protein destabilization resulting in metabolic skewing towards oxidative phosphorylation, increased regulatory T-cell (Treg) frequency, and reduced T helper 17 (Th17) polarization. Our data suggest for the first time that D-2HG might contribute to fine tuning of immune responses.
Introduction
The oncometabolite alpha-hydroxyglutaric acid (2-hydroxyglutarate, 2HG) has attracted increasing interest in recent years. Monoallelic point mutations in the enzyme isocitrate dehydrogenase (IDH), which occur amongst others in gliomas,Citation1 glioblastoma,Citation2 and acute myeloid leukemia (AML),Citation3 lead to a loss-of-function regarding conversion of isocitrate to α-ketoglutarate (αKG) and a gain-of-function in terms of reducing αKG to the D-enantiomer of 2HG (D-2HG).Citation4,Citation5 Several studies have aimed to delineate the (autocrine) effects of D-2HG on tumor cells. It has been shown that D-2HG is a competitive inhibitor of αKG-dependent dioxygenases (such as histone demethylases and the TET family of 5 mC hydroxylases) and its accumulation leads to profound epigenetic alterationsCitation6 interfering with hematopoietic differentiation.Citation7 In fact, D-2HG is sufficient to promote leukemogenesis with the D-2HG-mediated transformation being reversible.Citation7-Citation9 D-2HG abundance has also been linked to changes in the cellular redox equilibrium yielding an increased reactive oxygen species (ROS) production, with oxidative stress being one of the hallmarks of cancer.Citation10 In addition to redox metabolism, bioenergetic pathways also appear to be potential D-2HG targets: introducing mutant IDH and exogenous cell-permeable D-2HG application both promote glutamine metabolism in colorectal cancer cells.Citation11 Moreover, D-2HG has been shown to diminish mitochondrial respiration and respiration-coupled ATP production in glioblastoma cells.Citation12,Citation13 While most studies are focusing on tumor-directed D-2HG effects, its microenvironmental impact and, in particular, its role in AML-mediated immune modulation remains unexplored. To date, a number of immune escape mechanisms have been identified in AML and include depletion of (for activated T-cells) critical nutrients such as tryptophanCitation14 and/or the abundant production of immune regulatory metabolites such as ROS.Citation15 In fact, a recent study on gliomas suggested that D-2HG impairs CD8+ T-cell responses while using IDH inhibitors improved intrinsic antitumor immunity and enhanced the efficacy of a peptide vaccination-based therapy.Citation16 Accordingly, immune cell infiltration has been generally found decreased in mutant IDH gliomas as compared to their wild type counterparts. Another recent report demonstrated in a murine system that accumulation of endogenous D-2HG at physiological concentrations due to an enhanced transaminase activity led to a preferable Th17 over Treg differentiation by epigenetic interference.Citation17
Therefore, we were interested whether D-2HG (that can reach concentrations of 5–35 mmol/L in glioma tissueCitation18 and 2 – 600 µmol/L in AMLCitation19 patients’ serum) holds potential immune regulatory properties by interfering with T-cell function. Our analyses revealed that D-2HG is efficiently taken up by T-cells. This is in accordance with our findings that D-2HG levels can be more than 1000-fold enriched in T-cells from patients with AML blasts that harbor mutant IDH as compared to (a) healthy controls and to (b) AML patients with wild-type IDH. Even at high D-2HG concentrations (of 20 mmol/L) viability, proliferation, and IFNγ production were not negatively affected in T-cells. However, bioenergetics of activated T-cells shifted away from aerobic glycolysis towards respiration, which is at least partly explained by the observed D-2HG-triggered hypoxia inducible factor-1α (HIF-1α) destabilization. In line with previous findings that HIF-1α-dependent (aerobic) glycolysis orchestrates differentiation of Th17 cells,Citation20 we found a reduced Th17 polarization in the presence of D-2HG. Moreover, and in agreement with previous findings that regulatory T-cells (Tregs) rely on oxidative phosphorylation to meet their energetic demands frequencies of Tregs were increased upon D-2HG treatment. Taken together, we show for the first time that exogenous D-2HG has substantial immune metabolic effects on T-cells, establishing a sound basis for further exploring its role for tumor-associated immune modulation especially in view of potential therapeutic strategies.
Results
D-2HG impacts T-cell signaling but not fitness
Different types of malignant cells (including gliomas,Citation21,Citation22 AML,Citation5 and breast cancerCitation23) can abundantly produce and release D-2HG, which is then found in patients’ sera or tumors more than 100-fold increased.Citation4,Citation24,Citation25 Thus, it is of particular interest whether immune cells such as T-cells take up tumor-derived D-2HG. Uptake of exogenously applied non-cell permeable D-2HG by purified healthy control-derived T-cells undergoing activation was evaluated using an enzymatic assay as previously described.Citation26 Intracellular D-2HG levels were found to be increased in a dose-dependent manner showing that T-cells have the ability to enrich exogenous D-2HG (Ai). Furthermore, mass spectrometric analysis revealed a significantly and highly elevated content of 2HG in two out of seven cases of T-cells derived from AML patients as compared to T-cells from healthy donors (HD) (Aii). Notably, 2HG levels were increased in T-cells from AML patients carrying an IDH2 mutation (which represent approx. 10–30% of all AML patients). This finding corroborates the biological relevance of our in vitro model.
Figure 1. Uptake and influence of exogenous D-2HG on survival, proliferation, and activation of T-cells. A) The uptake of D-2HG, exogenously supplied at different concentrations to T-cell cultures (stimulated with anti-CD2/CD3/CD28 coated beads), was measured after an incubation time of 72 h by a colorimetric enzymatic assay (Ai, n = 3). Additionally, intracellular total 2HG (D- and S-enantiomer) levels of T-cells isolated from healthy donors (HD) and AML patients (AML) were quantified by liquid chromatography-mass spectrometry (Aii). Cells were furthermore analyzed regarding the effects on proliferation (B; n = 6), survival (C; n = 11), T-cell receptor signaling (D; n = 4-7), and activation-related surface marker expression as measured by FACS (E; n = 10) upon D-2HG treatment. T-cells were either unstimulated (unstim, grey bars) or stimulated without (0 mM, black) or with (orange) D-2HG at indicated concentrations. FACS plots show analyses from a representative experiment. The Western Blot image shows two representative donors from a total of four. * p < 0.05; ** p < 0.01; ns: not significant; n.d.: not detected.
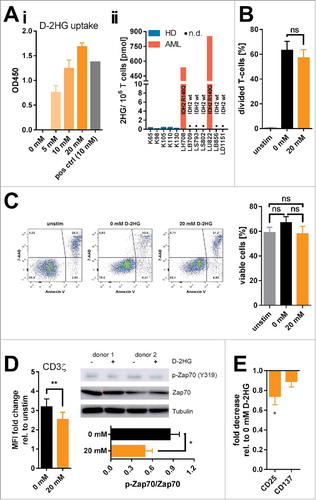
Previously, it has been shown that intracellular D-2HG can influence proliferationCitation23 and viabilityCitation27 of tumor cells. Hence, effects of D-2HG on proliferation were evaluated by means of flow cytometry of T-cells () as well as thymidine incorporation in CD4+ and CD8+ T-cell subsets (Supplemental Fig. 1), and on survival by Annexin V/7-AAD staining (). In fact, we could not detect an impairment of T-cell proliferation or an increase in cell death. However, T-cell receptor activation was slightly but significantly reduced in the presence of 20 mM D-2HG as indicated by the reduction of CD3ζ chain expression and Zap70 phosphorylation (). Activation markers such as CD25 and CD137 were downregulated, although statistical significance was only reached for CD25 expression (). However, a clear time- and dose-dependent effect of D-2HG on T-cell receptor activation could not be observed (Supplemental Fig. 2) unless doses reached toxic values (40 mM). As the observed effects were rather small and transient, we postulate that the general fitness of in vitro cultured T-cells and their ability to respond towards activating stimuli are not impaired by the presence of D-2HG. Nevertheless, there remains the possibility that effects provoked by D-2HG might be subliminal and that the downstream signaling might still be functional because it reaches a sufficient triggering threshold.
D-2HG enhances glucose uptake while skewing bioenergetics away from aerobic glycolysis towards respiration
Activation, function, and differentiation of T-cells are highly dependent on their bioenergetic profile as recently reviewed by Palmer et al. Citation 28 Activated T-cells (like cancer cells) undergo a metabolic switch from oxidative phosphorylation towards aerobic glycolysis to meet their energetic and biosynthetic demands referred to as “Warburg effect”. Hence, interfering with the T-cells’ metabolic framework can substantially impact their function. In fact, a dehydrogenase that converts D-2HG to αKGCitation29 has been identified and could theoretically mediate the entry of high amounts of tumor-derived D-2HG into the T-cells’ tricarboxylic acid (TCA) cycle.
Analysis using fluorescent glucose analogues showed an increase in glucose-uptake when T-cells were activated in the presence of 20 mM D-2HG (Ai-Aii). This effect was time- and dose-dependent (Supplemental Fig. 3). Interestingly, when D-2HG was washed out and T-cells were cultured for three more days in D-2HG-free medium glucose-consumption returned to initial levels (Aiii). At the same time, lactate concentrations as a surrogate for aerobic glycolysis were significantly reduced in the culture medium (), again in a time- and dose-dependent manner (Supplemental Fig. 4). Surface expression of glucose-transporters (GLUTs) was not affected (Supplemental Fig. 5). Since elevation of the intracellular glucose levels can promote global intracellular protein glycosylation,Citation30 which regulates intracellular signaling,Citation31 O-GlcNAcylation was determined by flow cytometry using an antibody specific for O-linked N-acetylglucosamine (RL2). Activation of T-cells increased global O-GlcNAcylation and additional D-2HG treatment elevated it even further (Supplemental Fig. 6).
Figure 2. Changes of glucose metabolism induced by exogenous D-2HG. A) The increase in glucose uptake induced by 20 mM D-2HG supplementation was measured by flow cytometry (FACS) using a fluorescent glucose analog (6NBDG) in a time course (Ai, n = 5-11) or after 72 h (Aii, n = 15) of T-cell culture. D-2HG was subsequently removed from the culture and glucose uptake levels measured again after 72 h (Aiii, 20 mM depr, green bar, n = 5). Each pair of values in panel ii represents T-cells isolated from one particular donor under different culturing conditions. B) Lactate secretion into the cell culture supernatant as a surrogate for glycolysis was measured after 72 h (B, n = 10). C) To evaluate a putative glucose-dependency created by exogenous D-2HG application T-cells were analyzed in terms of their proliferative capacity in presence of reduced glucose availability in the culture medium (Ci, n = 3), and of viability upon hexokinase-2 inhibition by 2DG (Cii, n = 3) after 72 h of culture. T-cells were either unstimulated (unstim, grey) or stimulated without (0 mM, black) or with (20 mM, orange) D-2HG. FACS histograms show one representative analysis. * p<0.05; ** p<0.01; *** p<0.001; ns: not significant.
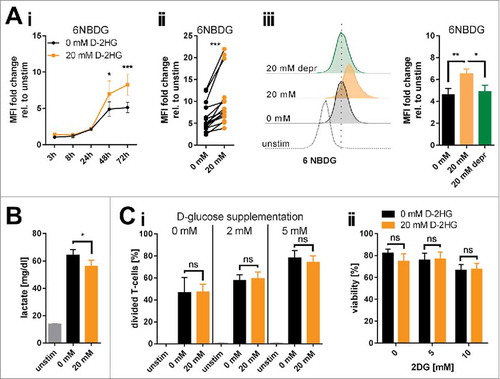
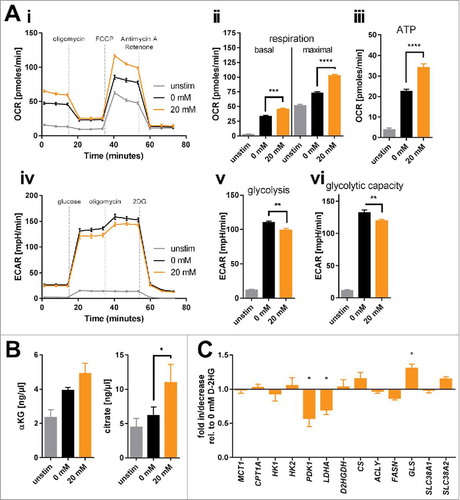
Next, we tested whether D-2HG treatment yields glucose-dependency. Viability and proliferation of D-2HG-treated T-cells compared to untreated counterparts were not affected by glucose restriction or by pharmacologically blocking the glycolytic key pacemaker molecule hexokinase-2 using 2-deoxyglucose (2DG) (Ci-ii, Supplemental Fig. 7). To further elucidate metabolic changes caused by exogenous D-2HG, real-time analyses of oxygen consumption rate (OCR, indicative for mitochondrial respiration) as well as of extracellular acidification rate (ECAR, indicative for aerobic glycolysis) were performed using an extracellular flux analyzer (). The sequential addition of inhibitors allowed the calculation of several metabolic parameters as previously detailed.Citation32 Those analyses revealed significantly increased basal and maximal respiration (Aii) as well as an enhanced ATP-production linked to respiration (Aiii) upon D-2HG treatment. At the same time, the rate of basal aerobic glycolysis and the capacity to further enhance glycolysis were both significantly reduced (Av-vi) as already indicated by the decreased lactate levels measured in the supernatants (B). Overall, D-2HG promotes a metabolic switch towards oxidative phosphorylation in activated T-cells (Supplemental Fig. 8). Together with the elevated glucose uptake this data suggests an increased glucose flux into the TCA cycle instead of aerobic glycolysis. Indeed, levels of two TCA-intermediates αKG and citrate were significantly increased (). Mitochondrial biogenesis was not enhanced and mitochondria maintained their electrochemical gradient (=▵ψM) as a surrogate marker for their fitness and coupling efficacy (Supplemental Fig. 9). Furthermore, relative gene expression of LDHA (the enzyme that metabolizes pyruvate to lactate) and PDK1 (the enzyme that blocks oxidative decarboxylation of pyruvate thereby preventing its entry into the TCA cycle) were significantly downregulated, while other metabolic genes remained mostly unaffected (). The only significantly upregulated gene was GLS, which can metabolize glutamine to glutamate to either replenish the TCA cycle and/or the hexosamine biosynthesis pathway enabling amongst others increased protein glycosylation.
Figure 3. Bioenergetic modulation of T-cells by exogenous D-2HG. A) Mitochondrial respiration of T-cells cultured in the absence or presence of D-2HG for 72 h was analyzed in real-time using the Seahorse extracellular flux analyzer. Oxygen consumption rate (OCR) was recorded (Ai) and respiratory parameters were calculated (Aii-iii) after sequential addition of oligomycin, FCCP, and antimycin A/rotenone (n = 4). Likewise, extracellular acidification rate (ECAR) was assessed (Aiv) and glycolytic parameters were calculated (Av-vi) after sequential addition of glucose, oligomycin, and 2DG (n = 4). B) Intracellular concentrations of two representative intermediates of the TCA cycle (α-ketoglutarate: αKG, n = 3 and citrate, n = 5) were enzymatically determined. C) The expression of key metabolic genes was quantified by real-time PCR (n = 3-12). T-cells were either unstimulated (unstim, grey) or stimulated without (0 mM, black) or with (20 mM, orange) D-2HG. * p < 0.05; ** p < 0.01; *** p < 0.001; **** p < 0.0001.
Based on previous findings that D-2HG acts as a pro-oxidantCitation33 and that an increased respiration () can contribute to abundant mitochondrial ROS releaseCitation34 we assessed various redox parameters in D-2HG treated T-cells. Flow cytometric analysis of total cellular ROS and mitochondrial superoxide levels by means of CellROX and MitoSOX reagents, respectively, showed no differences between untreated and D-2HG treated T-cells (Supplemental Fig. 10). Levels of surface thiols and intracellular glutathione as the major non-enzymatic cellular antioxidants together with the expression of a number of enzymatic antioxidants were also not impacted by D-2HG (Supplemental Figs. 11 and 12).
D-2HG has no impact on T-cell IFNγ production and senescence, but on Treg frequency
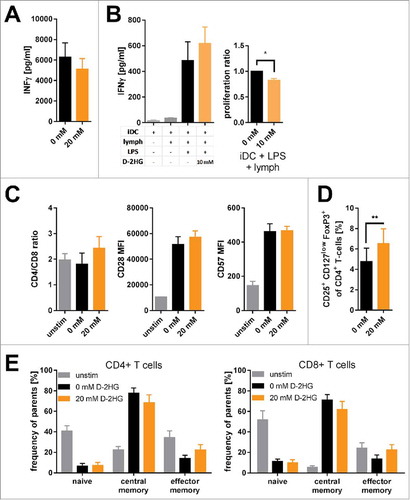
As previously reviewedCitation28, T-cell metabolism is tightly interconnected with differentiation and function. First, we evaluated the impact of D-2HG on the T-cells’ IFNγ production. Despite reduced CD3ζ chain expression and Zap70 phosphorylation () we observed constant levels of IFNγ ( and Supplemental Fig. 13). In line, D-2HG had no impact on IFNγ secretion by T-cells activated with allogeneic dendritic cells; however, proliferation was slightly affected (B). Impact on the CD4+ to CD8+ T-cell ratio and induction of senescence as measured by the surface expression of CD28 (which would be reduced) and CD57 (which would be increased) was not observed (). Cytotoxic potency as exemplified by the expression of TNFα and perforin in CD4+ and CD8+ T-cell subsets was not altered either (Supplemental Fig. 14). Since reduction of aerobic glycolysis accompanied by an increase in oxidative phosphorylation has also been reported to favor regulatory T-cells (Tregs),Citation35 we evaluated the impact of D-2HG on their frequency. Indeed, D-2HG promoted the frequency of CD25+ CD127low FoxP3+ naturally occurring-like Tregs (). Furthermore, T-cell subsets were defined according to Mahnke et al Citation 36 as CD45RO−CCR7+ (naïve), CD45RO+CCR7+ (central memory), and CD45RO+CCR7− (effector memory) cells in the respective CD4+ and CD8+ T-cell compartment. Despite reports about the importance of oxidative phosphorylation for T-cell memory formationCitation37 we did not detect any D2-HG induced changes in the frequencies of naïve, central memory, and effector memory T-cells (). Accordingly, the relative expression levels of genes involved in memory T-cell formation were not altered as well (Supplemental Fig. 15).
Figure 4. Impact of exogenous D-2HG on T-cell function. A) IFNγ secretion by anti- CD2/CD3/CD28 stimulated T-cells was determined by sandwich ELISA (n = 9). B) Mixed lymphocyte reactions were performed to analyze T-cell function. Immature dendritic cells (iDC) were co-cultured with T-cells (lymph) with/without LPS in the absence (0 mM) or presence (10 mM) of D-2HG. Both, the secretion of IFNγ (left panel) and T-cell proliferation (right panel) were measured by sandwhich-ELISA and thymidine intake, respectively. C) The ratio of CD4+ to CD8+ T-cells as well as the surface expression of CD28 and CD57 were analyzed after 72 h of anti-CD2/CD3/CD28 stimulation by flow cytometry (FACS) to evaluate T-cell senescence (n = 3). D) The frequency of regulatory T-cells amongst pan T-cells after stimulation with anti-CD2/CD3/CD28 for 72 h was determined by FACS (n = 9). E) Frequency of naïve (CD45RO−CCR7+), central memory (CD45RO+CCR7+) and effector memory (CD45RO+CCR7−) T-cell subsets of CD4+ (left) and CD8+ (right) T-cells stimulated for 72 h with and without anti-CD2/CD3/CD28 were measured by FACS (n = 3). T-cells were either unstimulated (unstim, grey) or stimulated without (0 mM, black) or with (orange) D-2HG at indicated concentrations. * p<0.05; ** p<0.01.
D-2HG activates mTOR signaling but destabilizes HIF-1α resulting in diminished Th17 cell formation
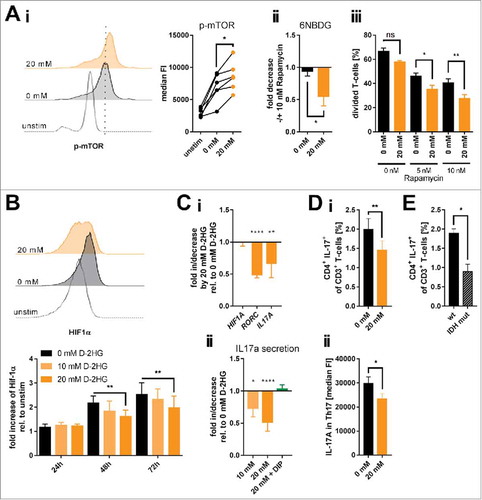
As shown in previous publications, mTOR signaling holds a key role in cellular metabolism. It regulates mitochondrial oxygen consumption,Citation38 glucose uptake,Citation39 and nutrient utilizationCitation40 by governing expression and/or activity of metabolic enzymes.Citation41 In fact, mutant IDH-expressing cell lines showed enhanced mTOR signaling.Citation42 In line with the increased glucose uptake and mitochondrial respiration we observed enhanced mTOR signaling as suggested by the levels of phosphorylated mTOR (Ai) and its downstream target 4EBP1 (Supplemental Fig. 16) while gene expression levels remained unaltered (Supplemental Fig. 17i). Accordingly, we confirmed a previously reported D-2HG-triggered suppression of the DEPTOR protein expression that acts as an endogenous mTOR inhibitor (Supplemental Fig. 17ii).Citation42 Moreover, treating activated T-cells with 20 mM D-2HG led to a substantial mTOR signaling-addiction. Blocking mTOR by rapamycin had a stronger effect on D-2HG treated T-cells in terms of reducing glucose uptake and diminishing proliferation as compared to their untreated counterparts (Aii-iii).
Figure 5. Influence of exogenous D-2HG on mTOR activation, HIF-1α protein stability and resulting Th17 formation. A) Activation of the mTOR signaling pathway (Ai; n = 6) as a function of the level of mTOR phosphorylation (p-mTOR) and the impact of mTOR inhibition by rapamycin on glucose uptake (Aii; n = 4) and T-cell proliferation (Aiii; n = 3) upon D-2HG treatment were measured by flow cytometry (FACS). Each pair of values in panel i represents T-cells isolated from one particular donor under different culture conditions. B) In addition, HIF-1α protein expression levels were analyzed by FACS showing one representative FACS analysis after 72 h (upper panel) and the averages of repeated measures in a time-course (n = 3, lower panel). C) Relative gene expression of HIF1A, RORC, and IL17A (Ci, n = 8-23) and IL-17A secretion (Cii, n = 5-10) by in vitro cultured T-cells treated for 24 h with D-2HG were measured by quantitative real-time PCR and sandwich-ELISA, respectively. In addition, IL-17 secretion was measured in the presence of the hypoxia mimetic DIP that stabilizes HIF-1α (green bar). D) Anti-CD2/CD3/CD28 stimulated T-cells were restimulated after 72 h of culture with PMA/Ionomycin in the presence of GolgiPlug™ for 4 h and analyzed for the Th17 frequency (i, n = 8) and the intracellular IL-17 A content (ii, n = 8). E) Finally, PBMCs from AML patients without (wt) and with IDH mutation (IDH mut) were compared by flow cytometry for their Th17 frequency after 4 h of in vitro stimulation with PMA/Ionomycin in the presence of GolgiPlug™ (n = 3-7). T-cells were either unstimulated (unstim) or stimulated in the absence (0 mM, black) or presence (orange) of D-2HG at the given concentrations. FACS histograms show one representative analysis. * p<0.05; ** p<0.01; *** p<0.001; **** p<0.0001; ns: not significant.
The increased mTOR activity is also in line with the aforementioned results on increased O-glycosylation (Supplemental Fig. 6). The responsible enzyme O-GlcNAc transferase (OGT) can be controlled by mTORCitation31 and both immunofluorescence and Western Blot analyses revealed an increase in OGT level upon D-2HG treatment (Supplemental Fig. 18).
Increased mTOR activity was also shown to enhance HIF-1α expression.Citation43 However, mutated IDH and intracellular 2-HG accumulation promote prolyl hydroxylase activity that targets the HIF-1α protein stability.Citation44 Treating T-cells with D-2HG reduced HIF-1α protein levels in a time- and dose-dependent manner (). HIF-1α gene expression was not impacted (Ci). The HIF-1α protein reduction was accompanied by a diminished RORC and IL17A gene expression as well as IL-17 A secretion (Ci-ii and Supplemental Fig. 13), which are in line with data linking the HIF-1α-aerobic glycolysis axis with Th17 polarization.Citation45 Those effects were specific for the oncometabolic D-enantiomer and could not be reproduced with the S-enantiomer of 2HG (Supplemental Fig. 19). Chemical induction of HIF-1α using the iron chelator 2,2′-dipyridyl (DIP) promoted the gene expression of IL17A and MYC (as another target gene of HIF-1α) (Supplemental Fig. 20) and also restored the IL-17A secretion in the presence of D-2HG (Cii). Those findings are further corroborated by our observation that D-2HG treatment reduced the frequency of Th17 cells (Di) and also the IL-17 levels within the Th17 population (Dii). Ultimately, comparing Th17 frequencies within PBMCs from AML patients harboring IDH mutations with wildtype AML counterparts revealed a significantly reduced fraction of IL-17+ CD4 T-cells in the specimen from IDH-mutated AML cases ().
Discussion
Accumulation of the oncometabolite D-2HG in several tumor entities including AML,Citation4,Citation18,Citation23,Citation25 and its prognostic impactCitation23 have raised interest in elucidating its role in cancer development and progression. To date, the vast majority of studies have focused on the autocrine tumor-directed D-2HG effects. D-2HG levels are found up to 100-fold increased in tumor cells and patients’ sera and affect pleiotropically the oncogenic potential by epigenetic alterations,Citation6 enhanced proliferation and differentiation arrest,Citation8 preferential glutamine utilization,Citation11,Citation23 abundant ROS production,Citation10 interference with mitochondrial metabolism,Citation12,Citation13 and mTOR signaling.Citation42 However, little is known about the effects of D-2HG in shaping the microenvironmental immune components. In fact, tumor cells can alter immune responses by depleting nutrients critical for immune cells such as tryptophanCitation14 and/or by abundantly releasing immune regulatory metabolic byproducts such as lactic acid.Citation46 Recent studies suggest (at least indirectly) that D-2HG affects T-cells since IDH mutations were associated with a rather limited intratumoral T-cell infiltration.Citation16,Citation47 In fact, treating healthy donor-derived T-cells with D-2HG leads to its intracellular accumulation, although it is non-cell permeable and its mode of transport remains elusive. The biological relevance of this observation is further underlined by the fact that we report for the first time increased D-2HG levels in T-cells isolated from AML patients harboring IDH2 mutations. No negative effects on T-cell viability, proliferation, cytotoxic capacity, and IFNγ secretion were observed, which is in contrast to recent findings about the impact of physiologically low levels of the S-enantiomer (S-2HG) on murine CD8+ T-cells under hypoxia upon TCR stimulation showing a decrease in effector cytokine secretion and cell expansion.Citation48 However, a transient reduction of TCR downstream signaling intensity as exemplified by reduced CD3ζ and CD25 expression and lower Zap70 phosphorylation levels could be documented. It is likely that the D-2HG-induced effects on TCR signaling are not strong enough to prevent an effective downstream signaling and, thus, still allow achieving a sufficient threshold that triggers e.g. effector cytokine production. Moreover, the observed reduction of T-cell proliferation in MLR in the presence of D-2HG cannot be attributed to a direct influence but may also be indirectly mediated by affecting the dendritic cells.
To date, it is well established that the so-called metabolic signaling holds a key role in governing most aspects of T-cell biology.Citation28,Citation49,Citation50 Activated T-cells undergo metabolic reprogramming that involves the rapid induction of aerobic glycolysis and anabolic reactions. This initial metabolic transition towards aerobic glycolysis is strongly associated with the mTOR pathway. In fact, abundant D-2HG production has been reported to promote a PI3K/AKT-independent mTOR activation.Citation42 One of the proposed and by us confirmed underlying mechanisms is a D-2HG-mediated reduction of the endogenous negative regulator of mTOR activity called DEPTOR.Citation42,Citation51,Citation52 We observed enhanced levels of mTOR phosphorylation (with unaltered MTOR gene expression together with DEPTOR protein reduction) upon D-2HG application that were accompanied by numerous known downstream phenomena including increased glucose influx,Citation39 glycosylation,Citation31 and mitochondrial respiration.Citation38 Despite enhanced glucose uptake aerobic glycolysis rate was found decreased leading to an overall metabolic skewing towards oxidative phosphorylation suggesting that the glucose flux is mainly fueling the TCA cycle. In fact and in line with this rationale, we found increased levels of TCA cycle intermediates (i.e. αKG and citrate) in D-2HG treated T-cells while expression of pyruvate dehydrogenase kinase 1 (PDK1) that blocks the entry of pyruvate into the TCA cycle was downregulated. Moreover, the TCA cycle could also be additionally replenished by an anaplerotic conversion of the abundant D-2HG to αKG by D-2HG dehydrogenase,Citation53 which obviously requires further elucidation. Likewise, an anaplerosis of the TCA cycle might occur via glutaminolysis as seen by the significant induction of glutaminase (GLS) by D-2HG treatment. However, T-cells cultured in glutamine-free medium did not show any additional impairments in terms of viability and proliferation upon D-2HG addition (data not shown). Thus, this pathway seems to be dispensable in this context.
In addition to mTOR, metabolic transition towards aerobic glycolysis (upon T-cell stimulation) is driven by HIF-1α that, among other functions, regulates expression of LDHA and PDK1.Citation54-Citation56 Indeed, we observed HIF-1α protein destabilization upon D-2HG treatment and in line reduced LDHA and PDK1 expression following D-2HG uptake. In fact, earlier publications have shown that IDH mutations together with D-2HG accumulation negatively impact HIF-1α stability by promoting proteasomal degradation after activation of the HIF-1α specific prolyl hydroxylases (EglNs) in malignant cells.Citation8,Citation44 Thus, reduced HIF-1α signaling could contribute to the observed metabolic shift away from aerobic glycolysis towards oxidative phosphorylation despite substantial mTOR activation, which otherwise would enhance HIF-1α transcriptional activity in case HIF-1α protein is stably expressed.Citation43
As previously mentioned, metabolic signaling is tightly linked to T-cell function and differentiation. Certain metabolic profiles are linked to specific T-cell subsets. Regulatory T-cells (Tregs) as well as memory T-cells have been shown to exhibit a reduced glycolytic activity and to rely more on oxidative phosphorylation (and fatty acid oxidation), while effector T-cell subsets meet their energetic demand by aerobic glycolysis.Citation49 Thus, we reasoned that the D-2HG induced shift towards oxidative phosphorylation might increase the frequency of Tregs and/or memory T-cells. Indeed, we observed enhanced frequencies of Tregs upon treatment with D-2HG suggesting an additional link between neoplasia-derived D-2HG as a bioactive metabolite and immune modulation. Still, it remains to be elucidated whether enhanced respiratory capacity induced by D-2HG uptake in T-cells increases Treg formation or if Treg survival/persistence is simply favored by elevated levels of tumor-derived D-2HG due to so far unexplored selection mechanisms as seen e.g. for ROSCitation57,Citation58 or lactate.Citation59 On the other hand, we could not detect any changes in the formation of memory T-cells. Furthermore, several studies also demonstrated that an effective anti-tumor functionality of T-cells within the tumor microenvironment is largely depending on their glycolytic activity rather than oxidative phosphorylation in vivo.Citation60 Although we did not detect impairments of T-cell cytotoxicity in our in vitro system, the influence of D-2HG via metabolic interference on tumor eradication by T-cells in the in vivo situation clearly has to be further examined (in preclinical models). Additionally, enhanced oxidative phosphorylation (caused by enhanced mitochondrial biogenesis and fitness) was also shown to increase the production of ROSCitation34 which in turn are amongst others important for a proper (antigen-specific) T-cell activationCitation61,Citation62 as well as HIF-1α stabilization.Citation63 However, in our setup we could not detect any changes in neither total cellular nor mitochondrial ROS levels upon D-2HG application. Since ROS production is already induced by (anti-CD2/CD3/CD28) TCR stimulation in vitro, D-2HG seems to be dispensable for ROS-mediated functions/signaling in this setup. Obviously, this needs to be further explored with in vivo models.
Beyond that, binding of HIF-1α further enhances transcription of Th17-specific genes and finally Th17 polarization. Consequently, D-2HG-mediated HIF-1α destabilization led to reduced expression of the prototypical Th17 transcription factor RORC as well as IL-17A secretion. Both phenomena were restored by chemical stabilization of HIF-1α. Accordingly, D-2HG numerically reduced Th17 cells that additionally showed less IL-17 production (per cell) further strengthening the overall effect. Finally, upon stimulation the frequency of Th17 cells in AML patient-derived samples was reduced in those having AML clones with mutated IDH in contrast to their wildtype counterparts supporting the biological relevance of our findings. Thus, D-2HG contributes to reduced expression of RORC and IL-17 in T-cells thereby diminishing Th17 polarization. However, the role of Th17 cells in AML prognosis and progression is still under debate.Citation64-Citation66 While some studies show increased levels of Th17 cells in the peripheral blood of AML patients being associated with poor prognosis,Citation64,Citation67 others demonstrate a decreased frequency of Th17 cells and related cytokines in newly diagnosed AML patients with an amelioration of those differences upon chemotherapy.Citation65,Citation68 In addition, Th17 cells are known to be an important player in the clearing of infectionsCitation69 being one of the major causes of morbidity and mortality in AML.Citation70 Noteworthy, in contrast to our observations, a recent publication demonstrated a dysbalance between Th17 and Treg cells in favor of Th17 cells driven by induced 2HG accumulation (via transaminase activity or application of cell-permeable dimethyl-2HG) in a murine system of autoimmunity.Citation17 The differences might be explained by species-related differences or the use of a cell-permeable dimethyl-2HG as an exogenous supply in contrast to the here used non-permeable D-2HG disodium salt.
Taken together, our data suggests that abundantly produced D-2HG in tumors that harbor IDH mutations such as AML and glioma may act (in addition to its oncometabolic potential) as a novel immunometabolic modulator. The T-cells’ bioenergetics are shifted towards oxidative phosphorylation and interference with the stability of the pro-glycolytic HIF-1α diminishes the formation of pro-inflammatory Th17 cells and favors the abundance of Tregs. Self-evidently, more studies on the D-2-HG's impact on the various components of the patient's immune system will be necessary in order to put our observation into the context of both anti-tumor immunity as well as protection from infections that are major causes of mortality and morbidity during disease progression.
Materials and methods
Patient material
Peripheral blood mononuclear cells (PBMCs) from both AML patients and healthy donors (HD) were collected upon approval by the local ethics committee (approval number: 219_14B) and participants’ written informed consent in accordance with the Declaration of Helsinki.
Antibodies and primers
Antibodies and primers were purchased and used according to the tables 1–4 in supplemental information.
Cell culture
T-cells were isolated from healthy donor-derived human PBMCs using the Pan T-cell Isolation Kit (Miltenyi Biotec, 130-096-535) according to the manufacturer's instructions. Cells were cultured at a density of 1 × 10⁶/ mL in RPMI1640 (ThermoFisher Scientific, 31870074) supplemented with 2 mM L-Glutamine (Sigma-Aldrich, G7513), 10% FCS (PAN BioTech, P30-3302) and 40 U/ mL Penicillin-Streptomycin (ThermoFisher Scientific, 15140122) for 72 h at 37°C and 5% CO2 atmosphere if not stated otherwise. To stimulate the cells T-cell activation/expansion beads coated with anti-CD2/CD3/CD28 (Miltenyi biotec, 130-091-441) at a bead:T-cell ratio of 1:2 were used.
For restimulation of healthy donor-derived T-cells after 72 h of culture in presence/absence of D-2HG, as well as for ex vivo analysis of Th17 cells from AML PBMCs, cells were treated with 50 ng/ mL PMA and 1 µg/ mL ionomycin in the presence of GolgiPlug™ (as recommended by the manufacturer) for 4–6 h at 37°C and 5% CO2.
Flow cytometry
Proliferation was analyzed by staining T-cells with Violet Proliferation Dye 450 (BD Bioscience, 562158) according to the manufacturer's instructions.
Cell death was determined by staining with Annexin V-FITC (Biolegend, 640906) using the according buffer (Biolegend, 422201) in combination with 7AAD (Biolegend, 420404) as described by the manufacturer.
All surface and intracellular stainings included a dead cell exclusion using Zombie AquaDye (Biolegend, 423102). Cells were washed in PBS and blocked with Human TruStain FcX™ (Biolegend, 422302) and polyclonal mouse IgG (Dianova, 015-000-003) prior to the staining. Intracellular staining was performed with a Fixation/Permeabilization Solution Kit (BD Bioscience, 555028). Intranuclear staining was performed using the Foxp3/Transcription Factor Staining Buffer Set (eBioscience, 00-5523-00) according to the manufacturer's instructions. Antibodies were incubated at the recommended concentrations for 20 – 45 min at 4°C.
Glucose uptake was analyzed using the fluorescent glucose analog 6-NBDG (ThermoFisher Scientific, N23106). Cells were washed in PBS and glucose-free medium by centrifugation (300 x g, 6 min, 4°C) and resuspended in 300 µL of glucose-free medium containing 0.3 mM 6-NBDG. Samples were incubated for 15 min at 37°C, 5% CO2 and subsequently recorded after two washing steps.
To analyze cellular redox-parameters, the anti-oxidative capacity, and the mitochondrial biomass and fitness CellROX® Deep Red Reagent (ThermoFisher Scientific, C10422) and MitoSOX™ Red (ThermoFisher Scientific, M36008), ThiolTracker™ Violet (ThermoFisher Scientific, T10095) and Alexa Fluor® 633 C5 Maleimide (ThermoFisher Scientific, A20342) as well as MitoTracker® Green (ThermoFisher Scientific, M7514) and JC-1 (Cayman Chemicals, 10009172) were used respectively according to the compounds’ manuals.
Extracellular flux analysis
One day prior to measurements, Seahorse XFe96 culture plates (Agilent/Seahorse Bioscience) were coated with Corning™ Cell-Tak Cell and Tissue Adhesive (BD, 354241) according to the manufacturer's recommendations. A Seahorse XFe96 cartridge (Agilent/Seahorse Bioscience) was loaded with XF Calibrant solution (Agilent/Seahorse Bioscience) and incubated overnight in a CO2-free atmosphere. The next day, cells were harvested from the culture, washed in assay-specific medium according to the manufacturer's recommendations and viable cells were automatically counted on a Muse® Cell Analyzer (Merck Millipore). The cells were seeded at a density of 2.4 × 10⁵ T-cells in 175 µL per well. The ports of the Seahorse cartridge were loaded with 25 µL each of 80 mM glucose, 9 µM oligomycin, and 1 M 2DG for the glycolysis stress test and 20 µL of 10 µM oligomycin, 22 µL of 15 µM FCCP, and 25 µL of 30 µM antimycin A/rotenone for the mitochondrial stress test. After sensor calibration, assays were run as detailed in the manufacturer's manual by recording ECAR (extracellular acidification rate) and OCR (oxygen consumption rate). Metabolic parameters were obtained from the XF Wave software (Agilent/Seahorse Biosciences) and calculated using Microsoft Excel.
Statistics
Statistics were calculated with Graphpad Prism Version 7 (La Jolla, California, USA). Comparisons between groups were performed using the appropriate statistical methods depending on Gaussian distribution and number of groups and variables, i.e. one-way ANOVA with Tukey's post-hoc test, two-way ANOVA with Bonferroni post-hoc test, unpaired and paired two-tailed t-test, and Mann-Whitney test.
Abbreviations
| 2DG | = | 2-deoxglucose |
| αKG | = | α-ketoglutarate |
| D-2HG | = | D-2-hydroxyglutarate |
| DIP | = | 2’2-dipyridyl |
| ECAR | = | extracellular acidification rate |
| GLUT | = | glucose transporter |
| HD | = | healthy donor |
| HIF-1α | = | hypoxia inducible factor-1α |
| OCR | = | oxygen consumption rate |
| OGT | = | O-linked N-acetylglucosamine (GlcNAc) transferase |
| ROS | = | reactive oxygen species |
| TCA | = | tricarboxylic acid |
| Treg | = | regulatory T-cell |
Disclosure of potential conflicts of interest
No potential conflicts of interest were disclosed.
Author contributions
DM, MB, and MK conceived the project and designed experiments. MB and DM wrote the manuscript. MB and KR designed, conducted, and supervised experiments and analyzed data. KR and MK provided essential intellectual input and contributed to the manuscript. RB and KM conducted experiments and contributed to the manuscript. RB, ST, EZC, KD, and PJO performed experiments, provided essential technical help, and reagents/analytical tools. AM provided intellectual input for project design.
supplementary.docx
Download MS Word (4.5 MB)Acknowledgment
We thank Dr. Christina Warnecke for valuable hints regarding HIF-1α stabilization. DM was supported by the IZKF Erlangen Project D27, the Else Kröner-Fresenius-Stiftung, and the CRC/TR221-DFG Project A06. The study was furthermore supported by the KFO262 (DFG).
Additional information
Funding
Related Research Data
References
- Yan H, Parsons DW, Jin G, McLendon R, Rasheed BA, Yuan W, Kos I, Batinic-Haberle I, Jones S, Riggins GJ, et al. IDH1 and IDH2 mutations in gliomas. N Eng J Med. 2009;360:765–73. doi:10.1056/NEJMoa0808710.
- Parsons DW, Jones S, Zhang X, Lin JC, Leary RJ, Angenendt P, Mankoo P, Carter H, Siu IM, Gallia GL, et al. An integrated genomic analysis of human glioblastoma multiforme. Science. (New York, NY) 2008;321:1807–12. doi:10.1126/science.1164382. PMID:18772396.
- Mardis ER, Ding L, Dooling DJ, Larson DE, McLellan MD, Chen K, Koboldt DC, Fulton RS, Delehaunty KD, McGrath SD, et al. Recurring mutations found by sequencing an acute myeloid leukemia genome. N Eng J Med. 2009;361:1058–66. doi:10.1056/NEJMoa0903840.
- Dang L, White DW, Gross S, Bennett BD, Bittinger MA, Driggers EM, Fantin VR, Jang HG, Jin S, Keenan MC, et al. Cancer-associated IDH1 mutations produce 2-hydroxyglutarate. Nature. 2009;462:739–44. doi:10.1038/nature08617. PMID:19935646.
- Ward PS, Patel J, Wise DR, Abdel-Wahab O, Bennett BD, Coller HA, Cross JR, Fantin VR, Hedvat CV, Perl AE, et al. The common feature of leukemia-associated IDH1 and IDH2 mutations is a neomorphic enzyme activity converting alpha-ketoglutarate to 2-hydroxyglutarate. Cancer Cell. 2010;17:225–34. doi:10.1016/j.ccr.2010.01.020. PMID:20171147.
- Xu W, Yang H, Liu Y, Yang Y, Wang P, Kim SH, Ito S, Yang C, Wang P, Xiao MT, et al. Oncometabolite 2-hydroxyglutarate is a competitive inhibitor of alpha-ketoglutarate-dependent dioxygenases. Cancer Cell. 2011;19:17–30. doi:10.1016/j.ccr.2010.12.014. PMID:21251613.
- Figueroa ME, Abdel-Wahab O, Lu C, Ward PS, Patel J, Shih A, Li Y, Bhagwat N, Vasanthakumar A, Fernandez HF, et al. Leukemic IDH1 and IDH2 mutations result in a hypermethylation phenotype, disrupt TET2 function, and impair hematopoietic differentiation. Cancer Cell. 2010;18:553–67. doi:10.1016/j.ccr.2010.11.015. PMID:21130701.
- Losman JA, Looper RE, Koivunen P, Lee S, Schneider RK, McMahon C, Cowley GS, Root DE, Ebert BL, Kaelin WG Jr., et al. (R)-2-hydroxyglutarate is sufficient to promote leukemogenesis and its effects are reversible. Science. (New York, NY) 2013;339:1621–5. doi:10.1126/science.1231677. PMID:23393090.
- Chaturvedi A, Araujo Cruz MM, Jyotsana N, Sharma A, Goparaju R, Schwarzer A, Görlich K, Schottmann R, Struys EA, Jansen EE, et al. Enantiomer-specific and paracrine leukemogenicity of mutant IDH metabolite 2-hydroxyglutarate. Leukemia. 2016;30:1708–15. doi:10.1038/leu.2016.71. PMID:27063596.
- Shi J, Zuo H, Ni L, Xia L, Zhao L, Gong M, Nie D, Gong P, Cui D, Shi W, et al. An IDH1 mutation inhibits growth of glioma cells via GSH depletion and ROS generation. Neurol Sci. 2014;35:839–45. doi:10.1007/s10072-013-1607-2. PMID:24362902.
- Reitman ZJ, Duncan CG, Poteet E, Winters A, Yan LJ, Gooden DM, Spasojevic I, Boros LG, Yang SH, Yan H. Cancer-associated isocitrate dehydrogenase 1 (IDH1) R132 h mutation and d-2-hydroxyglutarate stimulate glutamine metabolism under hypoxia. J Biol Chem. 2014;289:23318–28. doi:10.1074/jbc.M114.575183. PMID:24986863.
- Fu X, Chin RM, Vergnes L, Hwang H, Deng G, Xing Y, Pai MY, Li S, Ta L, Fazlollahi F, et al. 2-Hydroxyglutarate Inhibits ATP Synthase and mTOR Signaling. Cell Metab. 2015;22:508–15. doi:10.1016/j.cmet.2015.06.009. PMID:26190651.
- Li F, He X, Ye D, Lin Y, Yu H, Yao C, Huang L, Zhang J, Wang F, Xu S, et al. NADP(+)-IDH Mutations Promote Hypersuccinylation that Impairs Mitochondria Respiration and Induces Apoptosis Resistance. Mol Cell. 2015;60:661–75. doi:10.1016/j.molcel.2015.10.017. PMID:26585387.
- Curti A, Aluigi M, Pandolfi S, Ferri E, Isidori A, Salvestrini V, Durelli I, Horenstein AL, Fiore F, Massaia M, et al. Acute myeloid leukemia cells constitutively express the immunoregulatory enzyme indoleamine 2,3-dioxygenase. Leukemia. 2007;21:353–5. doi:10.1038/sj.leu.2404485. PMID:17170728.
- Aurelius J, Thoren FB, Akhiani AA, Brune M, Palmqvist L, Hansson M, Hellstrand K, Martner A. Monocytic AML cells inactivate antileukemic lymphocytes: role of NADPH oxidase/gp91(phox) expression and the PARP-1/PAR pathway of apoptosis. Blood. 2012;119:5832–7. doi:10.1182/blood-2011-11-391722. PMID:22550344.
- Kohanbash G, Carrera DA, Shrivastav S, Ahn BJ, Jahan N, Mazor T, Chheda ZS, Downey KM, Watchmaker PB, Beppler C, et al. Isocitrate dehydrogenase mutations suppress STAT1 and CD8+ T cell accumulation in gliomas. J Clin Invest. 2017;127:1425–37. doi:10.1172/JCI90644. PMID:28319047.
- Xu T, Stewart KM, Wang X, Liu K, Xie M, Ryu JK, Li K, Ma T, Wang H, Ni L, et al. Metabolic control of TH17 and induced Treg cell balance by an epigenetic mechanism. Nature. 2017;548:228–33. PMID:28783731.
- Yang H, Ye D, Guan KL, Xiong Y. IDH1 and IDH2 mutations in tumorigenesis: mechanistic insights and clinical perspectives. Clin Cancer Res. 2012;18:5562–71. doi:10.1158/1078-0432.CCR-12-1773. PMID:23071358.
- Balss J, Thiede C, Bochtler T, Okun JG, Saadati M, Benner A, Pusch S, Ehninger G, Schaich M, Ho AD, et al. Pretreatment d-2-hydroxyglutarate serum levels negatively impact on outcome in IDH1-mutated acute myeloid leukemia. Leukemia. 2016;30:782–8. doi:10.1038/leu.2015.317. PMID:26582645.
- Shi LZ, Wang R, Huang G, Vogel P, Neale G, Green DR, Chi H. HIF1α–dependent glycolytic pathway orchestrates a metabolic checkpoint for the differentiation of T<sub>H</sub>17 and T<sub>reg</sub>cells. J Exp Med. 2011;208:1367–76. doi:10.1084/jem.20110278. PMID:21708926.
- Choi C, Ganji SK, DeBerardinis RJ, Hatanpaa KJ, Rakheja D, Kovacs Z, Yang XL, Mashimo T, Raisanen JM, Marin-Valencia I, et al. 2-hydroxyglutarate detection by magnetic resonance spectroscopy in IDH-mutated patients with gliomas. Nat Med. 2012;18:624–9. doi:10.1038/nm.2682. PMID:22281806.
- Jin G, Reitman ZJ, Spasojevic I, Batinic-Haberle I, Yang J, Schmidt-Kittler O, Bigner DD, Yan H. 2-hydroxyglutarate production, but not dominant negative function, is conferred by glioma-derived NADP-dependent isocitrate dehydrogenase mutations. Plos One. 2011;6:e16812. doi:10.1371/journal.pone.0016812. PMID:21326614.
- Terunuma A, Putluri N, Mishra P, Mathe EA, Dorsey TH, Yi M, Wallace TA, Issaq HJ, Zhou M, Killian JK, et al. MYC-driven accumulation of 2-hydroxyglutarate is associated with breast cancer prognosis. J Clin Invest. 2014; 124:398–412. doi:10.1172/JCI71180. PMID:24316975.
- DiNardo CD, Propert KJ, Loren AW, Paietta E, Sun Z, Levine RL, Straley KS, Yen K, Patel JP, Agresta S, et al. Serum 2-hydroxyglutarate levels predict isocitrate dehydrogenase mutations and clinical outcome in acute myeloid leukemia. Blood. 2013;121:4917–24. doi:10.1182/blood-2013-03-493197. PMID:23641016.
- Gross S, Cairns RA, Minden MD, Driggers EM, Bittinger MA, Jang HG, Sasaki M, Jin S, Schenkein DP, Su SM, et al. Cancer-associated metabolite 2-hydroxyglutarate accumulates in acute myelogenous leukemia with isocitrate dehydrogenase 1 and 2 mutations. J Exp Med. 2010;207:339–44. doi:10.1084/jem.20092506. PMID:20142433.
- Balss J, Pusch S, Beck AC, Herold-Mende C, Kramer A, Thiede C, Buckel W, Langhans CD, Okun JG, von Deimling A. Enzymatic assay for quantitative analysis of (D)-2-hydroxyglutarate. Acta Neuropathol. 2012;124:883–91. doi:10.1007/s00401-012-1060-y. PMID:23117877.
- Chan SM, Thomas D, Corces-Zimmerman MR, Xavy S, Rastogi S, Hong WJ, Zhao F, Medeiros BC, Tyvoll DA, Majeti R. Isocitrate dehydrogenase 1 and 2 mutations induce BCL-2 dependence in acute myeloid leukemia. Nat Med. 2015;21:178–84. doi:10.1038/nm.3788. PMID:25599133.
- Palmer CS, Ostrowski M, Balderson B, Christian N, Crowe SM. Glucose metabolism regulates T cell activation, differentiation, and functions. Front Immunol. 2015;6:1. doi:10.3389/fimmu.2015.00001. PMID:25657648.
- Ma S, Jiang B, Deng W, Gu ZK, Wu FZ, Li T, Xia Y, Yang H, Ye D, Xiong Y, et al. D-2-hydroxyglutarate is essential for maintaining oncogenic property of mutant IDH-containing cancer cells but dispensable for cell growth. Oncotarget. 2015;6:8606–20. doi:10.18632/oncotarget.3330. PMID:25825982.
- Goldberg HJ, Whiteside CI, Hart GW, Fantus IG. Posttranslational, reversible O-glycosylation is stimulated by high glucose and mediates plasminogen activator inhibitor-1 gene expression and Sp1 transcriptional activity in glomerular mesangial cells. Endocrinol. 2006;147:222–31. doi:10.1210/en.2005-0523..
- Jozwiak P, Forma E, Brys M, Krzeslak A. O-Glcnacylation and metabolic reprograming in cancer. Front Endocrinol. 2014;5:145.
- Bottcher M, Hofmann AD, Bruns H, Haibach M, Loschinski R, Saul D, Mackensen A, Le Blanc K, Jitschin R, Mougiakakos D. Mesenchymal stromal cells disrupt mTOR-signaling and aerobic glycolysis during T-cell activation. Stem Cells. 2016;34:516–21. doi:10.1002/stem.2234. PMID:26485560.
- Latini A, Scussiato K, Rosa RB, Llesuy S, Bello-Klein A, Dutra-Filho CS, Wajner M. D-2-hydroxyglutaric acid induces oxidative stress in cerebral cortex of young rats. Eur J Neurosci. 2003;17:2017–22. doi:10.1046/j.1460-9568.2003.02639.x. PMID:12786967.
- Jitschin R, Hofmann AD, Bruns H, Giessl A, Bricks J, Berger J, Saul D, Eckart MJ, Mackensen A, Mougiakakos D. Mitochondrial metabolism contributes to oxidative stress and reveals therapeutic targets in chronic lymphocytic leukemia. Blood. 2014;123:2663–72. doi:10.1182/blood-2013-10-532200. PMID:24553174.
- Michalek RD, Gerriets VA, Jacobs SR, Macintyre AN, MacIver NJ, Mason EF, Sullivan SA, Nichols AG, Rathmell JC. Cutting edge: distinct glycolytic and lipid oxidative metabolic programs are essential for effector and regulatory CD4+ T cell subsets. J Immunol. (Baltimore, Md: 1950) 2011;186:3299–303. doi:10.4049/jimmunol.1003613. PMID:21317389.
- Mahnke YD, Brodie TM, Sallusto F, Roederer M, Lugli E. The who's who of T-cell differentiation: human memory T-cell subsets. Eur J Immunol. 2013;43:2797–809. doi:10.1002/eji.201343751. PMID:24258910.
- O'Sullivan D, van der Windt GJ, Huang SC, Curtis JD, Chang CH, Buck MD, Qiu J, Smith AM, Lam WY, DiPlato LM, et al. Memory CD8(+) T cells use cell-intrinsic lipolysis to support the metabolic programming necessary for development. Immunity. 2014;41:75–88. doi:10.1016/j.immuni.2014.06.005. PMID:25001241.
- Schieke SM, Phillips D, McCoy JP, Jr., Aponte AM, Shen RF, Balaban RS, Finkel T. The mammalian target of rapamycin (mTOR) pathway regulates mitochondrial oxygen consumption and oxidative capacity. J Biol Chem. 2006;281:27643–52. doi:10.1074/jbc.M603536200. PMID:16847060.
- Buller CL, Loberg RD, Fan MH, Zhu Q, Park JL, Vesely E, Inoki K, Guan KL, Brosius FC 3rd. A GSK-3/TSC2/mTOR pathway regulates glucose uptake and GLUT1 glucose transporter expression. A J Physiol Cell Physiol. 2008;295:C836–43. doi:10.1152/ajpcell.00554.2007.
- Waickman AT, Powell JD. mTOR, metabolism, and the regulation of T-cell differentiation and function. Immunol Rev. 2012;249:43–58. doi:10.1111/j.1600-065X.2012.01152.x. PMID:22889214.
- Sun Q, Chen X, Ma J, Peng H, Wang F, Zha X, Wang Y, Jing Y, Yang H, Chen R, et al. Mammalian target of rapamycin up-regulation of pyruvate kinase isoenzyme type M2 is critical for aerobic glycolysis and tumor growth. Proc Nat Acad Sci U S A. 2011;108:4129–34. doi:10.1073/pnas.1014769108.
- Carbonneau M, L MG, Lalonde ME, Germain MA, Motorina A, Guiot MC, Secco B, Vincent EE, Tumber A, Hulea L, et al. The oncometabolite 2-hydroxyglutarate activates the mTOR signalling pathway. Nat Commun. 2016;7:12700. doi:10.1038/ncomms12700. PMID:27624942.
- Land SC, Tee AR. Hypoxia-inducible factor 1alpha is regulated by the mammalian target of rapamycin (mTOR) via an mTOR signaling motif. J Biol Chem. 2007; 282:20534–43. doi:10.1074/jbc.M611782200. PMID:17502379.
- Koivunen P, Lee S, Duncan CG, Lopez G, Lu G, Ramkissoon S, Losman JA, Joensuu P, Bergmann U, Gross S, et al. Transformation by the (R)-enantiomer of 2-hydroxyglutarate linked to EGLN activation. Nature. 2012;483:484–8. doi:10.1038/nature10898. PMID:22343896.
- Shi LZ, Wang R, Huang G, Vogel P, Neale G, Green DR, Chi H. HIF1alpha-dependent glycolytic pathway orchestrates a metabolic checkpoint for the differentiation of TH17 and Treg cells. J Exp Med. 2011;208:1367–76. doi:10.1084/jem.20110278. PMID:21708926.
- Brand A, Singer K, Koehl GE, Kolitzus M, Schoenhammer G, Thiel A, Matos C, Bruss C, Klobuch S, Peter K, et al. LDHA-associated lactic acid production blunts tumor immunosurveillance by T and NK cells. Cell Metab. 2016;24:657–71. doi:10.1016/j.cmet.2016.08.011. PMID:27641098.
- Berghoff AS, Kiesel B, Widhalm G, Wilhelm D, Rajky O, Kurscheid S, Kresl P, Wöhrer A, Marosi C, Hegi ME, et al. Correlation of immune phenotype with IDH mutation in diffuse glioma. Neuro-Oncol. 2017;19:1460–8. doi:10.1093/neuonc/nox054.
- Tyrakis PA, Palazon A, Macias D, Lee KL, Phan AT, Velica P, You J, Chia GS, Sim J, Doedens A, et al. S-2-hydroxyglutarate regulates CD8+ T-lymphocyte fate. Nature. 2016;540:236–41. doi:10.1038/nature20165. PMID:27798602.
- Buck MD, O'Sullivan D, Pearce EL. T cell metabolism drives immunity. J Exp Med. 2015;212:1345–60. doi:10.1084/jem.20151159. PMID:26261266.
- Chang CH, Pearce EL. Emerging concepts of T cell metabolism as a target of immunotherapy. Na Immunol. 2016;17:364–8. doi:10.1038/ni.3415.
- Sulkowski PL, Corso CD, Robinson ND, Scanlon SE, Purshouse KR, Bai H, Liu Y, Sundaram RK, Hegan DC, Fons NR, et al. 2-Hydroxyglutarate produced by neomorphic IDH mutations suppresses homologous recombination and induces PARP inhibitor sensitivity. Sci Translational Med. 2017;9. doi:10.1126/scitranslmed.aal2463.
- Peterson TR, Laplante M, Thoreen CC, Sancak Y, Kang SA, Kuehl WM, Gray NS, Sabatini DM. DEPTOR is an mTOR inhibitor frequently overexpressed in multiple myeloma cells and required for their survival. Cell. 2009;137:873–86. doi:10.1016/j.cell.2009.03.046. PMID:19446321.
- Achouri Y, Noel G, Vertommen D, Rider MH, Veiga-Da-Cunha M, Van Schaftingen E. Identification of a dehydrogenase acting on D-2-hydroxyglutarate. The Biochem J. 2004;381:35–42. doi:10.1042/BJ20031933..
- Firth JD, Ebert BL, Ratcliffe PJ. Hypoxic regulation of lactate dehydrogenase A. Interaction between hypoxia-inducible factor 1 and cAMP response elements. J Biol Chem. 1995;270:21021–7. doi:10.1074/jbc.270.36.21021. PMID:7673128.
- Papandreou I, Cairns RA, Fontana L, Lim AL, Denko NC. HIF-1 mediates adaptation to hypoxia by actively downregulating mitochondrial oxygen consumption. Cell Metabol. 2006;3:187–97. doi:10.1016/j.cmet.2006.01.012.
- He G, Jiang Y, Zhang B, Wu G. The effect of HIF-1alpha on glucose metabolism, growth and apoptosis of pancreatic cancerous cells. Asia Pacific Jclin Nutrition. 2014;23:174–80.
- Mougiakakos D, Johansson CC, Kiessling R. Naturally occurring regulatory T cells show reduced sensitivity toward oxidative stress-induced cell death. Blood. 2009;113:3542–5. doi:10.1182/blood-2008-09-181040. PMID:19050306.
- Mougiakakos D, Johansson CC, Jitschin R, Bottcher M, Kiessling R. Increased thioredoxin-1 production in human naturally occurring regulatory T cells confers enhanced tolerance to oxidative stress. Blood. 2011;117:857–61. doi:10.1182/blood-2010-09-307041. PMID:21030559.
- Angelin A, Gil-de-Gomez L, Dahiya S, Jiao J, Guo L, Levine MH, Wang Z, Quinn WJ 3rd, Kopinski PK, Wang L, et al. Foxp3 reprograms T cell metabolism to function in low-glucose, high-lactate environments. Cell Metabol. 2017;25:1282–93.e7. doi:10.1016/j.cmet.2016.12.018.
- Kishton RJ, Sukumar M, Restifo NP. Metabolic regulation of T cell longevity and function in tumor immunotherapy. Cell Metabol. 2017;26:94–109. doi:10.1016/j.cmet.2017.06.016.
- Sena LA, Li S, Jairaman A, Prakriya M, Ezponda T, Hildeman DA, Wang CR, Schumacker PT, Licht JD, Perlman H, et al. Mitochondria are required for antigen-specific T cell activation through reactive oxygen species signaling. Immunity. 2013;38:225–36. doi:10.1016/j.immuni.2012.10.020. PMID:23415911.
- Kaminski MM, Sauer SW, Klemke CD, Suss D, Okun JG, Krammer PH, Gülow K. Mitochondrial reactive oxygen species control T cell activation by regulating IL-2 and IL-4 expression: mechanism of ciprofloxacin-mediated immunosuppression. J Immunol. (Baltimore, Md: 1950) 2010;184:4827–41. doi:10.4049/jimmunol.0901662. PMID:20335530.
- Pouyssegur J, Mechta-Grigoriou F. Redox regulation of the hypoxia-inducible factor. Biol Chem. 2006;387:1337–46. doi:10.1515/BC.2006.167. PMID:17081104.
- Han Y, Ye A, Bi L, Wu J, Yu K, Zhang S. Th17 cells and interleukin-17 increase with poor prognosis in patients with acute myeloid leukemia. Cancer Sci. 2014;105:933–42. doi:10.1111/cas.12459. PMID:24890519.
- Tian T, Yu S, Liu L, Xue F, Yuan C, Wang M, Ji C, Ma D. The profile of T helper subsets in bone marrow microenvironment is distinct for different stages of acute myeloid leukemia patients and chemotherapy partly ameliorates these variations. Plos One. 2015;10:e0131761. doi:10.1371/journal.pone.0131761. PMID:26134277.
- Abousamra NK, Salah El-Din M, Helal R. Prognostic value of Th17 cells in acute leukemia. Med Oncol. (Northwood, London, England) 2013;30:732. doi:10.1007/s12032-013-0732-3. PMID:24085544.
- Wu C, Wang S, Wang F, Chen Q, Peng S, Zhang Y, Qian J, Jin J, Xu H. Increased frequencies of T helper type 17 cells in the peripheral blood of patients with acute myeloid leukaemia. Clin Exp Immunol. 2009;158:199–204. doi:10.1111/j.1365-2249.2009.04011.x. PMID:19737137.
- Tian T, Yu S, Wang M, Yuan C, Zhang H, Ji C, Ma D. Aberrant T helper 17 cells and related cytokines in bone marrow microenvironment of patients with acute myeloid leukemia. Clin Dev Immunol. 2013;2013:915873. doi:10.1155/2013/915873. PMID:24023567.
- Peck A, Mellins ED. Precarious balance: Th17 cells in host defense. Infect Immun. 2010;78:32–8. doi:10.1128/IAI.00929-09. PMID:19901061.
- Jagarlamudi R, Kumar L, Kochupillai V, Kapil A, Banerjee U, Thulkar S. Infections in acute leukemia: an analysis of 240 febrile episodes. Med Oncol. (Northwood, London, England) 2000;17:111–6. doi:10.1007/BF02796205. PMID:10871816.