
ABSTRACT
Immunogenic cell death (ICD) is a specific kind of cell death that stimulates the immune system to combat cancer cells. Ultrasound (US)-controlled targeted release of drugs by liposome-microbubble complexes is a promising approach due to its non-invasive nature and visibility through ultrasound imaging. However, it is not known whether this approach can enhance ICD induced by drugs, such as doxorubicin. Herein, we prepared a doxorubicin-liposome-microbubble complex (MbDox), and the resultant MbDox was then characterized and tested for US-controlled release of Dox (MbDox+US treatment) to enhance the induction of ICD in LL/2 and CT26 cancer cells and in syngeneic murine models. We found that MbDox+US treatment caused more cellular uptake and nuclear accumulation of Dox in tumor cells, and more accumulation of Dox in tumor tissues. Enhanced induction of ICD occurred both in vitro and in vivo. MbDox+US treatment induced more apoptosis, stronger membrane exposure and the release of ER stress proteins and DAMPs in tumor cells, and increased DC maturation in vitro. In addition, MbDox+US treatment also resulted in stronger therapeutic effects in immunocompetent mice than in immunodeficient mice. Moreover, MbDox+US enhancement of ICD was also evidenced by a higher proportion of activated CD8+ T-lymphocytes but lower Treg in tumor tissues. Taken together, our results demonstrate that US-controlled release of ICD inducers into nuclei using liposome-microbubble complexes may be an effective approach to enhance the induction of ICD for tumor treatment.
Introduction
Immunogenic cell death (ICD) is a specific form of cell death that can activate dendritic cells (DCs) or other immune cells to induce effective immune responses against targeted cells.Citation1-Citation6 ICD renders tumor cells ‘visible’ to the immune system and, in particular, to DCs that phagocytose dying tumor cells and then initiate a strong antitumor immune response.Citation7-Citation12 Cancer cells undergoing ICD generally experience endoplasmic reticulum stress (ER stress), which results in the translocation of the ER-associated protein disulfide isomerase ERp57 from the ER lumen to the plasma membrane of dying cells.Citation13-Citation15 In addition, cancer cells undergoing ICD also upregulate the expression of damage-associated molecular patterns (DAMPs), such as increased surface exposure of calreticulin (CRT), extracellularly secreted adenosine triphosphate (ATP), and passively released chromatin-binding protein high mobility group B1 (HMGB1).Citation4-Citation6 Thus, in vitro detection of these DAMPs can help confirm ICD. In vivo, ICD must satisfy two criteria: first, subcutaneous injection with dying tumor cells that were treated with ICD inducers in vitro must protect immunocompetent mice against subsequent re-challenge with the same live tumor cells; second, the antitumor effect primed by ICD inducers on an established tumor is stronger in immunocompetent mice than in immunodeficient mice.Citation3-Citation6 Using these criteria, chemotherapeutics, such as doxorubicin, anthracyclines, oxaliplatin, cyclophosphamide, mitoxantrone, and bortezomib, have been identified as ICD inducers over the past decade.Citation7-Citation12
The ultrasound (US)-controlled release of chemotherapeutics by microbubbles (MBs) has become a promising therapeutic approach for drug delivery to treat malignant tumors.Citation16-Citation21 In this strategy, chemotherapeutics are incorporated into MB shells by hydrophobic interactions, or attached to MB shells by various approaches, such as nanoparticles.Citation20-Citation24 Thereafter, the MB-loaded chemotherapeutics are then released from MBs that flow through the targeted tumor tissues by high-intensity focused US. The US-controlled release of chemotherapeutics can greatly improve the intracellular uptake of drugs at target tumor tissues, because high-intensity US causes inertial acoustic cavitation effects, such as bubble implosion, shock waves, microstreaming, and microjets.Citation25-Citation27 These acoustic radiation forces cause a special sonoporation (pore forming) effect that greatly improves the intracellular uptake of chemotherapeutics at target tumor tissues.Citation27-Citation29 However, because MBs consist of only one lipid layer, their drug-loading capacity limits effective tumor-targeted therapy.Citation30 Liposome-microbubble complexes have therefore been developed to counter this major drawback.Citation16-Citation21 Although liposome-microbubble complexes have improved the targeted tumor delivery and accumulation of chemotherapeutic drugs, the role of ICD in this process has not been elucidated.Citation16-Citation21
In this study, we constructed a liposome-MB complex in which doxorubicin (Dox, an ICD inducer) was encapsulated in a liposome (Dox-liposome) and attached to the lipid shell of MBs via avidin-biotin linkage. Thereafter, we detected the efficacy of US-triggered drug delivery from these complexes in LL/2c and CT26 tumor models, and focused on the comparative effects of the respective drug preparations as well as the levels of ICD that they provoked.
Materials and methods
Reagents and antibodies
Avanti Polar Lipids Inc. (Alabaster, AL, USA) provided 1,2-distearoylsn-glycero-3-phosphoethanolamine-N-[methoxy(polyethylene glycol)-2000] (DSPE-PEG2000), 1,2-dipalmitoyl-sn-glycero-3-phosphocholine (DPPC), 1,2-Distearoyl-sn-glycero-3-phosphatidylcholine (DSPC), and 1,2-distearoyl-sn-glycero-3-phosphoethanolamine-N-[biotinyl(polyethylene glycol)2000] (DSPEPEG2000-Biotin). Perfluoropropane (C3F8) was purchased from Huahe New-technology Development Company (Tianjin, China). All of the other reagents were of analytical grade. Doxorubicin hydrochloride (DOX, > 98%), bovine serum albumin (BSA), avidin, and 4,6-diamidino-2-phenylindole (DAPI) were obtained from Sigma-Aldrich (St. Louis, MO, USA). RPMI 1640 and DMEM media, penicillin and streptomycin, and fetal bovine serum (FBS) were purchased from GIBCO (Grand Island, NY, USA). Anti-calreticulin, anti-elF-2-α, anti-HMGB1, FITC-conjugated anti-mouse CD80, PE-conjugated CD86, anti-CD80, anti-CD86, anti-CD8, anti-CD25, anti-FOXP3, anti-IFN-γ, GM-CSF, and IL-4 were purchased from eBioscience (San Diego, CA, USA) or BD Biosciences (Franklin Lakes, NJ, USA).
Preparation of biotinylated Dox-liposomes
Biotinylated Dox-liposomes (bDoxL) were prepared as reported previously.Citation20,Citation31 Briefly, DPPC, cholesterol, and DSPE-PEG-biotin were mixed in a molar ratio of 60:40:5. Organic solvents in the mixture were removed through nitrogen flow until a thin white film was formed, which was further dried for over 2 h under a vacuum. The lipid film was hydrated at 60°C in a (NH4)2SO4 buffer (250 mM, pH 5.4), and the extra ammonium sulfate was replaced by PBS (pH 7.4) overnight in a dialysis bag (MWCO 3500). Next, a Dox solution in PBS (1 mg/ml) was added to the resultant liposomes and incubated at 65°C for 4 h. Thereafter, the liposomes were passed through a Sephadex column (Sephadex G-50, Sigma-Aldrich) and dissolved in PBS to remove the unbound Dox. The encapsulation efficiencies (EE) of Dox were calculated as follows: EE% = (Wi / Wtotal) × 100%, where Wi is the measured amount of Dox in the liposome suspensions after passing over the Sephadex column, and Wtotal is the measured amount of Dox in the liposome suspensions before passing over the Sephadex column. The Dox concentration was detected by fluorescence-intensity measurement (λex = 485 nm, λem = 550 nm). The average diameter of the bDoxL was analyzed by a light scattering instrument (Zetasizer Nano ZS, Malvern Instrument, UK).
Preparation of MBs and Dox-liposome-microbubble complexes
The MBs and Dox-liposome-microbubble complexes (MbDox) were also prepared as previously reported.Citation20 DSPE-PEG2000, DSPE-PEG2000-biotin, and DSPC were mixed in chloroform at a molar ratio of 0.5:0.5:9. Then, the chloroform was removed under nitrogen flow and dried under a vacuum as above for the preparation of bDoxL. The dried phospholipid mixtures were hydrated with a buffer (0.1 M Tris (pH 7.4), glycerol, and propylene glycol at a volume ratio of 80:10:10). Thereafter, air in the vial was replaced with perfluoropropane (C3F8). MBs were formed by mechanically vibrating the admixture for 45 s. Then, the resultant MBs was washed with PBS three times to remove the excess unincorporated lipids by centrifugation at 400 g, and avidin (50 μg/108 MBs) was added to the washed MBs. After 15 min of incubation at room temperature, the MBs were washed with PBS three times to remove the unconjugated avidin, and incubated with bDoxL at room temperature for another 15 min, resulting in MbDox after the free bDoxL were removed by washing with PBS. Morphologic characteristics, particle size, and size distribution of MbDox were observed as previously reported.Citation20
Cell culture and drug administration
The Lewis lung carcinoma cell line LL/2 and colorectal carcinoma cell line CT26 were purchased from the Cancer Institute and Hospital, Chinese Academy of Medical Sciences (Beijing, China), and cultured in DMEM or RPMI 1640 medium supplemented with 10% FBS at 37°C in a humidified atmosphere containing 5% CO2. For in vitro treatment, the concentration of Dox was 3 mM as previously reported.Citation12 The concentrations of Dox in cells treated with bDoxL and MbDox were adjusted to 3 mM based on the above detection.
Flow cytometry
Cell apoptosis, cell surface proteins, and cell phenotypes were detected with a BD FACSCalibur Flow cytometer, and the resultant data were analyzed by FlowJo software (BD Biosciences, USA). To detect apoptosis, cancer cells were seeded into 6-well plates at a density of 100,000 cells per well. After a 24-h treatment with different drug formulations, the cells were stained using an Annexin V-FITC Apoptosis Detection Kit (BD Biosciences) per the manufacturer's instructions, followed by cytometry detection. In this study, all of the Annexin-V positive cells were calculated as apoptotic cells. In addition, the phenotypes of lymphocytes and surface or intracellular expression of DAMPs or ER-stress proteins were detected as previously reported.Citation32 Briefly, the respective antibodies were used to stain the cells followed by a second antibody conjugated with either FITC or PE. For intracellular staining, the cells were first fixed, permeabilized, and stained with corresponding FITC- or PE-conjugated antibodies, and then followed by cytometric analysis.
Immunofluorescence analysis
The surface exposure of CRT, the phagocytosis of tumor cells, and Dox uptake were detected by immunofluorescence (through FITC- or PE-conjugated antibodies) via confocal microscopy (Olympus, FV3000). To detect the surface exposure of CRT and phagocytosis of tumor cells, cancer cells were seeded into 6-well plates at a density of 100,000 cells per well and cultured with different drug formulations for 10 h. Cells were washed at least twice with PBS and fixed in 4% paraformaldehyde for 10 min. The fixed cells were then stained by corresponding antibodies (1: 400) at 4°C overnight and then washed with cold PBS at least two times. Then, the cells were stained with secondary FITC- or PE-conjugated antibodies (1:1000, Life technologies, USA) for 1 h at room temperature. Nuclei were stained with DAPI (or propidium iodide, PI) for 5 min. Images were captured by a confocal microscope (Olympus, FV3000).
The cellular uptake and intracellular distribution of DOX in the tumor cells were also detected by confocal microscopy as previously reported.Citation20 Briefly, tumor cells were seeded on coverslips (round-shaped 12 mm) in 12-well plates to 70% confluence, then treated with corresponding drug formulations containing 10 μg/ml of Dox. The cells were incubated for another 4 h, and then washed with PBS three times. Subsequently, the cells were fixed with 4% paraformaldehyde solution for 30 min at room temperature and then mounted on a glass slide using mounting medium containing DAPI (PI). Thereafter, the cells were observed by a confocal microscope (Olympus, FV3000) to localize the Dox relative to the cells. Similar procedures were used to detect the intracellular retention of Dox, except that after a 4-h incubation, cells were washed by PBS to remove uninternalized Dox, then incubated with fresh medium for another 24 h.
Western blot assay
Western blotting was performed as previously reported.Citation32 Briefly, to evaluate the expression of elF-2-α, HMGB1, and antibodies against tumor cells, LL/2 and CT26 cells lysates treated with various drug formulations were separated using 12% SDS-PAGE. Gels were then transferred onto a polyvinylidene difluoride (PVDF) membrane (Bio-Rad, Hercules, CA, USA) by a mini trans-blot system (Bio-Rad). Thereafter, the blots were blocked at 4°C in 5% non-fat dry milk, washed, and probed with antibodies against murine elF-2-α, HMGB1, or IgG at 1:500 dilutions and incubated with chemiluminescent secondary antibodies. Detection was via an enhanced chemiluminescence system (Amersham Biosciences, Amersham, UK). Band density was quantitatively analyzed by ImageJ software (https://imagej.nih.gov/ij).
ATP release assay
ATP concentrations in supernatants of variously treated cells were detected using a chemiluminescence ATP Determination Kit (Life Technologies, USA) according to the manufacturer's instructions. Briefly, supernatant samples were added into a reaction solution containing D-luciferin and firefly luciferase without ATP, followed by measurement of the luminescence. The amount of ATP was then calculated according to a standard curve generated by an ATP standard solution.
Isolation and treatment of DCs
Murine DCs (mDCs) were generated from bone marrow in 12-well cell culture plates (Corning, NY, USA) as described previously.Citation32-Citation34 In brief, bone marrow was extracted from female BALB/c or C57BL/6 mice of 8–10 weeks old. Erythrocyte-depleted mouse bone marrow cells (1 × 10⁵ per well) were harvested and seeded in respective media. Cells were then cultured with recombinant mouse GM-CSF (100 U/ml) and IL-4 (20 ng/ml). Thereafter, the nonadherent granulocytes were gently removed on days 2 and 4. On day 6, the loosely adhering proliferating mDC aggregates were dislodged and replated. After culturing for another 6 days, non-adherent cells with typical morphological characteristics of mDCs were collected for DC maturation assays. Briefly, the resultant mDCs were cultured with the conditioned medium of tumor cells (LL/2 or CT-26) treated with different drug formulations for 48 h. After 24 h, the mDCs were stained with FITC-conjugated anti-mouse CD80 and PE-conjugated CD86 antibodies (Biolegend, CA, USA) for 30 min at room temperature, and the maturation markers for DCs, CD80, and CD86, were evaluated by flow cytometry.
Determination of Dox uptake in tumor cells
Analysis of Dox uptake and retention in tumor cells was performed as previously reported.Citation20,Citation21 Briefly, 5 × 10⁵ tumor cells were seeded in 24-well plates and incubated overnight to allow cell adhesion. Tumor cells were immediately subjected to US exposure after the addition of Dox, bDoxL, or MbDox. US radiation was applied for 15 s by moving a US probe (20 mm, E1609, Valpey Fisher Inc, Hopkinton, MA, USA) over the culture plate at the following settings: 1 MHz, 20% duty cycle, and a US intensity of 1.65 W/cm2, with a US peak intensity of 0.35 MPa. Thereafter, the US-treated cells were incubated for 15 min. Then cells were washed with PBS to remove uninternalized Dox. To quantitatively determine cellular Dox, US-treated cells were lysed with RAPI buffer (Beyotime, China), and the Dox concentration in the cell lysates was detected using a microplate reader (Synergy™4, BioTek, VT, USA) at excitation and emission wavelengths of 485/550 nm; the results were normalized to total cellular protein content of the cells, which was determined using a BCA protein assay kit (Beyotime).
Detection of Dox concentration in vivo
Dox concentrations in tumor tissues and major organs were determined as reported previously.Citation31 In brief, tumor-bearing mice (n = 5 in each group) were treated with various drug formulations (calculated to the same does of 3 mM Dox) via the tail vein for 30 min, and US treatment was applied as previously reported. After US treatment, the mice were immediately killed. Thereafter, the tumor tissues and major organs, such as the heart, liver, spleen, lung, and kidney, were excised, weighed, and homogenized using a TissueLyser II (QIAGEN, Germany). The homogenized tissues were then extracted with ethyl acetate, and the supernatants were evaporated by a lyophilizer (FreeZone 4.5, Labconco, USA) to dryness and redissolved in methanol for high-performance liquid chromatography (HPLC; Hitachi L-2000, Japan) analyses.
US-controlled release of Dox in vivo
US-controlled release of Dox in vivo was performed using a system containing a special hole and a capsule as described previously.Citation21 Briefly, the skin over each tumor on a mouse was depilated and covered with an acoustic transmission gel (about 5-mm-thick, Pharmaceutical Innovations, Newark, NJ, USA) and positioned under the hole and membrane capsule on the system. The focal zone of the US transducer (diameter = 20 mm, frequency = 2.25 MHz, focal length = 50 mm; Valpey Fisher Corp., MA, USA) was positioned inside the tumor. Tumor-bearing mice were slightly moved at 1-min intervals to change the focal zone of the transducer. The acoustic pressure amplitude at the focal point was 1.9 MPa, which was measured by a needle hydrophone (HPM1/1, Precision Acoustics LTD, Dorchester, UK). Pulsed focused US sonications were applied with a 10-ms burst length, 1% duty cycle, 1 Hz pulse repetition frequency, and 10-min sonication duration.
Anti-tumor vaccination
The use of animals and animal experiment procedures were approved by the Ethics Committee of Hainan Medical College. Anti-tumor vaccination was performed as shown in . A total of 1 × 10⁶ tumor cells were treated with different drug formulations at the same dose (30 mM) of Dox for 48 h in vitro. The resultant tumor cells were attenuated at dose of 50 Gy by an X-ray irradiator (RS-2000-Pro, Rad Source, GA, USA) and inoculated subcutaneously into the left flanks of 8-week old female BALB/c or C57 BL/6 mice (n = 5 per group). After 7 days, the mice were re-challenged with live 1 × 10⁶ tumor cells into the contralateral flank. Tumor volumes in each mouse were detected using a handheld imaging device (TM900, Peira Scientific Instruments, Belgium) at day 21. Thereafter, the mice were killed and samples, such as peripheral blood, spleen, and lymph nodes, were collected for other experiments.
Cytotoxicity assay
Splenic monocytes against tumor cells were isolated to perform cytotoxicity assays using a CytoTox 96 cytotoxicity assay kit (Promega, Madison, WI, USA) according to the manufacturer's instructions and as previously reported.Citation32 In brief, target cancer cells were plated on 96-well plates, and splenic monocytes as effector cells were added to a final volume of 100 μl in various ratios (5–40:1). The plates were then incubated for 5 h in a humidified 5% CO2 atmosphere at 37°C. Aliquots (50 μl) and reconstituted substrate mix (50 μl) were mixed and then transferred to another 96-well flat-bottom plate. Thereafter, the plates were incubated in the dark at room temperature for 50 min. Stop solution (50 μl) was added to each well, and the optical density (OD) was measured at 492 nm using a microplate reader (ELX808IU, Bio-Tek, USA). The percentage of target tumor cell death at each E:T ratio was calculated by the following formula: percentage of cell death = (OD [experimental] – OD[effector spontaneous] – OD[target spontaneous]) × 100/(OD [target maximum] – OD[target spontaneous]).
Enzyme-linked immunospot assay
The number of splenic B cells that secreted antibodies against tumor cell lysates was detected using enzyme-linked immunospot (ELISPOT) assays as we reported previously.Citation32 In brief, PVDF-bottomed 96-well Filtration Plates (Millipore, Billerica, MA, USA) were coated with 25 μg/ml of tumor lysate as antigens. Mononuclear cells prepared from spleens immunized with different drug formulations were incubated on the plates at 37°C and 5% CO2 in an incubator for 6 h. IgG bound to the membrane was stained with a chemiluminescent antibody. The results were detected using an enhanced chemiluminescence system (Amersham Biosciences).
Phenotypic analysis of tumor-infiltrating lymphocytes
Tumor-infiltrating lymphocytes (TILs) were generated from different tumor masses.Citation32 In brief, tumor masses were removed from mice using forceps and cut into about 1-mmCitation3 pieces before being treated with DMEM containing collagenase (1 mg/ml, Sigma) and DNase I (1 U/ml, Sigma) for 3 h at 37°C. The resulting cell suspension was treated with Lysing Buffer ((BD Biosciences, Franklin Lakes, NJ) and passed through a 70-mm cell strainer. Thereafter, the cells were resuspended in 33% Percoll (5 ml) and centrifuged at 2,500 rpm for 20 min. Phenotypic markers (CD8, CD25, FOXP3, and IFN-γ) of the resultant TILs were further analyzed with flow cytometry as described previously.
Observation of anti-tumor effect in vivo
LL/2 and CT26 tumor models were established in immunocompetent female C57BL/6, BALB/c mice or immunodeficient nude (Nu/Nu) mice at 6 to 8 weeks of age. The mice were injected with 1 × 10⁶ corresponding tumor cells (10 mice in each group). When the tumor volume was palpable (∼50 mm3), different drug formulations (adjusted to equal doses of Dox at 50 μg/mice) were injected through the tail vein every 3 days, and US-controlled release of Dox was performed 1 min after injection. Treatment was continued for 6 total treatments (18 days), and mice were observed to 28 days. The tumor volumes were monitored every 3 days using a handheld imaging device (TM900, Peira, Belgium).
Statistical analyses
Data are presented as means ± SEM of at least triplicate measurements. The statistical significance between two groups was determined with unpaired Student's t test, and comparisons of multiple groups were carried out by one-way or two-way ANOVA followed by Bonferroni's post-test using GraphPad Prism software (San Diego, CA, USA). Nonlinear-regression analysis of inhibitor vs. normalized response and statistical analysis for Kaplan-Meier survival curves (log-rank test) were also performed using GraphPad Prism software. A probability value of *P < 0.05 was considered to be significant.
Results
Preparation and characterization of liposomes and microbubble complexes
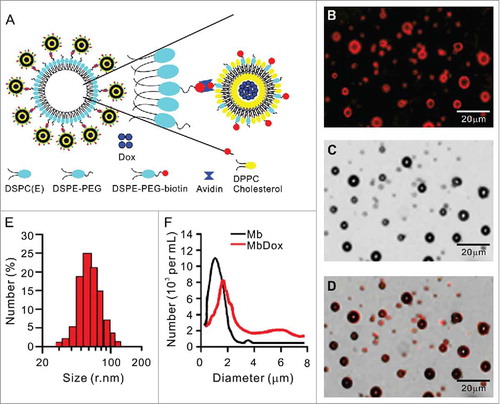
A schematic diagram of the construction of the Dox-loaded liposome-microbubble complexes (MbDox) is presented in . Typical fluorescent () and corresponding transmission () images of MbDox were observed under a confocal microscope and are merged in . Due to the presence of biotinylated Dox-liposomes (bDoxL), the surface of the MbDox showed red under a fluorescent microscope, suggesting the successful conjugation of the bDoxL onto the surface of the MBs. The average diameter of bDoxL was 89.08 nm and the polydensity index (PDI) was 0.114 (). About 64.25% of bDoxL, with 92.31 ± 1.89% of Dox encapsulation efficiency, was attached to the biotinylated MBs, which resulted in a slightly lager mean size of MbDox (2.12 ± 0.32 μm) compared to the non-liposome-conjugated plain MBs (1.59 ± 0.27 μm). shows the size distribution of plain MBs and MbDox.
Figure 1. Preparation and characterization of biotinylated Dox-liposomes (bDoxL) and Dox-microbubble complexes (MbDox). A. Schematic diagram of a liposome-microbubble complex constructed for controlled release of Dox by ultrasound. bDoxL is attached to the surface of biotinylated gas-filled MB through biotin-avidin linkage. B-D. Fluorescent micrograph of MbDox using the fluorescence of the bound Dox (B) was merged with its corresponding transmission image (C) for the resultant image (D). E. Size distribution of bDoxL. F. Size distribution of MbDox and non-loaded Mb. Dox, doxorubicin.
Increased ER stress response and CRT translocation by MbDox+US treatment
LL/2 and CT26 tumor cells were treated with Dox, bDoxL, bDoxL+US, Mb, Mb+US, MbDox, and MbDox+US, respectively. Compared to the cells treated with Mb or Mb+US, significant apoptosis was observed in cells treated with Dox, bDoxL, bDoxL+US, and MbDox, respectively, but was highest in the cells treated with MbDox+US ( and ). Pre-apoptotic translocation of calreticulin (CRT) and ER-associated protein disulfide isomerase ERp57 onto the plasma membrane are two major markers of ICD progress.Citation13-Citation15 Tumor cells treated with Mb or Mb+US did not show induced translocation of CRT () or ERp57 ( and ), but they were slightly increased in cells treated with Dox, bDoxL, or bDoxL+US, and significantly increased for CRT () and ERp57 ( and ) in cells treated with MbDox or MbDox+US. As expected, the translocations of CRT () and ERp57 ( and ) were highest in tumor cells treated with MbDox+US. Moreover, we also used (propidium iodide, PI) to detect whether CRT and ERp57 are expressed on the death cells. We found that Dox, MbDox or MbDox+US induced expression of CRT and ERp57 were mainly on the PI-negative staining cells (Data no shown). To see if the translocation of CRT and ERp57 was a consequence of ER stress response, the phosphorylation of the translation initiation factor eIF2-α (p-eIF2-α) was detected by Western blot.Citation35 Consistently, although significantly increased expression of p-eIF2-α was detected in tumor cells treated with Dox, bDoxL, bDoxL+US, or MbDox, more significantly increased expression of p-eIF2-α was found in tumor cells treated with MbDox+US ( and ).
Figure 2. Increased ER stress response and CRT translocation by MbDox+US treatment. LL/2 and CT26 cells were treated with indicated formulations, and tests were performed at 4 h after treatment. A and B. Apoptotic cells after treatment were stained by PI/Annexin-V followed by flow cytometry detection. C and D. Cells after treatment were stained with an antibody against CRT followed by PE-conjugated secondary antibodies (Red) and DAPI (blue) counterstain to detect CRT translocation to cell surfaces. Images were observed by a confocal microscope (C, scale bar = 5 μm), and CRT-positive cells were quantified from three independent experiments (D). E and F. Cells after treatment were stained as in C and D to detect CRT-positive cells by flow cytometry. G and H. Cells after treatment were stained with FITC-conjugated antibody against ERp57 to detect ERp57-positive cells by flow cytometry. Data are expressed as mean ± SEM, * indicates P < 0.05, ** indicates P < 0.001, NS, no significance.
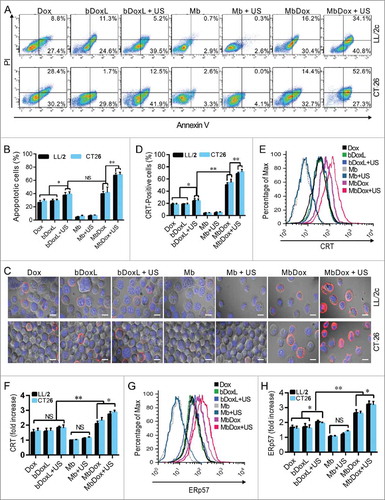
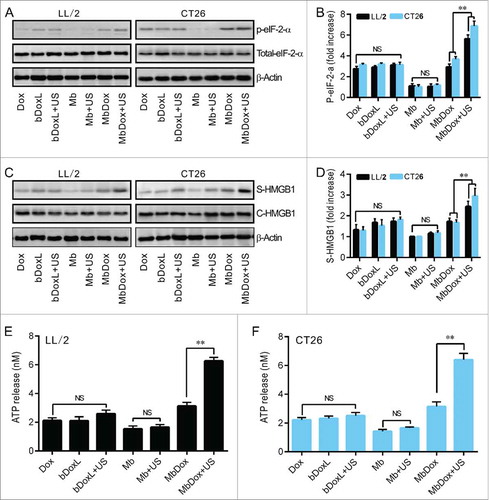
Figure 3. Increased HMGB1 release and ATP secretion by MbDox+US treatment in vitro. LL/2 and CT26 cells were treated with indicated formulations, and tests were performed at 4 h after treatment. A. eIF2-α and its phosphorylated counterpart (indicator of ER stress response) were analyzed by Western blot. B. The densitometry of p-eIF2-α normalized to total eIF2-α from three independent Western blot analyses was quantified by ImageJ software. C. HMGB1 released from treated cells to the supernatant (S-HMGB1) and in whole cell lysates (C-HMGB1) was detected by Western blot. D. The densitometry of S-HMGB1 from three independent Western blot analyses was quantified by ImageJ software. E and F. ATP secretion from LL/2 (E) and CT26 (F) cells, respectively, was quantified by a chemiluminescent ATP Determination Kit. Data are expressed as mean ± SEM, * indicates P < 0.05, ** indicates P < 0.001, NS, no significance.
Increased HMGB1 release and ATP secretion by MbDox+US treatment in vitro
Except CRT (), other ICD-related DAMPs such as HMGB1 and ATP were detected in this study. Western blot analysis showed that none of the drug formulations caused increased expression of HMGB1 (C-HMGB1), but there was a slight release of HMGB1 into the supernatants of the cells treated with Dox, bDoxL, bDoxL+US, and MbDox ( and ). As expected, HMGB1 release into the supernatant was higher in cells treated with MbDox+US compared with other drug formulations ( and ). Consistently, similar results related to ATP secretion were found in cells treated with MbDox+US ( and ). ATP secretion was not significantly different in cells treated with Dox, bDoxL, bDoxL+US, and MbDox, respectively, but in the cells treated with MbDox+US, ATP was dramatically enhanced over those treated with MbDox and other drug formulations, with increases of about 3-fold in ATP secretion ( and ).
Increased maturation and activation of mDCs by MbDox+US treatment
Not all released DAMPs can induce ICD.Citation36 To test whether the US-controlled release of Dox in cells treated with MbDox can induce stronger immune responses, mDC maturation markers (CD80 and CD86) and active marker (INF-γ) were detected by flow cytometry. The mDCs were incubated with conditioned supernatants from tumor cells treated with different drug formulations for another 24 h. Compared with non-Dox-containing formulations (Mb and Mb+US), the cell culture media from cells treated with Dox, bDoxL, bDoxL+US, MbDox, and MbDox+US, respectively, induced increased expression of both CD80 and CD86 on mDCs, and the highest expressions of CD80 and CD86 were found on mDCs that were cocultured with supernatants from tumor cells treated with MbDox+US ( and ). Similarly, conditioned supernatants from tumor cells treated with Dox, bDoxL, bDoxL+US, MbDox, and MbDox+US, respectively, caused an increased secretion of IFN-γ in mDCs, but a greater secretion of IFN-γ in mDCs was found with coculturing of supernatants from tumor cells treated with MbDox+US, indicating that more mDCs were activated by supernatants from tumor cells treated with MbDox+US ( and ).
Figure 4. Increased maturation and activation of mDCs by MbDox+US treatment. mDCs were stimulated with conditioned culture media from the indicated formulations for 24 h. A and B. The proportion of CD80+ and CD86+ double-positive cells was determined by flow cytometry. C and D. Cells secreting IFN-γ were detected by flow cytometry. Data are expressed as mean ± SEM, * indicates P < 0.05, ** indicates P < 0.001, NS, no significance.
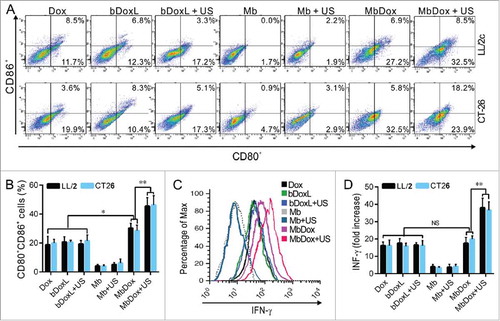
Figure 5. Increased intracellular uptake and tissue accumulation of Dox by MbDox+US treatment. A. LL/2 and CT26 cells were treated with indicated formulations at 4 h after treatment. Images of intracellular Dox distribution were collected by confocal microscopy. Dox is indicated by red fluorescence and the nucleus is stained with DAPI (blue, scale bar = 10 μm). B. The intracellular concentration of Dox in LL/2 and CT26 cells after treatment with the indicated formulations was quantified by a microplate reader. C. Tumor-bearing mice were treated with indicated formulations, and tumor tissues and major organs were collected to analyze the Dox concentration by HPLC. Data are expressed as mean ± SEM, * indicates P < 0.05, ** indicates P < 0.001, NS, no significance.
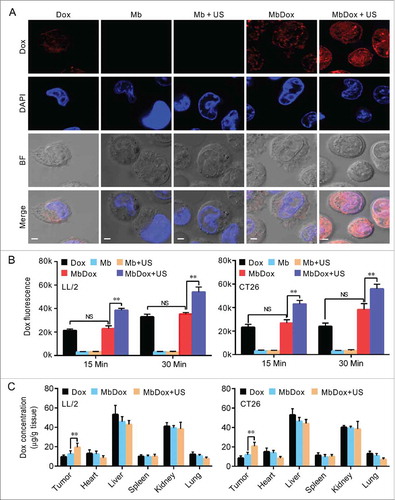
Increased intracellular uptake and tissue accumulation of Dox by MbDox+US treatment
Since we found that tumor cells treated with bDoxL or bDoxL+US were similar to those treated with Dox, similar to results we previously reported,Citation31 we omitted these two groups from subsequent experiments to simplify procedures and save resources. As shown in , although Dox was significantly distributed in tumor cells treated with Dox and MbDox when compared to those treated with Mb or Mb+US, tumor cells treated with MbDox+US had more intracellular uptake of Dox ( and ). In addition, the concentrations of Dox in tumor tissues and major organs (heart, liver, spleen, lung, and kidney) were detected using HPLC. As expected, Dox was widely distributed in tumor tissues and normal organs, and the concentrations of Dox were relatively high in the liver and kidneys, moderate in tumor tissues, and relatively low in heart, lung, and spleen (). However, when compared to Dox and MbDox treatments, MbDox+US significantly increased the concentration of Dox in tumor tissues ().
Stronger antitumor immune responses by MbDox+US treatment in vivo
Syngeneic C57BL/6 or BALB/c mice were subcutaneously inoculated with irradiated tumor cells (105) treated with the different drug formulations. The tumor cells were then inoculated into the left flank as a tumor vaccine, and the opposite flanks were injected with the same untreated-tumor cells (106) after 7 days to establish tumor models for observation (). As shown in and , vaccination with tumor cells treated with Dox, MbDox, and MbDox+US, respectively, induced significant antitumor effects when compared to Mb or Mb+US treatment. However, vaccination with tumor cells treated with MbDox or MbDox+US induced more significant antitumor effects, the highest being with MbDox+US ( and ).
Figure 6. Stronger antitumor immune responses by MbDox+US treatment in vivo. A. Schematic illustration of in vivo experiments to evaluate the tumor vaccine potential of different formulations. B and C. Images of tumor masses (B) and tumor volumes (C) from right lower flanks (5 in each group) at day 21 were collected by a handheld imaging device (TM900). D and E. Cytotoxic T-lymphocyte (CTLs) responses against LL/2 (D) and CT26 (E) tumor cells (target cells) were performed using splenic monocytes from mice treated with indicated formulations. F. Production of antibodies against CT26 tumor lysates in sera from mice injected with indicated formulations was detected by Western blot. G. Splenic monocytes from mice treated with indicated formulations were isolated, and the B cells that secreted antibodies against LL/2 or CT26 lysates (APBCs) among these splenic monocytes were detected by ELISPOT assay. Representative images are shown. H. The average number of APBCs in 1 × 10⁵ spleenic monocytes in triplicate experiments was recorded from LL/2 and CT26 tumor models. Data are expressed as mean ± SEM, * indicates P < 0.05, ** indicates P < 0.001.
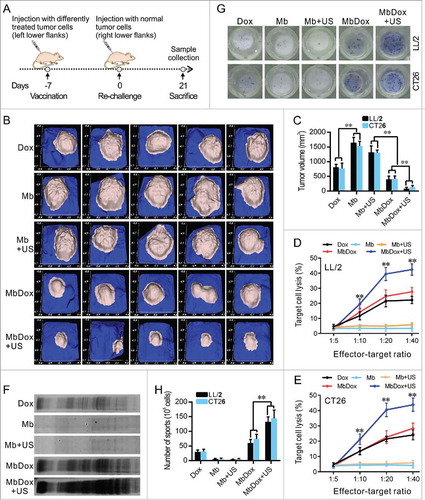
To test if the antitumor effects were related to the immune response, cytotoxic T-lymphocyte (CTL) responses against LL/2 and CT26 tumor cells were evaluated using splenic monocytes from mice injected with Dox, Mb, Mb+US, MbDox, and MbDox+US as effector cells, respectively. As shown in and , splenic monocytes from mice vaccinated with MbDox+US-treated tumor cells showed obviously increased cytotoxicity against LL/2 and CT26 cells, respectively, although splenic monocytes from mice vaccinated with Dox- or MbDox-treated tumor cells also showed moderate cytotoxicity compared with those from mice vaccinated with Mb- or Mb+US-treated tumor cells. In addition, active CD8+ T cell responses were detected by intracellular staining of IFN-γ followed by flow cytometry. The percentage of CD8+ T cells expressing IFN-γ was the highest in mice vaccinated with MbDox+US-treated tumor cells, although it was slightly increased in mice treated with Dox or MbDox compared with mice vaccinated with control microspheres in all four tumor models; however, the percentages of IFN-γ-producing CD8+ cells were more highly significant than IFN-γ-producing CD4+ cells ( and ). Moreover, humoral immunity induced by different drug formulations was examined by detection of specific antibodies and antibody-secreting B lymphocytes. Sera from mice vaccinated with Dox-, MbDox- or MbDox+US-treated cells contained antibodies against corresponding tumor cells compared with sera from mice vaccinated with Mb- or Mb+US-treated tumor cells, but a stronger antibody response was found in sera from mice vaccinated with MbDox- and MbDox+US-treated cells, with the latter being the strongest (). Similarly, the number of tumor-specific antibody-secreting B lymphocytes was slightly increased in the mice vaccinated with Dox-treated tumor cells, but moderately increased in those with MbDox-treated cells and highly increased in those with MbDox+US-treated tumor cells ( and ).
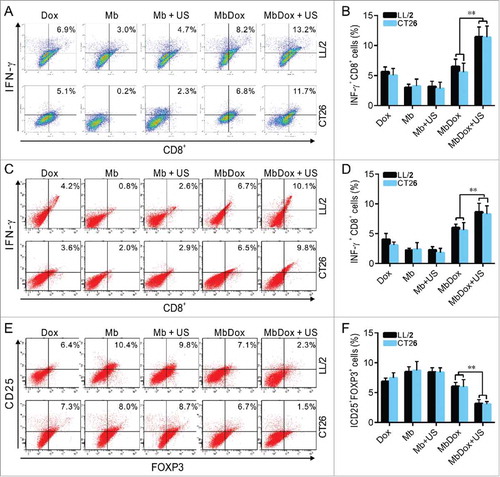
Figure 7. Increased reversion of the immunosuppressive microenvironment by MbDox+US treatment. A. Splenic monocytes from mice injected with indicated formulations were stained with anti-CD8 antibody and an anti-IFN-γ (intracellular) antibody, and then analyzed with flow cytometry. Representative images are shown. B. Percentages of IFN-γ-expressing CD8+ T cells analyzed by flow cytometry in LL/2 and CT26 tumor models. C. Tumor-infiltrating lymphocytes (TILs) from tumor tissues of both LL/2 and CT26 were analyzed by flow cytometry. Representative images the IFN-γ-producing CD8+T cells are shown. D. Percentage of the IFN-γ-producing CD8+ T cells in TILs from mice of LL/2 and CT26 models. E. CD4+ T cells in TILs were gated out and detected as CD25+ and FOXP3+ double-positive Treg cells by flow cytometry. Representative images of the CD4+CD25+FOXP3+ Treg cells are shown. F. Percentage of CD4+CD25+FOXP3+ Treg cells in TILs from mice of LL/2 and CT26 models. Data are expressed as mean ± SEM, * indicates P < 0.05, ** indicates P < 0.001.
Increased reversion of the immunosuppressive microenvironment by MbDox+US treatment
The immunosuppressive microenvironment established by tumors is the major reason for tumor immune escape and development.Citation37 Therefore, we investigated whether immune modulation by MbDox+US treatment was increased in both LL/2 and CT26 tumor models. We isolated tumor-infiltrating lymphocytes (TILs) from tumor tissues of both LL/2 and CT26 and analyzed them by flow cytometry. As shown in and , the percentage of IFN-γ-producing CD8+ T cells was significantly higher in tumor tissues from mice vaccinated with MbDox+US-treated tumor cells compared with mice vaccinated with Mb- or Mb+US-treated cells. In addition, CD4+CD25+FOXP3+ regulatory T (Treg) cells were also analyzed by flow cytometry. In contrast to IFN-γ-secreting CD8+ T cells, the percentage of Tregs was obviously lower in tumor tissues from the mice vaccinated with MbDox+US-treated tumor cells than in the mice vaccinated with other drug formulations ( and ).
Induction of stronger anti-tumor effects in immunocompetent mice by MbDox+US treatment
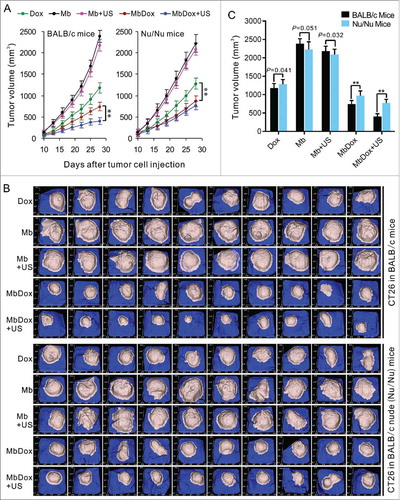
LL/2 and CT26 cells were subcutaneously implanted into immunocompetent (syngeneic C57BL/6 or BALB/c) and immunodeficient (BALB/c Nu/Nu) mice, respectively. When tumor masses were palpable (about 50 mm3), the mice were treated with different drug formulations in an interval of 3 days for 6 total treatments and observed to 28 days. As shown in , compared to the Mb and MB+US groups, the tumors in Dox, MbDox, and MbDox+US groups grew significantly slower, and the MbDox+US group grew the slowest, in both the immunocompetent and immunodeficient mice, respectively. However, the tumor growth was not significantly different between the MbDox and MbDox+US groups in the immunodeficient mice (). shows images of tumor masses (10 in each group) that were collected from CT26 models at day 25 in immunocompetent and immunodeficient mice. In addition, also showed that no significant difference between immunocompetent and inmmunodeficient mice treated with Dox, indicating that Dox works in a non-immunogenic fashion. However, we compared the tumor volume between the immunocompetent and inmmunodeficient mice at day 28 in CT26 model (). We found that the tumor growth was a little faster in the inmmunodeficient mice than in immunocompetent mice at the not Dox-treated groups (Mb and Mb+US), and there were significant difference (P = 0.051) between immunocompetent and inmmunodeficient mice treated with Mb (). If adjusts this difference, there are significant difference in all the Dox-treated groups between immunocompetent and inmmunodeficient mice.
Figure 8. Induction of stronger anti-tumor effects in immunocompetent mice by MbDox+US treatment. Murine LL/2 and CT26 tumor cells were injected into the right flanks of syngeneic C57BL/6 and BALB/c (10 mice/group) or Nu/Nu mice (10 mice/group). When tumor volumes reached 50 mm3, mice were treated with indicated formulations every 3 days for 6 total treatments. A. Tumor volumes at different time points in immunocompetent and in immunodeficient (Nu/Nu) mice, respectively. B. Tumor images of CT26 model at end points from immunocompetent and immunodeficient (Nu/Nu) mice, respectively. Data are expressed as mean ± SEM, * indicates P < 0.05, ** indicates P < 0.001.
Discussion
Growing evidence indicates that the US-controlled release of drugs or other molecules for targeted therapy by microbubbles or complexes is a promising approach for cancer therapy.Citation38-Citation42 Sonoporation can generate transient pores on cell membranes that result in the entry of extracellular drugs (such as Dox) into the cytoplasm.Citation25 However, there are no reports exploring the roles of ICD in treatments with MB complexes, although MB complexes are known to improve targeted tumor delivery and the accumulation of chemotherapeutic drugs.Citation20,Citation21,Citation40-Citation42 In this study, we prepared liposome-microbubble complexes (MbDox) containing Dox (an ICD inducer) in liposomes. We found that the US-controlled release of Dox (MbDox+US) increased the concentration of Dox in tumor tissues and strongly induced ICD in two different tumor models (LL/2 and CT26). Our results showed that MbDox+US treatment induced more ER stress-related exposure or secretion of DAMPs, including CRT, ATP, and HMGB1 ( and ). In addition, the subcutaneous injection of attenuated LL/2 and CT26 cells treated with MbDox+US as vaccines also induced stronger protection against subsequent re-challenge with the same live tumor cells in syngeneic immunocompetent mice (). Moreover, antitumor effects by MbDox+US treatment were stronger in immunocompetent mice than in immunodeficient mice (). These data strongly indicate that the US-controlled release of Dox by liposome-microbubble complexes induces enhanced ICD in LL/2 and CT26 tumor models.
Growing tumor cells can create an immunosuppressive microenvironment, which has become a major barrier for inducing effective antitumor immunity and successful tumor immunotherapy.Citation43-Citation45 Tumor cells create this suppressive microenvironment mainly through the secretion of suppressive factors (such as TGF-β, IL-10, and IDO), the expression of immune inhibitory molecules (such as PD-L1 and FasL), the inhibition of tumor-specific T-cell expansion, or even the direct induction of T-cell apoptosis.Citation44-Citation47 In addition, tumor cells can also recruit and expand in situ various types of suppressive tumor-infiltrating lymphocytes (TILs), such as regulatory T cells (Treg), tumor-derived macrophages, tolerogenic DCs, and myeloid suppressor cells (MSCs).Citation48-Citation52 Thus, in our present study, we also investigated whether the controlled release of Dox by MbDox+US could more strongly reverse the tumor immunosuppressive microenvironment. We found that MbDox+US treatment clearly increased mDC maturation and activation, as evidenced by the enhanced expression of mature markers (CD80 and CD86) and the secretion of active cytokine (INF-γ), respectively (). In addition, we also found that specific cellular (increased numbers of CTL- and INF-γ-secreting CD8+ lymphocytes) and humoral (increased titer of antibodies and number of antibody-secreting B lymphocytes) immunity against LL/2 and CT26 tumor cells was more strongly induced in mice vaccinated with tumor cells treated by MbDox+US (, and ). Moreover, the reversion of the tumor immunosuppressive microenvironment was directly evidenced by flow cytometry detection of INF-γ-secreting CD8+ and Treg (CD4+CD25+FOXP3+) lymphocytes from tumor tissues. Our results showed that the tumor tissues from mice inoculated with MbDox+US-treated tumor cells possessed more dense IFN-γ-producing CD8+ T-cell infiltration compared with tumor tissues from the mice treated with control tumor cells ( and ). In contrast, the percentage of Tregs was significantly lower in the tumor tissues from mice inoculated with MbDox+US-treated tumor cells than in the mice inoculated with control tumor cells ( and ). Taken together, these data demonstrate that the reversion of the immunosuppressive microenvironment by increasing active CD8+ T cells and decreasing Treg cells was a major mechanism involved in the enhanced immunity by MbDox+US treatment.
Solid tumors with histological characteristics, such as heterogeneous vascular supply and high interstitial pressure (particularly in the tumor core), create challenges for systemic therapy.Citation21 Thus, the development of an efficient targeted method for the delivery of antitumor drugs is urgently needed to enhance cellular uptake, improve drug bioavailability, and even enable the local and controlled release of drugs. Ultrasonic MBs are a promising approach for drug delivery due to their minimal invasiveness, local action, and proven safety record in ultrasonic imaging applications.Citation53,Citation54 In addition, using US to control the release of drugs can also combine cost-effective US imaging with US-mediated therapy.Citation21 In our current study, we found that MbDox+US treatment induced stronger ICD and better antitumor activities when compared with free Dox, Dox liposomes (bDoxL), and Dox-conjugated Mbs (MbDox) treatments in both LL/2 and CT26 tumor models, respectively. Liposome-MB complexes, such as MbDox, can be used not only for US-controlled targeted therapy, but also as acoustic probes for imaging (although further investigation is still needed). Thus, MbDox in this study may act as a theranostic agent that can integrate tumor imaging and targeted chemotherapy for future translation into clinical settings. Moreover, owing to the existence of acoustic MBs in MbDox, it can be used to observe or track the position of drugs in vivo after intravenous administration via US imaging. The accumulation of drug-carrying Mbs, such as MbDox, on tumors can be observed and even destroyed under real-time observation through US imaging, which is difficult to achieve with conventional drug formulations.
In our current study, it did not show significant difference between doxorubicin-treated immunocompetent and inmmunodeficient mice ( and ). If only consider these results, it can really indicate that Dox works in a non-immunogenic fashion. In our study, other results indicated Dox can induce most in vitro indicators of immunogenic cell death. We think these results may be related to a short observation time. In our study, we observed only 28 days, and the doxorubicin treatment only persisted to 18 days (began at day 10). As we know, effective immune response need at least 14 days. In addition, from the , we can see that the tumor growth was a little faster in the inmmunodeficient mice than in immunocompetent mice at the not Dox-treated groups (Mb and Mb+US), and there were significant difference (P = 0.051) between immunocompetent and inmmunodeficient mice treated with Mb at day 28 (). If adjusts this difference, there are significant difference in all the Dox-treated groups between immunocompetent and inmmunodeficient mice. Thus these results also suggest that Dox is an ICD inducer.
Dox is a member of the anthracycline family of DNA-intercalating agents. After entering tumor cells, Dox may accumulate in the nucleus due to its small size and high affinity for DNA.Citation55 However, some tumor cells possess ATP-binding cassette transporters, such as multidrug resistance related protein 1 and P-glycoprotein, by which Dox may be pumped out of tumor cells, thus lowering its cytotoxicity.Citation56 In this study, we found that US clearly enhanced the intracellular uptake of Dox, resulting in much more nuclear accumulation when tumor cells were treated with MbDox+US (). We think that the increased accumulation of Dox in nuclei is related to the sonoporation caused by inertial acoustic cavitation, resulting in increased cell membrane permeability by inducing transient pores on the cell membrane. Indeed, this phenomenon with Dox has been reported previously.Citation20,Citation57 The intranuclear drug concentration is a major contributor for the induction of ICD in tumor cells.
In summary, compared with the free ICD inducer (Dox) or only MB complex (MbDox), our results show that the US-controlled release of Dox by liposome-MB complexes (MbDox+US treatment) led not only to increased exposure or the release of ER stress proteins and DAMPs (two major ICD-markers) in vitro, but also a much stronger ICD effect in immunocompetent mice. MbDox+US treatment was effective mainly due to its targeted delivery, rapid intracellular uptake, and sustained nuclear retention of Dox. In addition, these effects may subsequently mediate more apoptotic damage and DAMP release into the tumor microenvironment, which in turn provokes improved antigen engulfment and presentation by DCs, resulting in the activation of CTLs and reversion of the suppressive tumor microenvironment. Our results demonstrate that the US-controlled release of ICD inducers into nuclei using liposome-MB complexes may be an effective approach to enhance the induction of ICD for tumor treatment.
Disclosure of potential conflicts of interest
The authors have declared that no competing interest exists.
Acknowledgment
This work was funded by the National Natural Science Foundation of China (81360482, 81560572, 81673346 and 81460020). We would like to thank LetPub (www.letpub.com) for providing linguistic assistance during the preparation of this manuscript.
Additional information
Funding
Related Research Data
References
- Galluzzi L, Kepp O, Kroemer G. Enlightening the impact of immunogenic cell death in photodynamic cancer therapy. EMBO J. 2012;31(5):1055–7. doi:10.1038/emboj.2012.2. PMID:22252132.
- Fahmueller YN, Nagel D, Hoffmann RT, Tatsch K, Jakobs T, Stieber P, Holdenrieder S. Immunogenic cell death biomarkers HMGB1, RAGE, and DNAse indicate response to radioembolization therapy and prognosis in colorectal cancer patients. Int J Cancer. 2013;132(10):2349–58. doi:10.1002/ijc.27894. PMID:23047645.
- Kroemer G, Galluzzi L, Kepp O, Zitvogel L. Immunogenic cell death in cancer therapy. Annu Rev Immunol. 2013;31:51–72. doi:10.1146/annurev-immunol-032712-100008. PMID:23157435.
- Krysko DV, Garg AD, Kaczmarek A, Krysko O, Agostinis P, Vandenabeele P. Immunogenic cell death and DAMPs in cancer therapy. Nat Rev Cancer. 2012;12(12):860–75. doi:10.1038/nrc3380. PMID:23151605.
- Kepp O, Senovilla L, Vitale I, Vacchelli E, Adjemian S, Agostinis P, Apetoh L, Aranda F, Barnaba V, Bloy N, et al. Consensus guidelines for the detection of immunogenic cell death. Oncoimmunology. 2014;3(9):e955691. doi:10.4161/21624011.2014.955691. PMID:25941621.
- Ladoire S, Enot D, Andre F, Zitvogel L, Kroemer G. Immunogenic cell death-related biomarkers: Impact on the survival of breast cancer patients after adjuvant chemotherapy. Oncoimmunology. 2016;5(2):e1082706. doi:10.1080/2162402X.2015.1082706. PMID:27057465.
- Obeid M, Tesniere A, Ghiringhelli F, Fimia GM, Apetoh L, Perfettini JL, Castedo M, Mignot G, Panaretakis T, Casares N, et al. Calreticulin exposure dictates the immunogenicity of cancer cell death. Nat Med. 2007;13(1):54–61. doi:10.1038/nm1523. PMID:17187072.
- Vacchelli E, Ma Y, Baracco EE, Sistigu A, Enot DP, Pietrocola F, Yang H, Adjemian S, Chaba K, Semeraro M, et al. Chemotherapy-induced antitumor immunity requires formyl peptide receptor 1. Science. 2015;350(6263):972–8. doi:10.1126/science.aad0779. PMID:26516201.
- Tesniere A, Schlemmer F, Boige V, Kepp O, Martins I, Ghiringhelli F, Aymeric L, Michaud M, Apetoh L, Barault L, et al. Immunogenic death of colon cancer cells treated with oxaliplatin. Oncogene. 2010;29(4):482–91. doi:10.1038/onc.2009.356. PMID:19881547.
- Schiavoni G, Sistigu A, Valentini M, Mattei F, Sestili P, Spadaro F, Sanchez M, Lorenzi S, D'Urso MT, Belardelli F, et al. Cyclophosphamide synergizes with type I interferons through systemic dendritic cell reactivation and induction of immunogenic tumor apoptosis. Cancer Res 2011;71(3):768–78. doi:10.1158/0008-5472.CAN-10-2788. PMID:21156650.
- Spisek R, Charalambous A, Mazumder A, Vesole DH, Jagannath S, Dhodapkar MV. Bortezomib enhances dendritic cell (DC)-mediated induction of immunity to human myeloma via exposure of cell surface heat shock protein 90 on dying tumor cells: therapeutic implications. Blood. 2007;109(11):4839–45. doi:10.1182/blood-2006-10-054221. PMID:17299090.
- Zhao X, Yang K, Zhao R, Ji T, Wang X, Yang X, Zhang Y, Cheng K, Liu S, Hao J, et al. Inducing enhanced immunogenic cell death with nanocarrier-based drug delivery systems for pancreatic cancer therapy. Biomaterials. 2016;102:187–97. doi:10.1016/j.biomaterials.2016.06.032. PMID:27343466.
- Zitvogel L, Kepp O, Senovilla L, Menger L, Chaput N, Kroemer G. Immunogenic tumor cell death for optimal anticancer therapy: the calreticulin exposure pathway. Clin Cancer Res. 2010;16(12):3100–4. doi:10.1158/1078-0432.CCR-09-2891. PMID:20421432.
- Pozzi C, Cuomo A, Spadoni I, Magni E, Silvola A, Conte A, Sigismund S, Ravenda PS, Bonaldi T, Zampino MG, et al. The EGFR-specific antibody cetuximab combined with chemotherapy triggers immunogenic cell death. Nat Med. 2016;22(6):624–31. doi:10.1038/nm.4078. PMID:27135741.
- Obeid M. ERP57 membrane translocation dictates the immunogenicity of tumor cell death by controlling the membrane translocation of calreticulin. J Immunol. 2008;181(4):2533–43. doi:10.4049/jimmunol.181.4.2533. PMID:18684944.
- Luo W, Wen G, Yang L, Tang J, Wang J, Wang J, Zhang S, Zhang L, Ma F, Xiao L, et al. Dual-targeted and pH-sensitive doxorubicin prodrug-microbubble complex with ultrasound for tumor treatment. Theranostics. 2017;7(2):452–65. doi:10.7150/thno.16677. PMID:28255342.
- Park J, Aryal M, Vykhodtseva N, Zhang YZ, McDannold N. Evaluation of permeability, doxorubicin delivery, and drug retention in a rat brain tumor model after ultrasound-induced blood-tumor barrier disruption. J Control Release. 2017;250:77–85. doi:10.1016/j.jconrel.2016.10.011. PMID:27742444.
- Zhang K, Xu H, Chen H, Jia X, Zheng S, Cai X, Wang R, Mou J, Zheng Y, Shi J. CO2 bubbling-based ‘Nanobomb’ System for Targetedly Suppressing Panc-1 Pancreatic Tumor via Low Intensity Ultrasound-activated Inertial Cavitation. Theranostics. 2015;5(11):1291–302. doi:10.7150/thno.12691. PMID:26379793.
- Liu HL, Fan CH, Ting CY, Yeh CK. Combining microbubbles and ultrasound for drug delivery to brain tumors: current progress and overview. Theranostics. 2014;4(4):432–44. doi:10.7150/thno.8074. PMID:24578726.
- Deng Z, Yan F, Jin Q, Li F, Wu J, Liu X, Zheng H. Reversal of multidrug resistance phenotype in human breast cancer cells using doxorubicin-liposome-microbubble complexes assisted by ultrasound. J Control Release. 2014;174:109–16. doi:10.1016/j.jconrel.2013.11.018. PMID:24287101.
- Yan F, Li L, Deng Z, Jin Q, Chen J, Yang W, Yeh CK, Wu J, Shandas R, Liu X, et al. Paclitaxel-liposome-microbubble complexes as ultrasound-triggered therapeutic drug delivery carriers. J Control Release. 2013;166(3):246–55. doi:10.1016/j.jconrel.2012.12.025. PMID:23306023.
- Tartis MS, McCallan J, Lum AF, LaBell R, Stieger SM, Matsunaga TO, Ferrara KW. Therapeutic effects of paclitaxel-containing ultrasound contrast agents. Ultrasound Med Biol. 2006;32(11):1771–80. doi:10.1016/j.ultrasmedbio.2006.03.017. PMID:17112963.
- Tay LM, Xu C. Coating microbubbles with nanoparticles for medical imaging and drug delivery. Nanomedicine (Lond). 2017;12(2):91–94. doi:10.2217/nnm-2016-0362. PMID:27876447.
- Snipstad S, Berg S, Morch Y, Bjorkoy A, Sulheim E, Hansen R, Grimstad I, van Wamel A, Maaland AF, Torp SH, et al. Ultrasound improves the delivery and therapeutic effect of nanoparticle-stabilized microbubbles in breast cancer xenografts. Ultrasound Med Biol. 2017;43(11):2651–2669. doi:10.1016/j.ultrasmedbio.2017.06.029. PMID:28781149.
- Wu J, Nyborg WL. Ultrasound, cavitation bubbles and their interaction with cells. Adv Drug Deliv Rev. 2008;60(10):1103–16. doi:10.1016/j.addr.2008.03.009. PMID:18468716.
- Wamel AV, Healey A, Sontum PC, Kvale S, Bush N, Bamber J, de Lange Davies C. Acoustic Cluster Therapy (ACT) – pre-clinical proof of principle for local drug delivery and enhanced uptake. J Control Release. 2016;224:158–64. doi:10.1016/j.jconrel.2016.01.023. PMID:26774223.
- Tsutsui JM, Xie F, Porter RT. The use of microbubbles to target drug delivery. Cardiovasc Ultrasound. 2004;2:23. doi:10.1186/1476-7120-2-23. PMID:15546496.
- Pitt WG, Husseini GA, Staples BJ. Ultrasonic drug delivery–a general review. Expert Opin Drug Deliv. 2004;1(1):37–56. doi:10.1517/17425247.1.1.37. PMID:16296719.
- Sennoga CA, Kanbar E, Auboire L, Dujardin PA, Fouan D, Escoffre JM, Bouakaz A. Microbubble-mediated ultrasound drug-delivery and therapeutic monitoring. Expert Opin Drug Deliv. 2017;14(9):1031–43. doi:10.1080/17425247.2017.1266328. PMID:27892760.
- Klibanov AL, Shevchenko TI, Raju BI, Seip R, Chin CT. Ultrasound-triggered release of materials entrapped in microbubble-liposome constructs: a tool for targeted drug delivery. J Control Release. 2010;148(1):13–7. doi:10.1016/j.jconrel.2010.07.115. PMID:20691227.
- Huang FY, Mei WL, Li YN, Tan GH, Dai HF, Guo JL, Wang H, Huang YH, Zhao HG, Zhou SL, et al. The antitumour activities induced by pegylated liposomal cytochalasin D in murine models. Eur J Cancer. 2012;48(14):2260–69. doi:10.1016/j.ejca.2011.12.018. PMID:22257793.
- Huang FY, Huang FR, Chen B, Liu Q, Wang H, Zhou SL, Zhao HG, Huang YH, Lin YY, Tan GH. Microencapsulation of tumor lysates and live cell engineering with MIP-3alpha as an effective vaccine. Biomaterials. 2015;53:554–65. doi:10.1016/j.biomaterials.2015.02.123. PMID:25890751.
- Fushimi T, Kojima A, Moore MA, Crystal RG. Macrophage inflammatory protein 3alpha transgene attracts dendritic cells to established murine tumors and suppresses tumor growth. J Clin Invest. 2000;105(10):1383–93. doi:10.1172/JCI7548. PMID:10811846.
- Racoosin EL, Swanson JA. Macrophage colony-stimulating factor (rM-CSF) stimulates pinocytosis in bone marrow-derived macrophages. J Exp Med 1989;170(5):1635–48. doi:10.1084/jem.170.5.1635. PMID:2681516.
- Panaretakis T, Kepp O, Brockmeier U, Tesniere A, Bjorklund AC, Chapman DC, Durchschlag M, Joza N, Pierron G, van Endert P, et al. Mechanisms of pre-apoptotic calreticulin exposure in immunogenic cell death. EMBO J. 2009;28(5):578–90. doi:10.1038/emboj.2009.1. PMID:19165151.
- Kazama H, Ricci JE, Herndon JM, Hoppe G, Green DR, Ferguson TA. Induction of immunological tolerance by apoptotic cells requires caspase-dependent oxidation of high-mobility group box-1 protein. Immunity. 2008;29(1):21–32. doi:10.1016/j.immuni.2008.05.013. PMID:18631454.
- Lindau D, Gielen P, Kroesen M, Wesseling P, Adema GJ. The immunosuppressive tumour network: myeloid-derived suppressor cells, regulatory T cells and natural killer T cells. Immunology. 2013;138(2):105–15. doi:10.1111/imm.12036. PMID:23216602.
- Yan WC, Chua QW, Ong XJ, Sharma VK, Tong YW, Wang CH. Fabrication of ultrasound-responsive microbubbles via coaxial electrohydrodynamic atomization for triggered release of tPA. J Colloid Interface Sci. 2017;501:282–93. doi:10.1016/j.jcis.2017.04.073. PMID:28460221.
- Liao WH, Hsiao MY, Lo CW, Yang HS, Sun MK, Lin FH, Chang Y, Chen WS. Intracellular triggered release of DNA-quaternary ammonium polyplex by ultrasound. Ultrason Sonochem. 2017;36:70–77. doi:10.1016/j.ultsonch.2016.11.002. PMID:28069241.
- Wang J, Li P, Tian R, Hu W, Zhang Y, Yuan P, Tang Y, Jia Y, Zhang L. A novel microbubble capable of ultrasound-triggered release of drug-loaded nanoparticles. J Biomed Nanotechnol. 2016;12(3):516–24. doi:10.1166/jbn.2016.2181. PMID:27280249.
- Graham SM, Carlisle R, Choi JJ, Stevenson M, Shah AR, Myers RS, Fisher K, Peregrino MB, Seymour L, Coussios CC. Inertial cavitation to non-invasively trigger and monitor intratumoral release of drug from intravenously delivered liposomes. J Control Release. 2014;178:101–7. doi:10.1016/j.jconrel.2013.12.016. PMID:24368302.
- Wang X, Guo S, Lu S, Zhou J, Li J, Xia S. Ultrasound-induced release of GDNF from lipid coated microbubbles injected into striatum reduces hypoxic-ischemic injury in neonatal rats. Brain Res Bull. 2012;88(5):495–500. doi:10.1016/j.brainresbull.2012.05.001. PMID:22579834.
- Ye J, Ma C, Hsueh EC, Dou J, Mo W, Liu S, Han B, Huang Y, Zhang Y, Varvares MA, et al. TLR8 signaling enhances tumor immunity by preventing tumor-induced T-cell senescence. EMBO Mol Med. 2014;6(10):1294–311. doi:10.15252/emmm.201403918. PMID:25231413.
- Croci DO, Zacarias Fluck MF, Rico MJ, Matar P, Rabinovich GA, Scharovsky OG. Dynamic cross-talk between tumor and immune cells in orchestrating the immunosuppressive network at the tumor microenvironment. Cancer Immunol Immunother. 2007;56(11):1687–700. doi:10.1007/s00262-007-0343-y. PMID:17571260.
- Whiteside TL. The tumor microenvironment and its role in promoting tumor growth. Oncogene. 2008;27(45):5904–12. doi:10.1038/onc.2008.271. PMID:18836471.
- Uyttenhove C, Pilotte L, Theate I, Stroobant V, Colau D, Parmentier N, Boon T, Van den Eynde BJ. Evidence for a tumoral immune resistance mechanism based on tryptophan degradation by indoleamine 2,3-dioxygenase. Nat Med. 2003;9(10):1269–74. doi:10.1038/nm934. PMID:14502282.
- Dong H, Strome SE, Salomao DR, Tamura H, Hirano F, Flies DB, Roche PC, Lu J, Zhu G, Tamada K, et al. Tumor-associated B7-H1 promotes T-cell apoptosis: a potential mechanism of immune evasion. Nat Med. 2002;8(8):793–800. doi:10.1038/nm730. PMID:12091876.
- Peng G, Wang HY, Peng W, Kiniwa Y, Seo KH, Wang RF. Tumor-infiltrating gammadelta T cells suppress T and dendritic cell function via mechanisms controlled by a unique toll-like receptor signaling pathway. Immunity. 2007;27(2):334–48. doi:10.1016/j.immuni.2007.05.020. PMID:17656116.
- Kiniwa Y, Miyahara Y, Wang HY, Peng W, Peng G, Wheeler TM, Thompson TC, Old LJ, Wang RF. CD8+ Foxp3+ regulatory T cells mediate immunosuppression in prostate cancer. Clin Cancer Res. 2007;13(23):6947–58. doi:10.1158/1078-0432.CCR-07-0842. PMID:18056169.
- Roncarolo MG, Gregori S, Battaglia M, Bacchetta R, Fleischhauer K, Levings MK. Interleukin-10-secreting type 1 regulatory T cells in rodents and humans. Immunol Rev. 2006;212:28–50. doi:10.1111/j.0105-2896.2006.00420.x. PMID:16903904.
- Kusmartsev S, Gabrilovich DI. Role of immature myeloid cells in mechanisms of immune evasion in cancer. Cancer Immunol Immunother. 2006;55(3):237–45. doi:10.1007/s00262-005-0048-z. PMID:16047143.
- Wei S, Kryczek I, Zou L, Daniel B, Cheng P, Mottram P, Curiel T, Lange A, Zou W. Plasmacytoid dendritic cells induce CD8+ regulatory T cells in human ovarian carcinoma. Cancer Res. 2005;65(12):5020–6. doi:10.1158/0008-5472.CAN-04-4043. PMID:15958543.
- Cochran MC, Eisenbrey J, Ouma RO, Soulen M, Wheatley MA. Doxorubicin and paclitaxel loaded microbubbles for ultrasound triggered drug delivery. Int J Pharm. 2011;414(1–2):161–70. doi:10.1016/j.ijpharm.2011.05.030. PMID:21609756.
- Rapoport N, Nam KH, Gupta R, Gao Z, Mohan P, Payne A, Todd N, Liu X, Kim T, Shea J, et al. Ultrasound-mediated tumor imaging and nanotherapy using drug loaded, block copolymer stabilized perfluorocarbon nanoemulsions. J Control Release. 2011;153(1):4–15. doi:10.1016/j.jconrel.2011.01.022. PMID:21277919.
- Gewirtz DA. A critical evaluation of the mechanisms of action proposed for the antitumor effects of the anthracycline antibiotics adriamycin and daunorubicin. Biochem Pharmacol. 1999;57(7):727–41. doi:10.1016/S0006-2952(98)00307-4. PMID:10075079.
- Germann UA. P-glycoprotein–a mediator of multidrug resistance in tumour cells. Eur J Cancer. 1996;32A(6):927–44. doi:10.1016/0959-8049(96)00057-3.
- Banerjee R, Tyagi P, Li S, Huang L. Anisamide-targeted stealth liposomes: a potent carrier for targeting doxorubicin to human prostate cancer cells. Int J Cancer. 2004;112(4):693–700. doi:10.1002/ijc.20452. PMID:15382053.