
ABSTRACT
Glioblastoma (GBM) promotes immunosuppression through upregulation of PD-L1 and regulatory T cell (Treg) expansion, but the association of these suppressive factors has not been well elucidated. Here, we investigate a role of PD-L1 in expanding Tregs and the value of targeting the PD-1 receptor to inhibit Treg expansion. Quantitative RNA sequencing data from The Cancer Genome Atlas were evaluated for an association between CD274 and FOXP3 transcript expressions and impact of FOXP3 on clinical outcomes. Peripheral leukocytes from patients with newly diagnosed GBM were profiled for PD-L1+ myeloid expressions and Treg abundance. Healthy lymphocytes were assessed for impact of recombinant PD-L1 on expansion of the inducible Treg (iTreg) population. iTreg function was evaluated by the capacity to suppress effector T cell proliferation. Specificity of responses were confirmed by pharmacologic inhibition of the PD-1 receptor. Increased PD-L1 mRNA expression in GBM corresponded to increased FOXP3 mRNA (p = 0.028). FOXP3 elevation had a negative impact on overall survival (HR = 2.0; p < 0.001). Peripheral PD-L1 positivity was associated with an increased Treg fraction (p = 0.008). Lymphocyte activation with PD-L1 co-stimulation resulted in greater iTreg expansion compared to activation alone (18.3% vs. 6.5%; p < 0.001) and improved preservation of the Treg phenotype. Suppressive capacity on naïve T cell proliferation was sustained. Nivolumab inhibited PD-L1-induced Treg expansion (p < 0.001). These results suggest that PD-L1 may expand and maintain immunosuppressive Tregs, which are associated with decreased survival in glioma patients. Blockade of the PD-L1/PD-1 axis may reduce Treg expansion and further improve T cell function beyond the direct impact on effector cells.
Introduction
Glioblastoma (GBM), the most common primary brain malignancy, is associated with a uniformly poor prognosis. Despite standard treatment with maximal surgical resection followed by radiotherapy and temozolomide chemotherapy, tumor progression is all but guaranteed, and the median overall survival for patients is approximately 16 months.Citation1-Citation3 Alternative treatment strategies for this aggressive disease are in high demand. Immunotherapy, which relies on the generation of a specific anti-tumor immune response, has garnered particular interest, but clinical efficacy has been impeded by systemic and intratumoral immunosuppression.Citation4,Citation5
Tumor-directed cytotoxic T lymphocytes (CTLs) have been shown to infiltrate the glioma microenvironment and are the primary effectors of the host response;Citation6 however, the ability of these CTLs to generate a sufficient anti-tumor effect is limited by several glioma-derived mechanisms of immunoresistance.Citation7 One shared mechanism of immunosuppression across multiple malignancies is the expansion of inducible regulatory T cells (iTregs). Tregs are known to accumulate in the GBM tumor microenvironment,Citation8” and they are able to inhibit proliferation and degranulation of CTLs.Citation9 The expansion of Tregs is associated with decreased efficacy of other immunotherapeutic strategies for GBM,Citation10 and therapeutic targeting of Tregs has been shown to improve survival in animal models.Citation11,Citation12 The abundance of Tregs in circulation has been shown to be proportional to tumor burden in patients with GBM, suggesting that Treg expansion is driven by tumor-derived factors.Citation13
CTL function is also regulated by immune checkpoints, which can be aberrantly overexpressed in the tumor microenvironment. The inhibitory checkpoint programmed death-ligand 1 (PD-L1) is highly expressed by multiple malignancies, including gliomas.Citation14,Citation15 Its aberrant expression in GBM has been linked to activation of the Akt pathway through the disruption of the tumor suppressor protein, PTEN, resulting in an upregulation of the ligand on the tumor cell surface.Citation16 Studies have also demonstrated upregulated expression of PD-L1 on tumor-associated macrophages (TAMs) within the microenvironment and on myeloid cells in the circulation of GBM patients, induced by glioma-derived soluble factors.Citation17-Citation20 PD-L1 interacts with activated T cells through its receptor, programmed death 1 (PD-1), to serve an inhibitory function, with downstream signaling leading to attenuation of the T cell immune response.Citation21 Increased expression of PD-L1 on myeloid cells in GBM patients has been correlated with worse survival in patients receiving vaccine immunotherapy.Citation22
While the upregulation of PD-L1 expression and the expansion of Tregs in GBM have independently been shown to inhibit anti-tumor immune responses, the interaction of these two factors has not been fully investigated. Expansion of iTregs during activation of CD4+ T cells results in increased PD-1 expression.Citation23,Citation24 Although binding of PD-1 to PD-L1 typically induces suppression of T cell function and proliferation, published data from murine models suggests that PD-L1/PD-1 interaction may have a proliferative effect on Tregs.Citation25 Other reports, however, have suggested that PD-1+ Tregs in glioma patients are dysfunctional.Citation26 The true impact of PD-1 expression in human Tregs and the effect of interaction with PD-L1 remains incompletely evaluated. In this study, we report the association of PD-L1 expression with Treg accumulation in GBM tumors and the impact on patient outcome. Furthermore, we demonstrate a functional role for PD-L1/PD-1 binding in the expansion and maintenance of the Treg phenotype.
Results
Glioblastoma tumors with elevated CD274 mRNA have increased FOXP3 expression
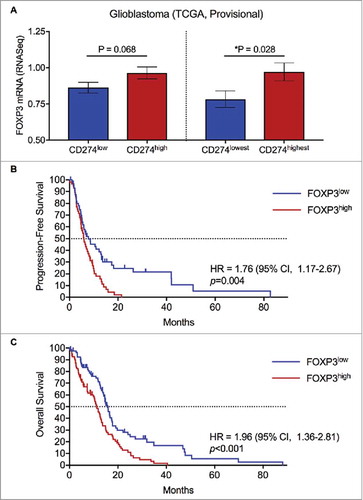
To evaluate the relationship between PD-L1 (CD274) transcript expression and Tregs, identified by FOXP3 expression, relative transcriptional expression across patient tumor samples in the TCGA was analyzed. From the TCGA provisional dataset, 166 GBM tumor samples had available mRNA expression levels for CD274 and FOXP3.Citation27,Citation28 Patient samples were divided into CD274high and CD274low groups based on mRNA expression levels relative to the median and in quartiles. FOXP3 mRNA expression trended greater in the CD274high group than the CD274low group ( , p = 0.068). When evaluating FOXP3 mRNA expression in the top and bottom quartiles of CD274 expression, the difference reached statistical significance ( , p = 0.028).
Figure 1. Regulatory T cell infiltration is associated with CD274 mRNA expression in GBM tumors, and predicts worse survival. (A) GBM tumor samples (n = 166) from the provisional TCGA dataset were divided into CD274low and CD274high by the median expression. FOXP3 mRNA expression was greater in the CD274high population with a trend towards significance. The top quartile of CD274 expressing tumors (n = 42) was compared to the bottom quartile CD274 expressing tumors (n = 42) for FOXP3 mRNA expression. CD274highest tumors had significantly greater FOXP3 mRNA (p = 0.028). (B) Patients were divided into FOXP3low and FOXP3high groups based on mRNA expression relative to the median. The FOXP3low subset had a median PFS of 7.9 months, compared to 6.0 months for the FOXP3high subset (p = 0.004). (C) Patients in the FOXP3low subset had a median OS of 15.8 months, compared to 11.2 months for the FOXP3high subset (p < 0.001).
FOXP3 expression impacts progression-free and overall survival in GBM
Tumor samples in the TCGA from patients with available FOXP3 mRNA expression data and clinical outcomes were analyzed to evaluate the impact on survival (). Patients were divided into FOXP3high and FOXP3low groups based on mRNA expression relative to the median. Median PFS for patients (n = 114) with FOXP3high tumors was 6.0 months vs. 7.9 months for FOXP3low tumors (HR = 1.76; 95% CI, 1.17 to 2.67; p = 0.004). Median OS for patients (n = 160) with FOXP3high tumors was 11.2 months vs. 15.8 months for FOXP3low tumors (HR = 1.96; 95% CI, 1.36 to 2.81; p < 0.001).
Peripheral Tregs are expanded in newly diagnosed GBM with PD-L1 upregulation
PBMCs from patients with newly diagnosed GBM (n = 69) were profiled for immune phenotype. Myeloid (CD45+CD11b+) expressions of PD-L1 ranged from 3.09-81.33% (). PD-L1low (n = 34) and PD-L1high (n = 35) cohorts had mean PD-L1 expressions of 9.68 and 31.59%, respectively. Peripheral Treg abundance was increased in the PD-L1high cohort compared to the PD-L1low (; p = 0.008).
Figure 2. Peripheral PD-L1 upregulation in newly diagnosed GBM is associated with Helios-independent peripheral Treg expansion. (A) PBMCs from patients with newly diagnosed GBM (n = 69) were assessed for PD-L1 expression on myeloid cells (CD11b+) and divided at the median into PD-L1Low (n = 34) and PD-L1High (n = 35) cohorts. (B) Patients in the PD-L1High cohort had greater peripheral Treg (CD25+FOXP3+) abundance than those in the PD-L1Low cohort (**p = 0.008). (C) In patients with elevated Treg fractions (n = 8), PD-L1+ and CD25+FOXP3+ peripheral expressions correlated positively (R = 0.62, p = 0.10); CD25+FOXP3+ and CD25+FOXP3+Helios+ expressions correlated negatively (R = -0.61, p = 0.10). (D) PBMCs with elevated CD25+FOXP3+ subsets (n = 8, range: 7.4-23.5%) were not predominantly Helios+.
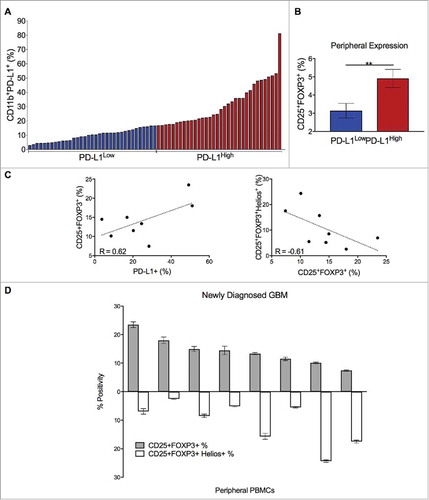
PBMCs from patients with the greatest Treg expansion (n = 8), regardless of PD-L1 status, were further profiled. Of CD4+ T cells, the CD25+FOXP3+ subset ranged from 7.4-23.5% (). Helios expression within CD25+FOXP3+ cells ranged from 2.5-24.4%. Helios positivity was inversely related to the Treg fraction (R = -0.61), while overall Treg abundance was positively associated with PD-L1 (R = 0.62) (). Correlations trended towards but did not reach statistical significance.
PD-L1 induces Treg expansion through PD-1 ligation
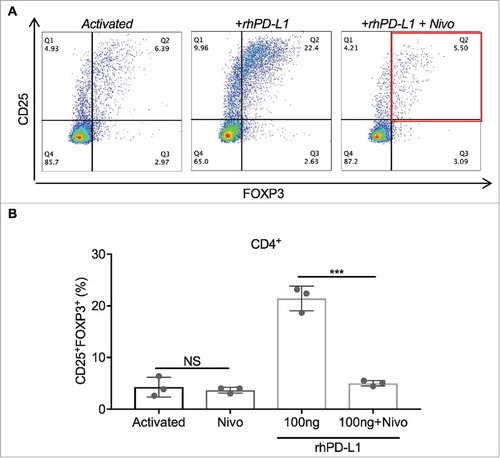
To directly study the effect of PD-L1 on Treg expansion, pan-T cells isolated from PBMCs were stimulated with a 1:4 dilution of anti-CD3/CD28 tetrameric complexes and cultured for 3 days, with and without exposure to plate-immobilized rhPD-L1 at 100 ng/mL (). iTregs, defined as the CD4+CD25+FOXP3+ subset, and total CD4+ PD-1 positivity were quantified. A control condition of inactivated T cells without rhPD-L1 exposure determined the baseline Treg fraction (1.1% of CD4+ cells) and total CD4+ PD-1 positivity (6.6%). With anti-CD3/CD28 activation of T cells alone, the iTreg subset increased to 6.5%, compared to 18.3% for activated T cells co-stimulated with rhPD-L1 ( p < 0.001; 95% CI, 8.6 to 15.2). Exposure to rhPD-L1 also led to a significant increase in CD4+ PD-1 positivity compared to activation alone (, p = 0.018; 95% CI, 7.2 to 43.1). In a separate experiment, T cells were activated in a rhPD-L1+ culture with and without the simultaneous addition nivolumab at 100 ng/mL. PD-1 blockade by nivolumab led to complete abrogation of Treg induction by the rhPD-L1 stimulation (, p < 0.001; 95% CI, 12.5 to 20.4).
Figure 3. PD-L1 induces Treg expansion and upregulates PD-1 expression. (A) Schematic of T cell activation protocol (Produced using Servier Medical Art). Cells were cultured for 72 hours after anti-CD3/CD28 stimulation with and without the presence of immobilized rhPD-L1 at 100 ng/mL. (B) Representative dot plots of CD25+ and FOXP3+ gating in cultured CD4+ T cells after activation and rhPD-L1 stimulation. iTregs are defined by the Q2 percentile (CD25+FOXP3+). (C) Activated CD4+ T cells in the presence of rhPD-L1 100 ng/mL had greater Treg induction compared to activated T cells alone (CD25+FOXP3+ = 18.3% vs. 6.5%; ***p < 0.001). All experiments were performed in triplicate. Error bars represent standard error. (D) Representative dot plots of PD-1+ gating in cultured CD4+ T cells. Activated and activated + rhPD-L1 subsets are compared. (E) Activated CD4+ T cells in the presence of rhPD-L1 100 ng/mL had increased PD-1+ expression compared to activated T cells alone (CD4+PD-1+ = 50.9% vs. 25.7%; *p = 0.018). All experiments were performed in triplicate. Error bars represent standard error.

Figure 4. PD-1 blockade prevents PD-L1-induced Treg expansion. (A) Representative dot plots of CD25+ and FOXP3+ gating in cultured CD4+ T cells. iTregs are defined by the Q2 percentile (CD25+FOXP3+). (B) Activated CD4+ T cells in the presence of rhPD-L1 100 ng/mL had iTreg expansion to 21.4%. With the addition of nivolumab 100 ng/mL, this expansion was prevented (5.0%; ***p < 0.001). In rhPD-L1− cultures, the addition of nivolumab had no difference in iTreg formation from activation alone (P = 0.63). All experiments were performed in triplicate. Error bars represent standard error. NS: No significance; Nivo: Nivolumab.
PD-L1-dependent iTreg expansion is proliferative and of the PD-1+ subset
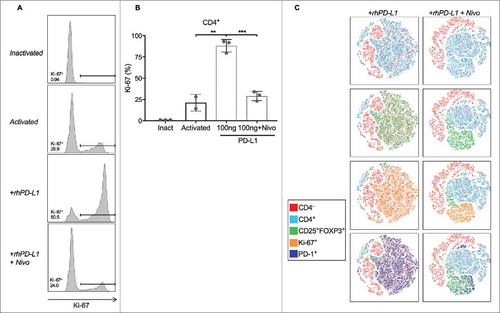
To distinguish whether expansion of iTregs stimulated through the PD-L1/PD-1 axis is by proliferation or non-proliferative phenotypic shifting, pan-T cells were stimulated with a 1:4 dilution of anti-CD3/CD28 tetrameric complexes for 3 days in the presence and absence of rhPD-L1. The proliferative effect on T cells was quantified by Ki-67 staining ( . Compared to activation alone, activated T cells in a rhPD-L1+ culture had more than a four-fold increase in CD4+ Ki-67 expression (p = 0.003; 95% CI, 42.8 to 91.0). Simultaneous addition of nivolumab prevented this proliferative effect (p < 0.001; 95% CI, 44.22 to 73.78). Characterization of the dataset by a tSNE algorithm demonstrated that the proliferating Ki-67+ cells were predominantely of a Treg phenotype and were co-positive for PD-1. ().
Figure 5. PD-L1 stimulates on Treg expansion through proliferation. (A) Representative histograms of Ki-67 positive staining in cultured CD4+ T cells. (B) Activated CD4+ T cells had a Ki-67+ population of 21.3%. In the presence of rhPD-L1, the Ki-67+ population increased to 88.1% (**p = 0.003). With the addition of nivolumab, the proliferative effects of rhPD-L1 were abrogated (Ki-67+ = 29.1%; ***p < 0.001). All experiments were performed in triplicate. Error bars represent standard error. (C) Activated T cells in a rhPD-L1+ culture with and without the addition of nivolumab at 100 ng/mL are displayed by a tSNE algorithm. CD25+FOXP3+ subsets are found within the CD4+ population, and are substantially decreased in the presence of nivolumab. Ki-67+ populations are contained within the CD25+FOXP3+ subset and are additionally PD-1+. Ki-67 positivity is notably decreased in the presence of nivolumab. Inact: Inactivated.
PD-L1 maintains the Treg phenotype with and without re-activation
To evaluate the impact of PD-L1 to PD-1 binding on the maintenance of Tregs after initial T cell activation and expansion, pan-T cells were cultured with a 1:1 dilution of anti-CD3/CD28 for a duration of 4 days to maximally expand the iTreg subset (∼77%), followed by separation of this population to a purity of >95%. The isolated Treg fraction was cultured for 3 more days with and without re-stimulation by anti-CD3/CD28 at a 1:2 dilution in rhPD-L1+ and rhPD-L1− conditions ().
Figure 6. PD-L1 maintains the CD25 and FOXP3 expression on Tregs. (A) Schematic of T cell activation for 72 hours followed by isolation of CD4+CD25+CD127lo iTreg and CD4+CD25− Teff subsets (Produced using Servier Medical Art). Isolated iTreg fractions were cultured for an additional 96 hours with and without the presence of immobilized rhPD-L1 at 100 ng/mL, re-stimulation with anti-CD3/CD28, and/or nivolumab at 300 ng/mL. (B) Following 72 hours of stimulation with anti-CD3/CD28, the CD25+FOXP3+ Treg subset was 76.9% of activated CD4+ T cells. (left panel) The CD4+CD25+CD127lo group was isolated by magnetic particle separation with a purity of 95%. (right panel). (C) Representative dot plots for CD25+ and FOXP3+ gates of cultured iTregs. CD4+CD25+CD127lo activated T cells were cultured for 72 hours after isolation, without re-stimulation of anti-CD3/CD28, and in rhPD-L1−, rhPD-L1+, and rhPD-L1+Nivo+ conditions. (D) Without re-stimulation of anti-CD3/CD28, isolated iTregs had a loss in CD25 and FOXP3 expression (17.9%, compared to 95% prior to culture). In an rhPD-L1+ culture, the CD25+FOXP3+ phenotype was increased (32.7%; ***p < 0.001). In an rhPD-L1+Nivo+ culture, this effect was diminished (27.3%; *p = 0.002). All experiments were performed in duplicate. Error bars represent standard error. (E) Representative dot plots for CD25+ and FOXP3+ gating of cultured iTregs. CD4+CD25+CD127lo activated T cells were cultured for 72 hours after isolation, with re-stimulation of anti-CD3/CD28, and in rhPD-L1−, rhPD-L1+, and rhPD-L1+Nivo+ conditions. (F) With re-stimulation of anti-CD3/CD28, isolated iTregs had a loss in CD25 and FOXP3 expression (30.7%). In an rhPD-L1+ culture, the CD25+FOXP3+ expression was markedly sustained (77.4%; **p = 0.002). In an rhPD-L1+Nivo+ culture, this effect was abrogated (29.4%; ***p < 0.001). All experiments were performed in triplicate. Error bars represent standard error.
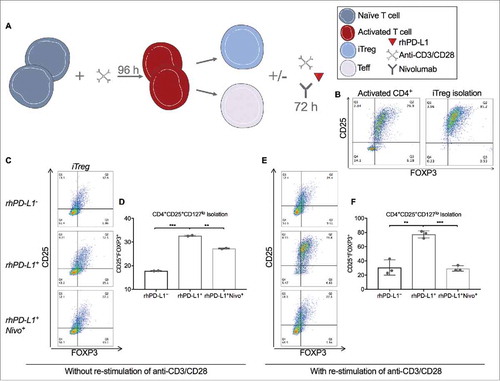
After 3 days without re-stimulation of anti-CD3/CD28, the iTreg population declined from 77% to 18%. In the presence of rhPD-L1, the iTreg phenotype was significantly better maintained, and the effect was diminished by PD-1 blockade with nivolumab at 300 ng/mL (; 32.7% vs. 27.3%; p = 0.002).
After 3 days with re-stimulation of anti-CD3/CD28, a greater preservation of the iTreg phenotype was observed (26.4%) compared to the condition without re-stimulation. With the addition of a rhPD-L1+ culture, re-stimulated iTregs had a dramatic preservation of the phenotype, which was completely abrogated in the presence of nivolumab (; 77.4% vs. 29.4%; p < 0.001).
PD-L1-induced Tregs have a sustained suppressive capacity on naïve T cell proliferation
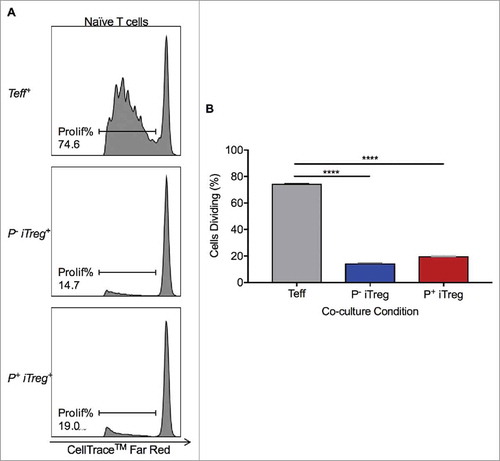
Having demonstrated that iTregs expanded with PD-L1 stimulation were largely PD-1+, the ability of these Tregs to suppress T cell proliferation was functionally investigated. iTregs generated from rhPD-L1+ culture (P+ iTregs) and rhPD-L1− culture (P− iTregs) were separately isolated by magnetic particle separation. The effector T cell (Teff) subset was additionally collected. Naïve pan-T cells stained with CellTrace™ Far Red were placed in 1:1 co-cultures with either P+ iTregs, P− iTregs, or Teffs, in the presence of anti-CD3/CD28 stimulation (). In a Teff co-culture, naïve T cells demonstrated the expected capacity to proliferate with stimulation. In comparison, co-culture with P− iTregs led to suppressed proliferation (14.5% vs. 74.7% dividing; p < 0.0001), as expected for functional Tregs. In a co-culture with P+ iTregs, proliferation was similarly suppressed (20.0% vs. 74.7% dividing; p < 0.0001).
Figure 7. PD-L1-induced Tregs maintain suppressive capacity. (A, B) iTregs and Teffs were isolated following a 96-hour T cell culture in the presence of anti-CD3/CD28. iTregs were generated with and without the additional presence of rhPD-L1 (P+ iTreg and P− iTreg, respectively). Naïve T cells were stained with 1 uM CellTrace™ Far Red for assessment of proliferation. In a Teff+ co-cultures, naïve T cells were allowed to proliferate (74.7%). P− and P+ iTreg co-cultures both significantly reduced naïve t cell proliferation (14.5% and 20.0%, respectively).
PD-1 blockade decreases peripheral Treg expansion in a murine glioma model
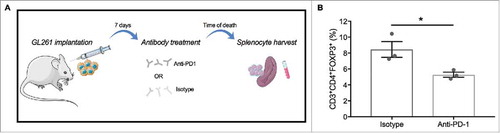
Injections of mouse glioma 261 (GL261) cells into C57 BL/6 mice induced intracranial tumor formation (n = 6). Models were pharmacologically treated with either an anti-PD-1 agent (n = 3) or isotype control (n = 3), and splenocytes were harvested at time of death for immune profiling. (). The Treg fraction, defined as the CD3+CD4+FOXP3+ subset, was diminished following PD-1 blockade, compared to isotype (; 5.28% vs 8.45%, respectively; p = 0.038).
Figure 8. Anti-PD-1 treatment diminishes the peripheral expansion of Tregs in a murine glioma model. (A) Schematic of intracranial injection of GL261 into C57 BL/6 mice followed by treatment with either an anti-PD-1 agent or isotype control and splenocyte harvest at time of death (Produced using Servier Medical Art). (B) Splenocyte immune profiling demonstrates a decrease in CD3+CD4+FOXP3+ expression peripherally for the treatment group (n = 3) compared to isotype (n = 3) (5.28% vs 8.45%, respectively; *p = 0.038).
Discussion
Tumor-associated immunosuppression remains a significant barrier for effective immunotherapy in the treatment of GBM, as in numerous other malignancies. Although a large number of immune modulating factors have been identified in patients with cancer, the impact of Treg expansion and expression of suppressive immune checkpoints such as PD-L1 have been the most widely studied and effectively targeted. PD-L1 can be highly expressed on GBM cells, similar to other solid tumors, but has also been shown to be elevated on tumor-infiltrating myeloid cells and myeloid-lineage cells in circulation.Citation16,Citation20 Through multiple sources of PD-L1 exposure, driven by tumor-derived factors, effector T cell function may be suppressed in the tumor microenvironment and systemically. Similarly, Treg expansion in circulation and within the tumor microenvironment can suppress effector T cell proliferation and cytotoxic function.Citation29 Treg expansion in gliomas has also been linked to tumor-associated factors, with Treg abundance being proportional to tumor burden.Citation12,Citation13 Despite the individual importance of these two factors in modulating cellular immunity to tumors, a mechanistic link between them has not been clearly demonstrated in human cancer. An association between PD-L1 expression and FOXP3+ Treg infiltration has been reported in the microenvironment of human breast cancers and soft tissue sarcomas, but the causal interaction was not explored.Citation30,Citation31 Published data from murine experiments has suggested that binding of PD-L1 to PD-1 on Tregs can promote differentiation and expansion.Citation25,Citation32 However, similar findings have not been previously confirmed in human subjects.
In the current study, we demonstrate the first association of PD-L1 expression with elevated FOXP3+ Treg infiltration in GBM patient tumors. Using quantitative transcript analysis from the TCGA, we found that in the highest and lowest quartiles of PD-L1 expression, there was a statistically significant correlation with FOXP3 expression. In addition, as has been previously shown in GBM and other cancers, FOXP3 expression was negatively correlated with survival. These findings were further supported by the peripheral immune profiling of patients with newly diagnosed GBM from our institution, where PD-L1high peripheral compartments were associated with greater Treg abundance than in PD-L1low compartments.
To investigate the origin of systemic Treg expansion in newly diagnosed GBM with PD-L1 upregulation, we analyzed those peripheral compartments of these patients for Helios expression within the CD25+FOXP3+ subset. Helios, a transcription factor of thymus-derived natural regulatory T cells (nTregs), has been previously reported as the predominant marker within Tregs that infiltrate the GBM tumor microenvironment.Citation33 However, we have found here that the peripheral expansion of Tregs in the setting of PD-L1 upregulation is independent of, if not inversely related to, the intracellular expression of Helios. This suggests then a role for PD-L1 in the expansion of the iTreg, rather than nTreg, subset. With additional evidence for the impact of systemic Tregs on GBM-associated outcomes, particularly in those receiving immunotherapeutic intervention,Citation34 our study supports the possibility that while nTregs are predominant within the tumor microenvironment, iTregs may be the more relevant immunosuppressive subset within the peripheral compartment.
Based on the published mechanistic data from murine experiments, we hypothesized that the PD-L1/iTreg correlation was related to PD-L1-stimulated expansion driven by its binding to PD-1 during activation. Through in vitro experiments in human T cells, we have demonstrated a greater than two-fold increase in Treg expansion with concurrent PD-L1/PD-1 stimulation, compared to PD-L1− culture conditions. We have also found a profound capacity for PD-L1 to preserve the existing phenotype of iTregs after routine stimulation and expansion. These findings corroborate previous reports in mice.Citation25
To investigate whether PD-L1 stimulation increases Treg abundance through a phenotypic shift in the CD4+ population or specific induction of proliferation in Tregs, we analyzed stimulated cells for Ki-67 expression as a marker for cell proliferation. We found a profound increase in Ki-67 positivity suggestive of significant proliferative expansion with PD-L1 stimulation. When evaluating the phenotype of the proliferating subpopulation, as demonstrated by tSNE analysis, cells positive for Ki-67 were nearly entirely of a Treg phenotype (CD4+CD25+FOXP3+). One would expect that stimulation of naïve pan-T cells with anti-CD3/CD28 activation would result in proliferative expansion of CD8+ and conventional CD4+ T cells as well. However, in the presence of high levels of PD-L1, as in our culture conditions, only the Treg population experiences a paradoxical expansion in response to PD-1 ligation—CD8+ and CD4+ effector T cell proliferation is inhibited by the known suppressive effect of PD-L1 binding to PD-1.
Although PD-1 expression can increase in all T cell subsets with chronic activation and exhaustion, our data suggests that expression in Tregs further enhances the suppressive capability of these cells when interacting with immune checkpoints, specifically PD-L1. It has previously been shown that PD-1 expression on Tregs is increased in the setting of cancer, including glioma.Citation26,Citation35,Citation36 However, PD-1+ Tregs have been historically considered dysfunctional, due to an associated increase in other exhaustive co-inhibitory molecules and increased phosphorylation of FoxO-1, indicative of PI3 K/Akt signaling hyperactivity that is antagonistic to FOXP3.Citation26,Citation37-Citation39 We sought to establish the functional capacity of PD-1+ iTregs expanded in the presence of PD-L1 to suppress effector T cell function. In co-culture, we demonstrated that PD-L1 stimulated iTregs and naturally expanded iTregs cultured without PD-L1 maintain the same suppressive effect on T cell proliferation.
In addition to demonstrating the impact of PD-L1 stimulation on Treg expansion and maintenance, we confirmed the effect was mediated by activation of the PD-1 receptor through pharmacologic inhibition of PD-1 by nivolumab. This is further supported by our assessment of the in vivo effects of PD-1 inhibition in a murine glioma model, where the Treg fractions were diminished compared to isotype control. Nivolumab, a clinical-grade human IgG4 monoclonal antibody against PD-1, has been shown to have high specificity and affinity for the PD-1 receptor. Its clinical efficacy in enhancing immune responses and survival has been proven for various systemic malignancies, and nivolumab is now approved as a first or second line treatment for melanoma, lung, and renal cell carcinoma.Citation40-Citation44 In GBM, the use of nivolumab as an immunotherapeutic treatment for newly diagnosed disease remains under investigation in two phase III clinical trials (Checkmate 548, NCT02667587; Checkmate 498, NCT02617589) and in combination with ipilimumab in a phase I trial (NRG-BN002, NCT02311920). If these studies prove positive, the question will arise whether nivolumab's inhibition of PD-1 on effector T cells is the primary reason for improved survival, or if an associated reduction in Treg expansion contributes to its effects. Based on the results presented in the current study, we propose that Treg abundance in circulation and in the tumor microenvironment should be evaluated as a possible biomarker for the likelihood of response to anti-PD-L1/anti-PD-1 therapies.
Beyond the traditional suppressive role of PD-L1 on tumor cells and tumor-associated immune cells in GBM, a stimulatory expansion of regulatory T cells indirectly enhances the immunoresistance of high PD-L1 tumors. Disruption of the PD-L1/PD-1 axis may therefore target two mechanisms of immunosuppression, making it more appealing than monotherapies directed at Tregs (anti-CD25 antibodies) or other checkpoints (anti-CTLA-4 antibodies). In addition, Treg abundance may serve as a prognostic biomarker for patients likely to respond to anti-PD-1/anti-PD-L1 therapies, or as a way to track response to treatment. Evaluation of Tregs should be incorporated into clinical trials of PD-L1/PD-1 targeting therapies in GBM.
Materials and methods
Study approval
Investigations, including the authorized use of patient samples and in vivo experimentation of murine models, were approved by the authors’ institutional review board. All procedures were conducted in accordance with the Helsinki Declaration of 1975.
Survey of the cancer genome atlas (TCGA)
Glioblastoma tumor samples with mRNA data provided by TCGA (Provisional data set, National Cancer Institute) were queried. FOXP3 and CD274 (PD-L1) mRNA expression determined by the RNA sequence method (RNASeq Version 2) were downloaded from the cBioPortal for Cancer Genomics (Memorial Sloan Kettering Cancer Center). Samples with CD274 mRNA data were divided at the median into CD274low and CD274high groups and compared for FOXP3 expression levels. Samples with FOXP3 mRNA data were divided at the median into FOXP3low and FOXP3high subsets and explored for differences in progression free survival (PFS) and overall survival (OS).
Peripheral blood mononuclear cell (PBMC) isolation and T cell purification
Whole peripheral blood was collected from healthy donors and patients with newly diagnosed GBM for isolation of PBMCs by density gradient centrifugation (Ficoll-Paque PLUS, GE Healthcare) at 2000 revolutions per minute for 20 minutes. Cells were frozen in 10% dimethyl sulfoxide (DMSO) and stored in a liquid nitrogen. Cells were once-thawed in a water bath at 37°C prior to use. When indicated, pan-T cells were isolated from PBMCs by immuno-negative magnetic particle selection following manufacturer instructions (EasySep™ Human T Cell Enrichment Kit #19051, StemCell). CD4+CD25+CD127lo Treg and CD4+CD25− effector T cell (Teff) subsets were purified from T cell cultures by a two-stage immuno-positive and immuno-negative magnetic particle selection following manufacturer instructions (EasySep™ Human Regulatory T Cell Isolation Kit #18063, StemCell).
Cell culture and flow cytometry reagents
T cell cultures were performed in treated, 96-well round bottom plates (Costar). Cells were suspended in RPMI-1640 media (Gibco) with 10% fetal bovine serum at 15,000 cells per well. Cells were harvested at 3-, 4-, and 6-day intervals depending on the assay.
The following anti-human antibodies were used for cell surface and intracellular staining of T cells: CD4 PE (clone OKT4, eBioscience), FOXP3 FITC (clone PCH101, eBioscience), CD25 APC (clone BC96, eBioscience), PD-1 PerCP eFluor-710 (clone MIH4, eBioscience), Helios PerCP eFluor-710 (clone 22F6, eBioscience), and Ki-67 Alexa Fluor 700 (clone SolA15, Invitrogen). The following anti-human antibodies were used for cell surface of myeloid cells: CD45 FITC (clone HI30, eBioscience), CD11b PerCP (clone DCIS1/18, Abcam), and PD-L1 PE (clone MIH1, eBioscience). Cells were washed, re-suspended in a 2% bovine serum albumin solution, and incubated with antibodies following manufacturer instructions. For assays requiring intracellular stains, cells were first fixed in a 2% paraformaldehyde solution (Thermo Scientific) and permeabilized with a saponin-based Perm/Wash buffer (BD Biosciences). Sample data were collected by flow cytometry on either a FACSCanto II cytometer with the FACSDiva Software (BD Biosciences) or an Attune NxT cytometer with the Attune NxT Software (Thermo Scientific). OneComp eBeads were used for compensation controls (Invitrogen). Fluorescence-minus-one (FMO) controls were used for appropriate gating of subsets. Post-hoc analyses and t-Distributed Stochastic Neighbor Embedding (tSNE) algorithms were performed with the FlowJo Software v10.3 (TreeStar).
Generation of iTregs
Following isolation, pan-T cells were activated using a tetrameric complex of anti-CD3 and anti-CD28 antibodies (ImmunoCult™ Human T Cell Activator #19071, StemCell). Activator concentrations varied from 1:1 to 1:4 dilutions from the stock solution, and cells were cultured for 3 or 4 days, dependent on the assay, to generate an inducible-Treg (iTreg) population.
PD-L1 effect on iTreg expansion
PD-L1+ cultures were prepared using a recombinant human PD-L1 (rhPD-L1) Fc Chimera protein (R&D Systems). rhPD-L1 was incubated at 100 ng/mL in 96-well plates at 37°C for 4 hours in the presence of a goat anti-human IgG Fc antibody (R&D Systems) to allow for dimerization and plate immobilization. Following immobilization, T cells were added for a 3-day culture and exposed to activating tetrameric antibody complexes at a 1:4 dilution. Control conditions included activated (anti-CD3/CD28) rhPD-L1− cultures and inactivated rhPD-L1− and rhPD-L1+ cultures. To confirm specificity of PD-L1 binding to PD-1, a subset of rhPD-L1+ cultures were also treated with the human IgG4 monoclonal antibody, nivolumab (Bristol-Myers-Squibb), at a concentration of 100 ng/mL.
PD-L1 effect on maintenance of iTregs
Pan-T cells were optimally activated with a 1:1 dilution of the anti-CD3/CD28 tetramer for a duration of 4 days. Activated cells were harvested and separated into CD4+CD25+CD127lo iTreg and CD4+CD25− Teff subsets by magnetic particle isolation. iTreg and Teff subsets were separately cultured with and without re-stimulation with the anti-CD3/CD28 tetramer at a 1:2 dilution, in the presence or absence of plate immobilized rhPD-L1 at 100 ng/mL. Stimulation with rhPD-L1 was also performed with simultaneous addition of nivolumab at 100 ng/mL for inhibition of the PD-1 receptor.
T cell suppression assay
iTregs were generated by stimulation of pan-T cells with anti-CD3/CD28 tetramer at a 1:4 dilution for 3 days, with and without the presence of immobilized rhPD-L1 at 100 ng/mL. CD4+CD25+CD127lo iTreg and CD4+CD25− Teff subsets were isolated from the rhPD-L1+ and rhPD-L1− cultures.
Naïve pan-T cells were separately isolated from PBMCs and stained with the CellTrace™ Far Red Cell Proliferation Kit (Invitrogen) at 1 uM to trace proliferation. Cells were co-cultured 1:1 with the isolated iTreg and Teff subsets for a total of 30,000 cells per well and a duration of 6 days, in the presence of anti-CD3/CD28 tetramers at a 1:2 dilution. Proliferation of T cells was evaluated by flow cytometry histograms gated on the CellTrace™.
Murine Anti-PD-1 assay
Immune competent C57 BL/6 J mice (Jackson Labs, 7-8 weeks old) were intracranially implanted with 300,000 syngeneic GL261 cells to model glioma burden in vivo. Briefly, 2 μL of GL261 cells suspended in PBS were injected via Hamilton syringe 1 mm caudal to the coronal suture and 2 mm lateral to the bregma at a depth of 3 mm. One week following tumor implantation, mice were intraperitoneally injected with an anti-PD-1 antibody (BioXCell, RMP1-14) or isotype control (BioXCell, 2A3) at 250 μg/dose, given every 3 days for a maximum of 8 treatments. Mice were sacrificed upon reaching a moribund state, and spleens were harvested for peripheral immune cell analysis. Single cell suspensions were achieved by passing spleens through a 70 μm filter and mononuclear cells were isolated through Ficoll-Paque density gradient centrifugation (GE Healthcare). Splenocyte derived mononuclear cells were stained for CD3 (eBioscience, 17A2 FITC), CD4 (eBioscience, RM4-5 APC), and FOXP3 (eBioscience, FJK-16 s PerCP-Cy5.5) prior to analysis by flow cytometry.
Statistical analysis
Statistical analyses were performed using SPSS v24 (IBM Corp). Continuous variables were compared using two-sided Student's t tests. The Kaplan-Meier method was used to estimate survival distributions for the TCGA dataset.Citation45 Differences between groups were assessed using the log-rank test, and hazard ratios were calculated by a univariate analysis. P-values < 0.05 were considered statistically significant.
Disclosure of potential conflicts of interest
No potential conflicts of interest were disclosed.
2017ONCOIMM0868R-f09-z-4c.tif
Download TIFF Image (959.4 KB)Additional information
Funding
References
- Chinot OL, Wick W, Mason W, Henriksson R, Saran F, Nishikawa R, Carpentier AF, Hoang-Xuan K, Kavan P, Cernea D, et al. Bevacizumab plus radiotherapy-temozolomide for newly diagnosed glioblastoma. N Engl J Med. 2014;370:709–22. doi:10.1056/NEJMoa1308345. PMID:24552318.
- Gilbert MR, Dignam JJ, Armstrong TS, Wefel JS, Blumenthal DT, Vogelbaum MA, Colman H, Chakravarti A, Pugh S, Won M, et al. A randomized trial of bevacizumab for newly diagnosed glioblastoma. N Engl J Med. 2014;370:699–708. doi:10.1056/NEJMoa1308573. PMID:24552317.
- Stupp R, Hegi ME, Mason WP, van den Bent MJ, Taphoorn MJ, Janzer RC, Ludwin SK, Allgeier A, Fisher B, Belanger K, et al. Effects of radiotherapy with concomitant and adjuvant temozolomide versus radiotherapy alone on survival in glioblastoma in a randomised phase III study: 5-year analysis of the EORTC-NCIC trial. Lancet Oncol 2009; 10:459–66. doi:10.1016/S1470-2045(09)70025-7. PMID:19269895.
- Tan AC, Heimberger AB, Khasraw M. Immune Checkpoint Inhibitors in Gliomas. Curr Oncol Rep. 2017;19:23. doi:10.1007/s11912-017-0586-5. PMID:28303490.
- Bloch O. Immunotherapy for malignant gliomas. Cancer Treat Res 2015; 163:143–58. doi:10.1007/978-3-319-12048-5_9. PMID:25468230.
- Dummer W, Niethammer AG, Baccala R, Lawson BR, Wagner N, Reisfeld RA, Theofilopoulos AN. T cell homeostatic proliferation elicits effective antitumor autoimmunity. J Clin Invest. 2002;110:185–92. doi:10.1172/JCI0215175. PMID:12122110.
- Albesiano E, Han JE, Lim M. Mechanisms of local immunoresistance in glioma. Neurosurg Clin N Am. 2010;21:17–29. doi:10.1016/j.nec.2009.08.008. PMID:19944963.
- Heimberger AB, Abou-Ghazal M, Reina-Ortiz C, Yang DS, Sun W, Qiao W, Hiraoka N, Fuller GN. Incidence and prognostic impact of FoxP3+ regulatory T cells in human gliomas. Clin Cancer Res. 2008;14:5166–72. doi:10.1158/1078-0432.CCR-08-0320. PMID:18698034.
- Fontenot JD, Gavin MA, Rudensky AY. Foxp3 programs the development and function of CD4+CD25+ regulatory T cells. Nat Immunol. 2003;4:330–6. doi:10.1038/ni904. PMID:12612578.
- Liau LM, Prins RM, Kiertscher SM, Odesa SK, Kremen TJ, Giovannone AJ, Lin JW, Chute DJ, Mischel PS, Cloughesy TF, et al. Dendritic cell vaccination in glioblastoma patients induces systemic and intracranial T-cell responses modulated by the local central nervous system tumor microenvironment. Clin Cancer Res. 2005;11:5515–25. doi:10.1158/1078-0432.CCR-05-0464. PMID:16061868.
- Fecci PE, Mitchell DA, Whitesides JF, Xie W, Friedman AH, Archer GE, Herndon JE, 2nd, Bigner DD, Dranoff G, Sampson JH. Increased regulatory T-cell fraction amidst a diminished CD4 compartment explains cellular immune defects in patients with malignant glioma. Cancer Res. 2006;66:3294–302. doi:10.1158/0008-5472.CAN-05-3773. PMID:16540683.
- Fecci PE, Ochiai H, Mitchell DA, Grossi PM, Sweeney AE, Archer GE, Cummings T, Allison JP, Bigner DD, Sampson JH. Systemic CTLA-4 blockade ameliorates glioma-induced changes to the CD4+ T cell compartment without affecting regulatory T-cell function. Clin Cancer Res. 2007;13:2158–67. doi:10.1158/1078-0432.CCR-06-2070. PMID:17404100.
- Crane CA, Ahn BJ, Han SJ, Parsa AT. Soluble factors secreted by glioblastoma cell lines facilitate recruitment, survival, and expansion of regulatory T cells: implications for immunotherapy. Neuro Oncol. 2012;14:584–95. doi:10.1093/neuonc/nos014. PMID:22406925.
- Dong H, Strome SE, Salomao DR, Tamura H, Hirano F, Flies DB, Roche PC, Lu J, Zhu G, Tamada K, et al. Tumor-associated B7-H1 promotes T-cell apoptosis: a potential mechanism of immune evasion. Nat Med. 2002;8:793–800. doi:10.1038/nm730. PMID:12091876.
- Wintterle S, Schreiner B, Mitsdoerffer M, Schneider D, Chen L, Meyermann R, Weller M, Wiendl H. Expression of the B7-related molecule B7-H1 by glioma cells: a potential mechanism of immune paralysis. Cancer Res. 2003;63:7462–7. PMID:14612546.
- Parsa AT, Waldron JS, Panner A, Crane CA, Parney IF, Barry JJ, Cachola KE, Murray JC, Tihan T, Jensen MC, et al. Loss of tumor suppressor PTEN function increases B7-H1 expression and immunoresistance in glioma. Nat Med. 2007;13:84–8. doi:10.1038/nm1517. PMID:17159987.
- Kuang DM, Zhao Q, Peng C, Xu J, Zhang JP, Wu C, Zheng L. Activated monocytes in peritumoral stroma of hepatocellular carcinoma foster immune privilege and disease progression through PD-L1. J Exp Med. 2009;206:1327–37. doi:10.1084/jem.20082173. PMID:19451266.
- Rodrigues JC, Gonzalez GC, Zhang L, Ibrahim G, Kelly JJ, Gustafson MP, Lin Y, Dietz AB, Forsyth PA, Yong VW, et al. Normal human monocytes exposed to glioma cells acquire myeloid-derived suppressor cell-like properties. Neuro Oncol. 2010;12:351–65. doi:10.1093/neuonc/nop023. PMID:20308313.
- Dziurzynski K, Wei J, Qiao W, Hatiboglu MA, Kong LY, Wu A, Wang Y, Cahill D, Levine N, Prabhu S, et al. Glioma-associated cytomegalovirus mediates subversion of the monocyte lineage to a tumor propagating phenotype. Clin Cancer Res. 2011;17:4642–9. doi:10.1158/1078-0432.CCR-11-0414. PMID:21490182.
- Bloch O, Crane CA, Kaur R, Safaee M, Rutkowski MJ, Parsa AT. Gliomas promote immunosuppression through induction of B7-H1 expression in tumor-associated macrophages. Clin Cancer Res. 2013;19:3165–75. doi:10.1158/1078-0432.CCR-12-3314. PMID:23613317.
- Freeman GJ, Long AJ, Iwai Y, Bourque K, Chernova T, Nishimura H, Fitz LJ, Malenkovich N, Okazaki T, Byrne MC, et al. Engagement of the PD-1 immunoinhibitory receptor by a novel B7 family member leads to negative regulation of lymphocyte activation. J Exp Med. 2000;192:1027–34. doi:10.1084/jem.192.7.1027. PMID:11015443.
- Bloch O, Lim M, Sughrue ME, Komotar RJ, Abrahams JM, O'Rourke DM, D'Ambrosio A, Bruce JN, Parsa AT. Autologous Heat Shock Protein Peptide Vaccination for Newly Diagnosed Glioblastoma: Impact of Peripheral PD-L1 Expression on Response to Therapy. Clin Cancer Res. 2017;23:3575–84. doi:10.1158/1078-0432.CCR-16-1369. PMID:28193626.
- Asano T, Meguri Y, Yoshioka T, Kishi Y, Iwamoto M, Nakamura M, Sando Y, Yagita H, Koreth J, Kim HT, et al. PD-1 modulates regulatory T-cell homeostasis during low-dose interleukin-2 therapy. Blood. 2017;129:2186–97. doi:10.1182/blood-2016-09-741629. PMID:28151427.
- Syed Khaja AS, Toor SM, El Salhat H, Ali BR, Elkord E. Intratumoral FoxP3+Helios+ Regulatory T Cells Upregulating Immunosuppressive Molecules Are Expanded in Human Colorectal Cancer. Front Immunol. 2017;8:619. doi:10.3389/fimmu.2017.00619. PMID:28603527.
- Francisco LM, Salinas VH, Brown KE, Vanguri VK, Freeman GJ, Kuchroo VK, Sharpe AH. PD-L1 regulates the development, maintenance, and function of induced regulatory T cells. J Exp Med. 2009;206:3015–29. doi:10.1084/jem.20090847. PMID:20008522.
- Lowther DE, Goods BA, Lucca LE, Lerner BA, Raddassi K, van Dijk D, Hernandez AL, Duan X, Gunel M, Coric V, et al. PD-1 marks dysfunctional regulatory T cells in malignant gliomas. JCI Insight. 2016;1(5):e85935. doi:10.1172/jci.insight.85935. PMID:27182555.
- Cerami E, Gao J, Dogrusoz U, Gross BE, Sumer SO, Aksoy BA, Jacobsen A, Byrne CJ, Heuer ML, Larsson E, et al. The cBio cancer genomics portal: an open platform for exploring multidimensional cancer genomics data. Cancer Discov. 2012;2:401–4. doi:10.1158/2159-8290.CD-12-0095. PMID:22588877.
- Gao J, Aksoy BA, Dogrusoz U, Dresdner G, Gross B, Sumer SO, Sun Y, Jacobsen A, Sinha R, Larsson E, et al. Integrative analysis of complex cancer genomics and clinical profiles using the cBioPortal. Sci Signal. 2013;6:pl1. doi:10.1126/scisignal.2004088. PMID:23550210.
- Ganesan AP, Johansson M, Ruffell B, Yagui-Beltran A, Lau J, Jablons DM, Coussens LM. Tumor-infiltrating regulatory T cells inhibit endogenous cytotoxic T cell responses to lung adenocarcinoma. J Immunol. 2013;191:2009–17. doi:10.4049/jimmunol.1301317. PMID:23851682.
- Li Z, Dong P, Ren M, Song Y, Qian X, Yang Y, Li S, Zhang X, Liu F. PD-L1 Expression Is Associated with Tumor FOXP3(+) Regulatory T-Cell Infiltration of Breast Cancer and Poor Prognosis of Patient. J Cancer. 2016;7:784–93. doi:10.7150/jca.14549. PMID:27162536.
- Que Y, Xiao W, Guan YX, Liang Y, Yan SM, Chen HY, Li QQ, Xu BS, Zhou ZW, Zhang X. PD-L1 Expression Is Associated with FOXP3+ Regulatory T-Cell Infiltration of Soft Tissue Sarcoma and Poor Patient Prognosis. J Cancer. 2017;8:2018–25. doi:10.7150/jca.18683. PMID:28819402.
- Chen X, Fosco D, Kline DE, Meng L, Nishi S, Savage PA, Kline J. PD-1 regulates extrathymic regulatory T-cell differentiation. Eur J Immunol. 2014;44:2603–16. doi:10.1002/eji.201344423. PMID:24975127.
- Wainwright DA, Sengupta S, Han Y, Lesniak MS. Thymus-derived rather than tumor-induced regulatory T cells predominate in brain tumors. Neuro Oncol. 2011;13:1308–23. doi:10.1093/neuonc/nor134. PMID:21908444.
- Fong B, Jin R, Wang X, Safaee M, Lisiero DN, Yang I, Li G, Liau LM, Prins RM. Monitoring of regulatory T cell frequencies and expression of CTLA-4 on T cells, before and after DC vaccination, can predict survival in GBM patients. PLoS One. 2012;7:e32614. doi:10.1371/journal.pone.0032614. PMID:22485134.
- Jacobs JF, Idema AJ, Bol KF, Nierkens S, Grauer OM, Wesseling P, Grotenhuis JA, Hoogerbrugge PM, de Vries IJ, Adema GJ. Regulatory T cells and the PD-L1/PD-1 pathway mediate immune suppression in malignant human brain tumors. Neuro Oncol. 2009;11:394–402. doi:10.1215/15228517-2008-104. PMID:19028999.
- Zhang Y, Huang S, Gong D, Qin Y, Shen Q. Programmed death-1 upregulation is correlated with dysfunction of tumor-infiltrating CD8+ T lymphocytes in human non-small cell lung cancer. Cell Mol Immunol. 2010;7:389–95. doi:10.1038/cmi.2010.28. PMID:20514052.
- Sauer S, Bruno L, Hertweck A, Finlay D, Leleu M, Spivakov M, Knight ZA, Cobb BS, Cantrell D, O'Connor E, et al. T cell receptor signaling controls Foxp3 expression via PI3K, Akt, and mTOR. Proc Natl Acad Sci U S A. 2008;105:7797–802. doi:10.1073/pnas.0800928105. PMID:18509048.
- Haxhinasto S, Mathis D, Benoist C. The AKT-mTOR axis regulates de novo differentiation of CD4+Foxp3+ cells. J Exp Med. 2008;205:565–74. doi:10.1084/jem.20071477. PMID:18283119.
- Li MO, Rudensky AY. T cell receptor signalling in the control of regulatory T cell differentiation and function. Nat Rev Immunol. 2016;16:220–33. doi:10.1038/nri.2016.26. PMID:27026074.
- Borghaei H, Paz-Ares L, Horn L, Spigel DR, Steins M, Ready NE, Chow LQ, Vokes EE, Felip E, Holgado E, et al. Nivolumab versus Docetaxel in Advanced Nonsquamous Non-Small-Cell Lung Cancer. N Engl J Med. 2015;373:1627–39. doi:10.1056/NEJMoa1507643. PMID:26412456.
- Brahmer J, Reckamp KL, Baas P, Crino L, Eberhardt WE, Poddubskaya E, Antonia S, Pluzanski A, Vokes EE, Holgado E, et al. Nivolumab versus Docetaxel in Advanced Squamous-Cell Non-Small-Cell Lung Cancer. N Engl J Med. 2015;373:123–35. doi:10.1056/NEJMoa1504627. PMID:26028407.
- Larkin J, Chiarion-Sileni V, Gonzalez R, Grob JJ, Cowey CL, Lao CD, Schadendorf D, Dummer R, Smylie M, Rutkowski P, et al. Combined Nivolumab and Ipilimumab or Monotherapy in Untreated Melanoma. N Engl J Med. 2015;373:23–34. doi:10.1056/NEJMoa1504030. PMID:26027431.
- Motzer RJ, Escudier B, McDermott DF, George S, Hammers HJ, Srinivas S, Tykodi SS, Sosman JA, Procopio G, Plimack ER, et al. Nivolumab versus Everolimus in Advanced Renal-Cell Carcinoma. N Engl J Med. 2015;373:1803–13. doi:10.1056/NEJMoa1510665. PMID:26406148.
- Weber JS, D'Angelo SP, Minor D, Hodi FS, Gutzmer R, Neyns B, Hoeller C, Khushalani NI, Miller WH, Jr., Lao CD, et al. Nivolumab versus chemotherapy in patients with advanced melanoma who progressed after anti-CTLA-4 treatment (CheckMate 037): a randomised, controlled, open-label, phase 3 trial. Lancet Oncol. 2015;16:375–84. doi:10.1016/S1470-2045(15)70076-8. PMID:25795410.
- Kaplan EL, Meier P. Nonparametric Estimation from Incomplete Observations. Journal of the American Statistical Association. 1958;53:457–81. doi:10.1080/01621459.1958.10501452.