
ABSTRACT
The profound but frequently transient clinical responses to BRAFV600 inhibitor (BRAFi) treatment in melanoma emphasize the need for combinatorial therapies. Multiple clinical trials combining BRAFi and immunotherapy are under way to further enhance therapeutic responses. However, to which extent BRAFV600 inhibition may affect melanoma immunogenicity over time remains largely unknown. To support the development of an optimal treatment protocol, we studied the impact of prolonged BRAFi exposure on the recognition of melanoma cells by T cells in different patient models. We demonstrate that autologous CD8+ tumor-infiltrating lymphocytes (TILs) efficiently recognized short-term (3, 7 days) BRAFi-treated melanoma cells but were less responsive towards long-term (14, 21 days) exposed tumor cells. Those long-term BRAFi-treated melanoma cells showed a non-proliferative dedifferentiated phenotype and were less sensitive to four out of five CD8+ T cell clones, present in the preexisting TIL repertoire, of which three recognized shared antigens (Tyrosinase, Melan-A and CSPG4) and one being neoantigen-specific. Only a second neoantigen was steadily recognized independent of treatment duration. Notably, in all cases the impaired T cell activation was due to a time-dependent downregulation of their respective target antigens. Moreover, combinatorial treatment of melanoma cells with BRAFi and an inhibitor of its downstream kinase MEK had similar effects on T cell recognition. In summary, MAP kinase inhibitors (MAPKi) strongly alter the tumor antigen expression profile over time, favoring evolution of melanoma variants cross-resistant to both T cells and MAPKi. Our data suggest that simultaneous treatment with MAPKi and immunotherapy could be most effective for tumor elimination.
Introduction
The BRAFV600 mutation, expressed in approximately 50% of melanomas, mediates constitutive activation of the BRAF-MEK-ERK pathway and therefore tumor proliferation. Since 2011, two selective inhibitors vemurafenib and dabrafenib have been approved for treatment of BRAFV600 mutant melanoma. However, the rapid and high rate of clinical responses to BRAF inhibitor (BRAFi) therapy in melanoma patients is often abolished by disease progression due to acquired resistance in tumor cells.Citation1,Citation2 Superior clinical responses can be achieved by BRAFi/MEKi combination therapies,Citation3-Citation6 but still disease progresses in the majority of treated patients.
Salvage therapies for patients with disease progression on BRAFi or BRAFi/MEKi often involve immunotherapies, e.g. immune checkpoint blockade to reinvigorate tumor-reactive T cells and generate sustained clinical response. The rationale for this therapeutic strategy is that BRAFi treatment enhances melanoma recognition by differentiation antigen-specific T cells in vitro and increases T cell infiltration/clonality in responding lesions in vivo.Citation7-Citation14 In addition, studies in mouse tumor models demonstrated a critical contribution of CD8+ T cells to BRAFi responses.Citation15-Citation17
But, after the development of acquired resistance to BRAFi therapy, the density of T cell infiltrates returns to pretreatment level.Citation7,Citation10,Citation14 Moreover, recent analyses of the transcriptomes from targeted therapy-resistant lesions revealed molecular signatures which could result in cross-resistance to immunotherapy, such as deficiency of CD8+ T cells and loss of antigen presentation.Citation18 So far only limited functional data is available on melanoma susceptibility towards autologous tumor-reactive CD8+ T cells after prolonged BRAFV600 inhibition, which is of critical importance for the guiding of optimal combination protocols.
In the present work, by exploring the activation of autologous TILs and multiple antigen-specific T cell clones present within the TIL repertoire, we demonstrate that BRAFi strongly alters the tumor antigen expression profile over time, resulting in resistance against CD8+ T cells specific for shared antigens and a neoantigen. Also long-term combinatorial BRAFi/MEKi treatment protected melanoma cells from T cell recognition. The fact that T cell-resistance coevolves with drug-resistance in melanoma cells argues against a sequential application of MAPKi and immunotherapy but favours simultaneous treatment regimens in order to prevent the development of immune evasive tumor variants.
Results
Melanoma cells lose their capacity to stimulate autologous CD8+ TILs in the course of BRAFi treatment
First, melanoma cells treated with BRAFi for different intervals were studied for their recognition by in vitro expanded autologous TILs, including short-term treated (3 d, 7 d), long-term treated (14 d, 21 d) and BRAFi-resistant tumor sublines. Short-term BRAFi treatment induced significant apoptosis in BRAFV600E-positive Ma-Mel-86c melanoma cells (). Residual vital cells presented with senescence-like features,Citation19 as indicated by enlarged/flattened cell morphology and elevated ß-galactosidase activity (). Prolonged treatment till day 21 did not further reduce cell numbers and cells remained in a senescence-like state. After approximately one month of continuous inhibitor exposure, a BRAFi-resistant proliferative Ma-Mel-86c variant (Ma-Mel-86c/Res) was established (data not shown). As shown in , short-term treated tumor cells stimulated autologous CD8+ TILs to release IFNγ as efficiently as untreated control cells. But, after 14 d of BRAFi treatment, the ability of melanoma cells to induce IFNγ release by CD8+ TILs was significantly reduced. This effect was found to be most pronounced for Ma-Mel-86c/Res cells.
Figure 1. Melanoma cells lose their capacity to stimulate autologous CD8+ TILs in the course of BRAFi treatment. (A) BRAFi (vemurafenib, 0.5 µM) induces apoptosis in Ma-Mel-86c tumor cells after 3 and 7 d of treatment, as measured by flow cytometry. Percentage of Annexin V+ cells is depicted as mean+SEM (n = 3). *, p < 0.05. (B) Staining for senescence-associated β-galactosidase activity in Ma-Mel-86c cells after 3, 7, 14 or 21 d of BRAFi treatment and corresponding non-treated control cells (ctrl). Representative images from one of three independent experiments. (C) Activation of autologous bulk CD8+ TILs by BRAFi-treated cells (3, 7, 14, 21 d) or BRAFi-resistant (Res) Ma-Mel-86c cells was determined by intracellular IFNγ staining. Results are shown as fold change of IFNγ+ CD8+ T cells stimulated by BRAFi-treated tumor cells relative to corresponding untreated tumor cells (n = 3). *, p < 0.05, BRAFi vs ctrl. (D) Surface expression of HLA class I and PD-L1 on Ma-Mel-86c cells after BRAFi treatment (0.5 µM). Data are depicted as ratio of mean fluorescence intensity of HLA-class I to PD-L1 (mean+SEM, n >3). *, p < 0.05, BRAFi vs ctrl.
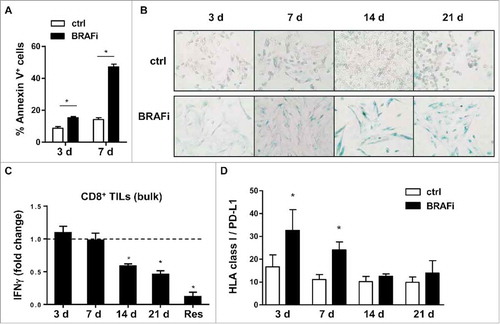
Next, surface expression of HLA class I and PD-L1 was analysed on BRAFi-treated Ma-Mel-86c cells. Flow cytometry data revealed that the ratio of HLA class I to PD-L1 molecules reverted from significantly increased for short-term treated cells back to the level of untreated control cells, excluding that the impaired T cell recognition of long-term BRAFi-treated Ma-Mel-86c cells was due to biased surface expression of HLA class I and PD-L1 (, Fig. S1A and S1B).
Taken together, our data indicate that BRAFi can alter tumor immunogenicity in a time-dependent manner: short-term treated tumor cells efficiently activate the pre-existing CD8+ TIL repertoire, whereas long-term inhibition decreases T cell activation.
Melanoma cells acquire resistance against autologous shared antigen-specific T cells
Assuming that BRAFi treatment could influence the expression of antigens recognized by CD8+ T cells, we took advantage of the knowledge about previously defined tumor antigens in patient model Ma-Mel-86, Lübcke et al., unpublishedCitation20 including shared antigens and neoantigens (). Using peptide-loaded autologous EBV-transformed B-cells as targets we detected CD8+ TILs recognizing Tyrosinase- and CSPG4 (HMW-MAA)-derived peptide epitopes (). Expression of Tyrosinase was upregulated after short-term BRAFi treatment but gradually disappeared in the long-term treated cells (). MITF, the master regulator for melanoma differentiation, followed a similar expression pattern, indicating a switch to a dedifferentiated cell phenotype (). Accordingly, the enhanced recognition of short-term BRAFi-treated melanoma cells by the autologous Tyrosinase-specific CD8+ T cell clone 5C/149 was followed by a significant decrease in case of long-term treated target cells (). Activation of the CSPG4-specific T cell clone 11C/73 was significantly reduced in both short-term and long-term treatment settings (), which correlated with the stable downregulation of CSPG4 expression under BRAFi treatment (). To prove that protection from CD8+ T cell recognition was indeed due to the decrease in antigen expression, and not caused by defects in antigen presentation, long-term (21 d) BRAFi-treated Ma-Mel-86c cells were pulsed with synthetic antigenic peptides before assaying their T cell-stimulatory capacity (). As shown in , peptide-loaded long-term BRAFi-treated tumor cells were efficiently recognized by the corresponding CD8+ T cell clones. Furthermore, we analyzed the influence of BRAFi on the expression of specific components of the antigen processing machinery (APM) in melanoma cells. As shown in , BRAFi exposure induced HLA heavy chain and ERAP1 protein expression, especially after long-term exposure. Meanwhile, mRNA levels of B2M, TAP1, and TAPBP remained unaffected upon BRAFi treatment, while HLA-A was significantly upregulated at all analyzed time points (Fig. S1C), arguing against an acquired defect in APM component expression in BRAFi-treated tumor cells.
Figure 2. Melanoma antigen-specific CD8+ T cell clones in patient model Ma-Mel-86. (A) Antigen specificity and HLA-restriction of CD8+ T cell clones from patient Ma-Mel-86 used in this study. (B) Detection of T cells with known antigen specificity among TILs from patient Ma-Mel-86. Synthetic peptides-loaded (1 µg/ml) autologous EBV-transformed B cells (auto. EBV-B) were used as antigen-presenting cells and cocultured with TILs for 4 h. Percentage of IFNγ-producing CD8+ TILs was determined by using intracellular cytokine staining and depicted as mean+SEM (n = 3). Non-loading or irrelevant peptide-loaded B cells were used as negative controls.
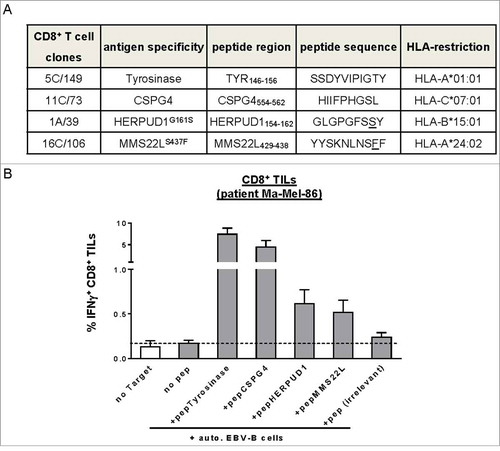
Figure 3. Activation of pre-existing shared antigen-specific CD8+ T cells by BRAFi-treated autologous tumor cells in patient model Ma-Mel-86. (A) Expression of pERK, ERK, Tyrosinase, Melan-A, MITF, HLA heavy chains, and ERAP1 in BRAFi-treated and -untreated Ma-Mel-86c cells was analysed by Western blot. GAPDH served as loading control. Representative data from one of at least two independent experiments. (B) Activation of Tyrosinase-specific CD8+ T cell (CTL) clone 5C/149 and (C) CSPG4-specific CD8+ T cell (CTL) clone 11C/73 by autologous BRAFi-treated (0.5 µM) Ma-Mel-86c cells was determined by IFNγ ELISpot assay. Results are presented as fold change of IFNγ spots from T cells stimulated with BRAFi-treated relative to untreated tumor cells. Data is depicted as mean+SEM (n = 3). *, p < 0.05, BRAFi vs ctrl. (D) Surface expression of CSPG4 on BRAFi-treated Ma-Mel-86c cells was measured by flow cytometry. Unstained tumor cells were used as negative control (light-grey empty lines). Representative data from one of three independent experiments. (E) Activation of antigen-specific CD8+ T cells by BRAFi-treated (0.5 µM for 21 d) Ma-Mel-86c cells was determined by IFNγ ELISpot. Loading of synthetic antigenic peptides (1 µg/ml) or blockade of HLA class I (W6/32, 50 µg/ml) on tumor cells was performed at 37°C for 30 min before T cell stimulation. Results are presented as fold change of IFNγ spot numbers relative to IFNg spots obtained by T cells stimulated with untreated (ctrl) tumor cells. Data is depicted as mean+SEM (n = 3). *, p < 0.05.
Thus, Ma-Mel-86c cells acquired resistance against shared antigen-specific T cells due to the loss of differentiation antigen expression already two weeks after the onset of BRAFi treatment and an early-initiated steady downregulation of the CSPG4 antigen.
In a second patient model, Ma-Mel-63, we observed similar alterations in shared antigen expression, such as Tyrosinase, Melan-A and CSPG4 ( and ), indicating the broader applicability of our findings. Although Ma-Mel-63a cells upregulated HLA heavy chain and ERAP1 expression and showed a constantly enhanced ratio of HLA-class I to PD-L1 surface expression under BRAFi exposure ( and ), activation of a Melan-A-specific CD8+ T cell clone was significantly impaired when stimulated with long-term treated Ma-Mel-63a cells (14d and 21d, ). Moreover, the dedifferentiated BRAFi-resistant subline Ma-Mel-63a/Res was no longer capable of stimulating Melan-A-specific T cells due to the complete loss of target antigen expression ( and ).
Figure 4. Regulation of antigen expression by BRAFi in tumor cells and its impact on Melan-A-specific CD8+ T cell activation in patient model Ma-Mel-63. (A) Expression of pERK, ERK, Tyrosinase, Melan-A, MITF, HLA heavy chains, and ERAP1 in BRAFi (vemurafenib, 0.5 µM)-treated or -untreated BRAFV600E-positive Ma-Mel-63a cells was determined by Western blot. GAPDH served as loading control. Representative data from one of at least two independent experiments. (B) Surface expression of CSPG4 on BRAFi-treated and -untreated (3, 7, 14 or 21 d, filled dark grey) Ma-Mel-63a cells was measured by flow cytometry. Unstained tumor cells were used as negative control (filled light grey). Representative data from one of three independent experiments. (C) Surface expression of HLA-class I and PD-L1 on Ma-Mel-63a cells after BRAFi treatment (0.5 µM). Data are depicted as ratio of mean fluorescence intensity of HLA class I to PD-L1 (mean+SEM, n = 4–5). *, p < 0.05, BRAFi vs ctrl. (D) IFNγ release by Melan-A-specific, HLA-A2-restricted CD8+ T cell clone stimulated with BRAFi-treated or -untreated Ma-Mel-63a cells (HLA-A2+) was determined by ELISA and one representative data from two independent experiments is shown as mean+SEM. (E) Expression of Tyrosinase, Melan-A and MITF in BRAFi-naive or -resistant (Res) Ma-Mel-63a cells was determined by Western blot. GAPDH served as loading control. Representative data from three independent experiments. (F) IFNγ release by Melan-A-specific, HLA-A2-restricted CD8+ T cell clone stimulated with BRAFi-naive or -Res Ma-Mel-63a cells (HLA-A2+) was determined by ELISA and one representative data from two independent experiments is shown as mean+SEM.
BRAFi differentially impacts on neoantigen-specific CD8+ T cell recognition
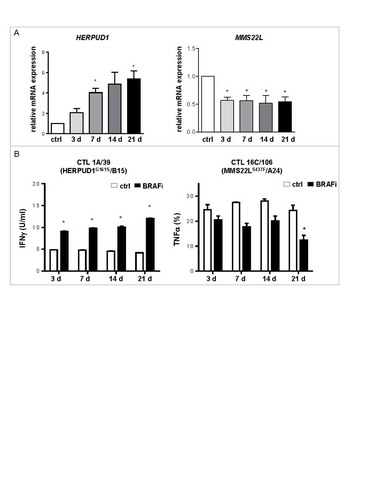
Besides shared antigens, also neoantigens have been defined in patient model Ma-Mel-86.Citation20 CD8+ T cells specifically targeting two neoantigens, HERPUD1G161S and MMS22LS437F, were readily detectable in TILs (). While BRAFi treatment upregulated HERPUD1 mRNA expression in Ma-Mel-86c cells, it led to a reduction in MMS22L mRNA expression (). Consistent with the antigen expression pattern, the HERPUD1G161S-specific CD8+ T cell clone 1A/39 showed enhanced activation by BRAFi-treated autologous tumor cells independent of treatment duration, whereas responsiveness of the MMS22LS437F-specific CD8+ T cell clone 16C/106 to BRAFi-treated tumor cells decreased over time (). Thus, besides shared antigens, presentation of a neoantigen, generally considered as an ideal target in immunotherapy,Citation21 was impaired by long-term BRAFi treatment of Ma-Mel-86c cells.
Figure 5. BRAFi treatment differentially impacts on neoantigen-specific CD8+ T cell recognition. (A) mRNA levels of HERPUD1 and MMS22 L in Ma-Mel-86c cells after BRAFi treatment (vemurafenib, 0.5 µM) were quantified by qPCR and normalized to endogenous RPLP0 mRNA. Expression levels (mean+SEM, n = 3) are depicted relative to the expression in untreated cells (ctrl). *, p < 0.05, BRAFi vs ctrl. (B) IFNγ release by HERPUD1G161S-specific CD8+ T cell clone 1 A/39 stimulated with BRAFi-treated or -untreated Ma-Mel-86c cells (HLA-B*15:01 transfectant) was determined by ELISA and one representative data from two independent experiments is shown as mean+SEM. Percentage of TNFα+ cells in MMS22LS437F-specific CD8+ T cell clone 16C/106 stimulated with BRAFi-treated or -untreated Ma-Mel-86c cells (HLA-A*24:02 transfectant) was determined by intracellular cytokine staining (mean+SEM, n = 2). *, p < 0.05, BRAFi vs ctrl.
Evolution of T cell resistance in the course of BRAFi/MEKi treatment
Combination therapy with BRAFi/MEKi is currently replacing BRAFi monotherapy as the standard of care treatment for BRAFV600 mutant melanomas. Therefore, we further investigated the impact of combinatorial BRAFi/MEKi treatment on melanoma cell immunogenicity. As shown in , short-term BRAFi/MEKi-exposed Ma-Mel-86c cells efficiently stimulated autologous CD8+ T cells whereas the T cell-stimulatory capacity of long-term BRAFi/MEKi-treated tumor cells was strongly impaired and even abolished in case of double drug-resistant melanoma cells. Comparable to Ma-Mel-86c, long-term BRAFi/MEKi-treated as well as double drug-resistant Ma-Mel-63a cells showed a strong reduction in T cell stimulation (). Also the regulation of melanoma differentiation antigens in BRAFi- and BRAFi/MEKi-treated tumor cells followed a similar pattern. Short-term exposure to BRAFi/MEKi upregulated Tyrosinase, Melan-A and MITF expression in the investigated melanoma cell lines, followed by their downregulation in long-term treatment settings ( and ).
Figure 6. Evolution of T cell resistance in the course of combinatorial BRAFi/MEKi treatment. Activation of autologous bulk CD8+ T cells by BRAFi/MEKi-treated (3, 7, 14, 21 d) or BRAFi/MEKi-resistant (Res) Ma-Mel-86c (A) and Ma-Mel-63a cells (B) was determined by intracellular IFNγ staining. Results are shown as fold change of IFNγ+ CD8+ T cells stimulated by BRAFi/MEKi-treated tumor cells relative to corresponding untreated tumor cells (n = 3). *, p < 0.05, BRAFi/MEKi vs ctrl. (C, D) Expression of pERK, ERK, Tyrosinase, Melan-A, and MITF in BRAFi/MEKi-treated or -untreated Ma-Mel-86c (C) and Ma-Mel-63a (D) cells was determined by Western blot. GAPDH served as loading control. Representative data from one of at least three independent experiments.
Taken together, the effects of BRAFi single treatment on T cell recognition of melanoma cells were recapitulated by BRAFi/MEKi exposure with melanoma cells developing cross-resistance to both CD8+ T cells and MAPKi after long-term treatment.
Discussion
Numerous clinical trials combining BRAFi and immunotherapy are currently ongoing to further enhance therapeutic responses against melanoma (http://www.clinicaltrials.gov). To support the development of a rationale for the optimal treatment protocol, we here used autologous human T cell/melanoma models to illustrate the impact of BRAFi on tumor immunogenicity over time. To our knowledge, this is the first study, which precisely evaluated the time-dependent alteration of T cell activation by BRAFi-treated melanoma cells at the level of multiple antigens.
We found that BRAFi strongly altered the antigen expression profile in the investigated melanoma cell lines. Consistent with several published studies,Citation11-Citation13 we observed that short-term BRAFi treatment in tumor cells enhanced the expression of shared melanoma differentiation antigens, such as Tyrosinase and Melan-A, and resulted in improved tumor recognition by corresponding antigen-specific T cells. In parallel, another shared antigen, CSPG4, and one mutated antigen, MMS22LS437F, showed an early-suppressed expression, which was readily detectable after 3 days of inhibitor exposure. Of note, long-term BRAFi treatment led to downregulation of the initially upregulated differentiation antigens and, therefore, significantly decreased T cell activation. Moreover, BRAFi/MEKi treatment recapitulated the evolution of melanoma resistance to T cells detected under single BRAFi treatment.
Exposure of melanoma cells to BRAFi did not adversely affect the expression of specific APM components, arguing against the involvement of a BRAFi-induced deficient antigen processing and presentation in T cell resistance. But still, we cannot exclude that also the overexpression of specific antigen processing components in BRAFi-treated tumor cells such as the trimming peptidase ERAP1 might decrease rather than enhance the generation of specific peptide epitopes. Previously, it was demonstrated that ERAP1 trimming activity destroys the Melan-A26-35 epitope,Citation22 suggesting that ERAP1 activity contributes to the low stimulatory capacity of long-term BRAFi-treated Ma-Mel-63a cells towards Melan-A26-35–specific T cells.
Compared to BRAFi alone, BRAFi/MEKi treatment has significantly improved the clinical outcome of patients with BRAFV600 mutant melanoma.Citation5 In line with the clinical observation, Deken et al. demonstrated a more persistent infiltration of T cells into responding melanoma lesions of both BRAFi/MEKi-treated tumor-bearing mice and some melanoma patients.Citation17 However, to which extent tumor-specific T cells influenced this BRAFi/MEKi induced response remains unclear. Here, we observed similar pattern of antigen regulation and tumor-specific T cell activation between BRAFi/MEKi and BRAFi treated melanoma cells at all time points analyzed, suggesting that BRAFi/MEKi treatment is not superior to BRAFi single treatment in boosting and prolonging the activation of the pre-existing T cell repertoire.
Our finding that melanoma acquires cross-resistance to tumor-specific T cells after long-term BRAFi and BRAFi/MEKi treatment might partially explain why T cell infiltrates in resistant lesions were similar or even below to the levels in pretreatment biopsies.Citation7,Citation10,Citation14,Citation18 Complementary to recent transcriptome studies on MAPKi-treated melanomas,Citation18,Citation23 our functional investigation contributes a dynamic mechanistic insight into the scenarios how impaired CD8+ T cell activation co-evolves with targeted therapy resistance.
Therefore, we assume that simultaneous or early sequential combination of BRAFV600-directed treatment and immunotherapy could be most effective in preventing the development of immune-evasive tumor variants. Indeed, simultaneous administration of BRAFi or BRAFi/MEKi together with diverse immunotherapies prolonged survival and reduced tumor growth in mouse models.Citation13,Citation15,Citation16,Citation23-Citation25 In a pilot study, Deniger et al. demonstrated that administration of vemurafenib two weeks prior to TILs generated objective but non-synergistic clinical responses, similar to that of TILs or vemurafenib alone,Citation26 while a retrospective analysis indicates that patient outcomes of anti-CTLA4 therapy following BRAFi resistance are poor.Citation27 Furthermore, our data raise the need for more comprehensive analyses of tumor antigen alterations by MAPKi in future studies, in order to understand the precise influence of targeted therapies on cancer immunogenicity.
Materials and methods
Patient samples
Samples from melanoma patients, including tumour tissues and peripheral blood cells were collected after approval by the institutional review board and patient informed written consent. Tissues were mechanically dissected for generation of cell lines or expansion of TILs. Melanoma cell lines were tested for mycoplasma in monthly intervals and authenticated by genetic profiling on genomic DNA at the Institute for Forensic Medicine (University Hospital Essen) using the AmpFLSTR-Profiler Plus kit (Applied Biosystems). Tumor cells were cultured in RPMI1640 medium (Gibco life technologies) supplemented with 10% FCS and penicillin/streptomycin at 37°C in a 5% CO2 atmosphere. Expansion of TILs was achieved by culturing suspension cells from tumor tissue in RPMI 1640 supplemented with 10% FCS, penicillin/streptomycin, and 500 IU/ml rhIL-2 (Chiron Corporation) for 2–5 weeks.
CD8+ T cell clones from Patient Ma-Mel-86 and Melan-A26-35 specific CD8+ T cell clone are generated as previously described.Citation20,Citation28
Prolonged inhibitor treatment strategy
Briefly, melanoma cells were seeded at a density of 1 × 10⁶ cells per 75 cm2 culture flasks in RPMI1640 medium with 10% FCS and penicillin/streptomycin. After overnight resting, cells were treated with 0.5 µM vemurafenib (BRAFi, Selleckchem) alone or in combination with 50 nM trametinib (MEKi, Selleckchem) for the indicated days. Subsequent treatment with fresh inhibitors was performed twice a week until the termination of experiments.
Apoptosis assay
After 3 or 7 days of inhibitor treatment, all cells were harvested, washed with PBS and resuspended in binding buffer (10 mM HEPES, pH 7.4; 140 mM NaCl; 2.5 mM CaCl2). For the staining 5 µl of Annexin V-APC (BD Biosciences) and 10 µl of propidium iodite (BD Biosciences) were added to 100 µl of 1 × 10⁵ cells and incubated for 15 min at room temperature. After the incubation 400 µl of binding buffer were added and the samples were measured immediately by flow cytometry.
Senescence-associated ß-galactosidase assay
Cells were either left untreated or treated with 0.5 µM vemurafenib for indicated days followed by washing with phosphate-buffered saline (PBS) and fixed with 37% formaldehyde in PBS for 5 min at room temperature. After rinsing with PBS, cells were subjected to ß-Gal assay as described by Dimri et al.Citation29 and photographed under light microscopy.
Flow cytometry
Tumor cells were stained for surface expression with the anti-CSPG4-PE (Miltenyi Biotec., 5 µl/test), anti-HLA-class I-APC (eBiosciences, clone W6/32, 0.5 µl/test), and anti-PD-L1-PE antibodies (Biolegend, clone 29E2A3, 2 µl/test). Background fluorescence was determined by unstained samples. Cells were analysed after fixation in 4% Paraformaldehyde in a Gallios flow cytometer and the Kaluza software was used for data analysis (Beckman Coulter).
Western blot
Tumor cells were lysed in 1 x Cell Lysis buffer (Cell Signaling) supplemented with 1 mM PMSF. Lysates were prepared by centrifugation at 13000 rpm for 15 min at 4° C. Proteins were separated by 10% SDS-polyacrylamide gel electrophoresis, electroblotted onto nitrocellulose membranes and probed with the following primary antibodies: anti-ERK1/2 (Cell Signaling, 1:5000), anti-pERK1/2 (Cell Signaling, clone D13.14.4E, 1:2500), anti-MITF (Sigma-Aldrich, clone C5, 1:1000), anti-Tyrosinase (Santa Cruz, T311, 1:500), anti-Melan-A (Zytomed, clone M2-7C10, 1:5000), anti-HLA heavy chain (Nordic-MUbio, clone HC-10, 1:5000), anti-ERAP1 (R&D, AF2334, 1:1000) and anti-GAPDH (Cell Signaling, clone 14C10, 1:5000). After washing, membranes were incubated with the appropriate secondary antibodies linked to horseradish peroxidase. Antibody binding was visualized with the ECL chemiluminescence system (Thermo Fisher Scientific).
Assays of T cell activation
Intracellular cytokine staining was performed in TILs after co-culture experiment. Briefly, 1 × 10⁵ TILs were stimulated for 4 h with the indicated tumor cells (1 × 10⁵ cells) in AIM-V complete medium containing 10 µg/mL Brefeldin A (Sigma-Aldrich). Cells were then fixed/permeabilized using the Fixation/Permeabilization Concentrate and Diluent kit (eBioscience) followed by staining with antibody cocktail containing anti-human CD3-Brilliant Violet 421 (1 µl/test), CD8-APC-Cy7 (1 µl/test), CD4-APC (1 µl/test), and IFNγ-PE (5 µl/test) antibodies (Biolegend). Cells were analysed in a Gallios flow cytometer and the Kaluza software was used for data analysis (Beckman Coulter).
Activation of CD8+ T cell clone 16 C/106 was demonstrated by intracellular TNFα staining using the anti-human CD8-APC-Cy7 (1 µl/test) and TNFα-PC7 (3 µl/test) antibodies (Biolegend), following the above described protocol.
Other T cell clones were measured as IFNγ release by ELISpot assay or ELISA. For ELISpot assay, multiscreen-HA plates (Millipore) were coated with 5 µg/mL anti-IFNγ mAb 1-D1 K (Mabtech). 2 × 10³ – 5 × 10³ T cells in AIM-V complete medium were seeded together with tumour cells (5 × 10⁴ cells/well). After 20-hour incubation at 37°C in 5% CO2, a biotinylated secondary anti-IFNγ antibody (1 µg/mL, clone 7-B6-1, Mabtech) was used and spots were developed by sequential addition of 1:1000 diluted ExtrAvidin alkaline phosphatase and BCIP®/NBT Liquid Substrate System (Sigma-Aldrich). Spot numbers were determined with the AID ELISpot reader (AID Diagnostika). For ELISA, supernatants were then collected from the U-bottom plate after 24 h coincubation of T cells and tumor cells and analysed by using following reagents: capture mAb 1-D1K (2 µg/mL) and biotinylated detection mAb 7-6B-1 (1 µg/mL) (Mabtech), Streptavidin-alkaline phosphatase complex (Vectastain Elite Kit; Vector Laboratories), p-nitro-phenyl-phosphate substrate solution (Sigma-Aldrich). The spectrophotometric absorbance at 405 nm was determined after suitable developing time, approx. 10–20 min.
Quantitative real-time PCR
Total mRNA was isolated from tumour cells using RNeasy Plus Kit (Qiagen) and polyadenylated RNA was reverse transcribed into cDNA using High Capacity cDNA Reverse Transcription Kit (Applied Biosystems) following the instructions of the manufacturers. Real-time PCR was carried out with specific TaqMan Gene Expression assays. Relative RNA expression was calculated by the 2−ΔΔCt method after normalizing expression levels of investigated mRNA to ribosomal protein lateral stalk subunit P0 (RPLP0) mRNA.
Statistical analysis
Quantitative data were plotted as mean+standard error (SEM). For comparison between experimental groups the two-tailed student's t-test was performed using the GraphPad Prism software (GraphPad, version 6.02). Experimental groups were considered to be significantly different with p < 0.05 (indicated by *).
Disclosure of potential conflicts of interest
S. Haferkamp participated in advisory board from Roche Pharma, BMS, received speaker honoraria from Amgen, Novartis, BMS and received research funding from Novartis and BMS. B. Schilling reports receiving honoraria from Roche and travel support as well research funding from Bristol-Myers Squibb. D. Schadendorf is an advisory board member and receives honoraria from Roche, Genentech, Novartis, Amgen, GlaxoSmithKline, Bristol-Myers Squibb, Boehringer Ingelheim, and Merck Sharp & Dohme. No potential conflicts of interest were disclosed by the other authors.
2017ONCOIMM0911R-f07-z-bw.pdf
Download PDF (15.7 KB)Additional information
Funding
References
- Chapman PB, Hauschild A, Robert C, Haanen JB, Ascierto P, Larkin J, Dummer R, Garbe C, Testori A, Maio M, et al. Improved survival with vemurafenib in melanoma with BRAF V600E mutation. N Eng J Med. 2011;364(26):2507–16. doi:10.1056/NEJMoa1103782. PMID:21639808.
- Nazarian R, Shi H, Wang Q, Kong X, Koya RC, Lee H, Attar N, Sazegar H, Chodon T, Nelson SF, et al. Melanomas acquire resistance to B-RAF(V600E) inhibition by RTK or N-RAS upregulation. Nature. 2010;468(7326):973–7. doi:10.1038/nature09626. PMID:21107323.
- Long GV, Stroyakovskiy D, Gogas H, Levchenko E, de Braud F, Larkin J, Garbe C, Jouary T, Hauschild A, Grob JJ, et al. Combined BRAF and MEK inhibition versus BRAF inhibition alone in melanoma. N Eng J Med. 2014;371(20):1877–88. doi:10.1056/NEJMoa1406037. PMID:25265492.
- Larkin J, Ascierto PA, Dreno B, Atkinson V, Liszkay G, Maio M, Mandalà M, Demidov L, Stroyakovskiy D, Thomas L, et al. Combined vemurafenib and cobimetinib in BRAF-mutated melanoma. N Eng J Med. 2014;371(20):1867–76. doi:10.1056/NEJMoa1408868. PMID:25265494.
- Robert C, Karaszewska B, Schachter J, Rutkowski P, Mackiewicz A, Stroiakovski D, Lichinitser M, Dummer R, Grange F, Mortier L, et al. Improved overall survival in melanoma with combined dabrafenib and trametinib. N Eng J Med. 2015;372(1):30–9. doi:10.1056/NEJMoa1412690. PMID:25399551.
- Long GV, Weber JS, Infante JR, Kim KB, Daud A, Gonzalez R, Sosman JA, Hamid O, Schuchter L, Cebon J, et al. Overall survival and durable responses in patients with BRAF V600-mutant metastatic melanoma receiving Dabrafenib combined with Trametinib. J Clin Oncol. 2016;34(8):871–8. doi:10.1200/JCO.2015.62.9345. PMID:26811525.
- Frederick DT, Piris A, Cogdill AP, Cooper ZA, Lezcano C, Ferrone CR, Mitra D, Boni A, Newton LP, Liu C, et al. BRAF inhibition is associated with enhanced melanoma antigen expression and a more favorable tumor microenvironment in patients with metastatic melanoma. Clin Cancer Res. 2013;19(5):1225–31. doi:10.1158/1078-0432.CCR-12-1630. PMID:23307859.
- Cooper ZA, Frederick DT, Juneja VR, Sullivan RJ, Lawrence DP, Piris A, Sharpe AH, Fisher DE, Flaherty KT, Wargo JA. BRAF inhibition is associated with increased clonality in tumor-infiltrating lymphocytes. Oncoimmunology. 2013;2(10):e26615. doi:10.4161/onci.26615. PMID:24251082.
- Donia M, Fagone P, Nicoletti F, Andersen RS, Hogdall E, Straten PT, Andersen MH, Svane IM. BRAF inhibition improves tumor recognition by the immune system: Potential implications for combinatorial therapies against melanoma involving adoptive T-cell transfer. Oncoimmunology. 2012;1(9):1476–83. doi:10.4161/onci.21940. PMID:23264894.
- Wilmott JS, Long GV, Howle JR, Haydu LE, Sharma RN, Thompson JF, Kefford RF, Hersey P, Scolyer RA. Selective BRAF inhibitors induce marked T-cell infiltration into human metastatic melanoma. Clin Cancer Res. 2012;18(5):1386–94. doi:10.1158/1078-0432.CCR-11-2479. PMID:22156613.
- Sabbatino F, Wang Y, Scognamiglio G, Favoino E, Feldman SA, Villani V, et al. Antitumor activity of BRAF inhibitor and IFNalpha combination in BRAF-mutant Melanoma. J Natl Cancer Institute. 2016;108(7). doi:10.1093/jnci/djv435. PMID:26851802.
- Boni A, Cogdill AP, Dang P, Udayakumar D, Njauw CN, Sloss CM, Ferrone CR, Flaherty KT, Lawrence DP, Fisher DE, et al. Selective BRAFV600E inhibition enhances T-cell recognition of melanoma without affecting lymphocyte function. Cancer Res. 2010;70(13):5213–9. doi:10.1158/0008-5472.CAN-10-0118. PMID:20551059.
- Cooper ZA, Juneja VR, Sage PT, Frederick DT, Piris A, Mitra D, Lo JA, Hodi FS, Freeman GJ, Bosenberg MW, et al. Response to BRAF inhibition in melanoma is enhanced when combined with immune checkpoint blockade. Cancer Immunol Res. 2014;2(7):643–54. doi:10.1158/2326-6066.CIR-13-0215. PMID:24903021.
- Kakavand H, Wilmott JS, Menzies AM, Vilain R, Haydu LE, Yearley JH, Thompson JF, Kefford RF, Hersey P, Long GV, et al. PD-L1 Expression and tumor-infiltrating lymphocytes define different subsets of MAPK inhibitor-treated melanoma patients. Clin Cancer Res. 2015;21(14):3140–8. doi:10.1158/1078-0432.CCR-14-2023. PMID:25609064.
- Knight DA, Ngiow SF, Li M, Parmenter T, Mok S, Cass A, Haynes NM, Kinross K, Yagita H, Koya RC, et al. Host immunity contributes to the anti-melanoma activity of BRAF inhibitors. J Clin Invest. 2013;123(3):1371–81. doi:10.1172/JCI66236. PMID:23454771.
- Koya RC, Mok S, Otte N, Blacketor KJ, Comin-Anduix B, Tumeh PC, Minasyan A, Graham NA, Graeber TG, Chodon T, et al. BRAF inhibitor vemurafenib improves the antitumor activity of adoptive cell immunotherapy. Cancer Res. 2012;72(16):3928–37. doi:10.1158/0008-5472.CAN-11-2837. PMID:22693252.
- Deken MA, Gadiot J, Jordanova ES, Lacroix R, van Gool M, Kroon P, Pineda C, Geukes Foppen MH, Scolyer R, Song JY, et al. Targeting the MAPK and PI3 K pathways in combination with PD1 blockade in melanoma. Oncoimmunology. 2016;5(12):e1238557. doi:10.1080/2162402X.2016.1238557. PMID:28123875.
- Hugo W, Shi H, Sun L, Piva M, Song C, Kong X, Moriceau G, Hong A, Dahlman KB, Johnson DB, et al. Non-genomic and Immune Evolution of Melanoma Acquiring MAPKi Resistance. Cell. 2015;162(6):1271–85. doi:10.1016/j.cell.2015.07.061. PMID:26359985.
- Haferkamp S, Borst A, Adam C, Becker TM, Motschenbacher S, Windhovel S, et al. Vemurafenib induces senescence features in melanoma cells. The J Invest Dermatol. 2013;133(6):1601–9. doi:10.1038/jid.2013.6. PMID:23321925.
- Schrors B, Lubcke S, Lennerz V, Fatho M, Bicker A, Wolfel C, Derigs P, Hankeln T, Schadendorf D, Paschen A, et al. HLA class I loss in metachronous metastases prevents continuous T cell recognition of mutated neoantigens in a human melanoma model. Oncotarget. 2017;8(17):28312–27. doi:10.18632/oncotarget.16048. PMID:28423700.
- Yarchoan M, Johnson BA, Lutz ER 3rd, Laheru DA, Jaffee EM. Targeting neoantigens to augment antitumour immunity. Nat Rev Cancer. 2017;17(4):209–22. doi:10.1038/nrc.2016.154. PMID:28233802.
- Keller M, Ebstein F, Burger E, Textoris-Taube K, Gorny X, Urban S, Zhao F, Dannenberg T, Sucker A, Keller C, et al. The proteasome immunosubunits, PA28 and ER-aminopeptidase 1 protect melanoma cells from efficient MART-126-35 -specific T-cell recognition. Eur J Immunol. 2015;45(12):3257–68. doi:10.1002/eji.201445243. PMID:26399368.
- Song C, Piva M, Sun L, Hong A, Moriceau G, Kong X, Zhang H, Lomeli S, Qian J, Yu CC, et al. Recurrent tumor cell-intrinsic and -extrinsic alterations during MAPKi-induced melanoma regression and early adaptation. Cancer Discov. 2017;7(11):1248–65. doi:10.1158/2159-8290.CD-17-0401. PMID:28864476.
- Liu C, Peng W, Xu C, Lou Y, Zhang M, Wargo JA, Chen JQ, Li HS, Watowich SS, Yang Y, et al. BRAF inhibition increases tumor infiltration by T cells and enhances the antitumor activity of adoptive immunotherapy in mice. Clin Cancer Res. 2013;19(2):393–403. doi:10.1158/1078-0432.CCR-12-1626. PMID:23204132.
- Hu-Lieskovan S, Mok S, Homet Moreno B, Tsoi J, Robert L, Goedert L, Pinheiro EM, Koya RC, Graeber TG, Comin-Anduix B, et al. Improved antitumor activity of immunotherapy with BRAF and MEK inhibitors in BRAF(V600E) melanoma. Sci Translational Med. 2015;7(279):279ra41. doi:10.1126/scitranslmed.aaa4691. PMID:25787767.
- Deniger DC, Kwong ML, Pasetto A, Dudley ME, Wunderlich JR, Langhan MM, Lee CR, Rosenberg SA. A pilot trial of the combination of vemurafenib with adoptive cell therapy in patients with metastatic melanoma. Clin Cancer Res. 2017;23(2):351–62. doi:10.1158/1078-0432.CCR-16-0906. PMID:28093487.
- Ackerman A, Klein O, McDermott DF, Wang W, Ibrahim N, Lawrence DP, Gunturi A, Flaherty KT, Hodi FS, Kefford R, et al. Outcomes of patients with metastatic melanoma treated with immunotherapy prior to or after BRAF inhibitors. Cancer. 2014;120(11):1695–701. doi:10.1002/cncr.28620. PMID:24577748.
- Ebstein F, Lange N, Urban S, Seifert U, Kruger E, Kloetzel PM. Maturation of human dendritic cells is accompanied by functional remodelling of the ubiquitin-proteasome system. Int J Biochem Cell Biol. 2009;41(5):1205–15. doi:10.1016/j.biocel.2008.10.023. PMID:19028597.
- Dimri GP, Lee X, Basile G, Acosta M, Scott G, Roskelley C, Medrano EE, Linskens M, Rubelj I, Pereira-Smith O, et al. A biomarker that identifies senescent human cells in culture and in aging skin in vivo. Proc Natl Acad Sci U S A. 1995;92(20):9363–7. doi:10.1073/pnas.92.20.9363. PMID:7568133.