
Abstract
Background: The adenosine A2a receptor (A2aR) and the adenosine synthesizing enzyme CD73 have recently evolved as a novel immunotherapeutic target. However, little is known about epigenetic modification of the encoding genes ADORA2A and NT5E.
Methods: In the present study, we evaluated methylation at 23 loci of ADORA2A and 17 loci of NT5E with regard to transcriptional activity, human papilloma virus (HPV) status, immune cell infiltration, and outcome in a cohort of 279 head and neck squamous carcinoma (HNSCC) patients obtained from The Cancer Genome Atlas (TCGA). Methylation and mRNA expression were generated by the Infinium HumanMethylation450 BeadChip and Illumina HiSeq 2000 RNA Sequencing Version 2 analysis (Illumina, Inc., San Diego, CA, USA). HPV status was assessed by RNA-Seq data analysis of the viral genes E6 and E7.
Results: Thirteen out of 23 ADORA2A loci and 15/17 NT5E loci were significantly correlated with mRNA levels (p < 0.05). Inverse correlations were predominately found in promoter regions, while positive correlations were more profound at intragenic loci. ADORA2A hypermethylation was significantly associated with poor overall survival (OS, p ≤ 0.030), whereas NT5E hypomethylation was associated with decreased OS in HPV-positive tumors (p ≤ 0.024) and increased OS in HPV-negative HNSCC (p ≤ 0.029). Further, we found significant correlations between methylation and immune cell infiltrates.
Conclusion: Our data might point towards a significant role of the A2aR/CD73 axis during cancer progression in HNSCC.
Introduction
In 2018, the annual incidence of head and neck squamous cell carcinoma (HNSCC) accounted for approximately 64,690 cases and more than 13,500 deaths in the United States.Citation1 Alcohol consumption and extensive tobacco abuse are known major risk factors, while a subset of oropharyngeal HNSCC is driven by the persistence of high-risk human papilloma virus (HPV).Citation2 HPV-positive patients tend to be younger than individuals with conventional HNSCC and have an exceptional prognosis.Citation3 In order to reduce long-term therapy-induced toxicities in HPV-positive patients, treatment strategies have been adjusted to lower doses in radiotherapy and less toxic chemotherapeutics. Due to increasing knowledge on the pathological background of HNSCC and the consolidated finding that HNSCC is an outstanding immune-responsive disease, more specific treatment attempts, including immunotherapeutic strategies, have been proposed for patients with advanced disease.Citation4 Programmed cell death 1 (PD-1) / PD-1 ligand 1 (PD-L1) targeted immune checkpoint inhibition, as a result, has gained regulatory approval as an additional treatment option in the setting of metastatic and recurrent HNSCC.Citation5-Citation8
Very recently, Ma et al. have reported on the expression of the immune-checkpoint adenosine A2a receptor (A2aR) in HNSCC.Citation9 It is well known that the extracellular tumor microenvironment holds high amounts of adenosine caused by a phenomenon called the “Warburg effect”, an inefficient process of generating adenosine triphosphate (ATP) in cancer epithelium.Citation10 In addition, necrotic tumor cells spill over ATP that is further catabolized by the nucleoside triphosphate dephosphorylase CD39 (NTPD)Citation11 resulting in a relative excess of adenosine monophosphate (AMP). AMP is further converted to adenosine by a surface ecto-5′-nucleotidase called CD73 (encoded by NT5E). High levels of adenosine support tumor cell growth and stimulate inhibitory tumor-associated fibroblasts. Via a direct effect on tumor infiltrating lymphocytes, adenosine unleashes the power of an inhibitory immune checkpoint. Thereby, the stimulation of the A2aR on adaptive regulatory T cells (Tregs) is known to cause peripheral T cell depletion conveying immune tolerance.Citation12,Citation13 Ma et al. detected high levels of A2aR expression in recurrent HNSCC and HNSCC tissues collected after induction chemotherapy.Citation9 In their study, A2aR expression was associated with hypoxia, high numbers of tumor infiltrating CD8+ lymphocytes, and Tregs. The authors further demonstrated that pharmacological blockade of A2aR by its antagonist SCH-58261 reduced tumor growth, diminished the population of CD4+FOXP3+ Tregs, and enhanced the anti-tumor response of CD8+ T cells in a mouse model for HNSCC. These results align with the research of Mediavilla-Varela et al. who showed similar effects for the blockade of A2aR in non-small cell lung cancer (NSCLC) and its cancer associated fibroblasts.Citation14
In addendum to the study by Ma et al., the aim of the present study was to investigate ADORA2A and NT5E DNA methylation in HNSCC with regard to gene transcription, HPV-status, and survival. An epigenetic regulation of these genes might be exploited for the development of predictive biomarkers to identify patients potentially benefitting from a treatment with A2aR antagonists.
Results
ADORA2A and NT5E methylation and expression in isolated immune cells and cell lines
In order to support the hypothesis of an epigenetic regulation of ADORA2A and NT5E () via DNA methylation, we analyzed HNSCC cell lines and purified lymphocytes from healthy donors. We found significant methylation and mRNA differences in purified cell subsets (Supplemental Tables 1 and 2, and ). A2aR mRNA expression significantly correlated with methylation in CD4+ T cells at 20 of 23 analyzed loci (). A strong inverse correlation was found at transcription start sites () targeted by bead 3 and 4 and in a region upstream and in close proximity to an alternative A2aR transcript (bead 16). All other significantly correlating loci showed positive correlations between mRNA expression and methylation. A significant inverse correlation at the locus targeted by bead 16 was also found in CD8+ T cells, while the region of the transcription start sites showed only a trend towards higher mRNA expression in cells with lower methylation (bead 3, p = 0.066). Significant positive correlations were found at 9 out of 23 analyzed loci within the CD8+ T cell fraction. In monocytes, only one locus (targeted by bead 22) showed a significant correlation between methylation and mRNA expression.
Figure 1. Genomic Organization of ADORA2A and NT5E. Shown are regulatory elements, CG-density, transcripts, transcription start sites (TSSs) and locations of beads (numbered consecutively according to their position) within the ADORA2A (A) and NT5E (B) gene locus. The modified illustration was exported from www.ensemble.org (Version 89.38) and is based on Genome Reference Consortium Human Build 38 patch release 10 (GRCh38.p10).
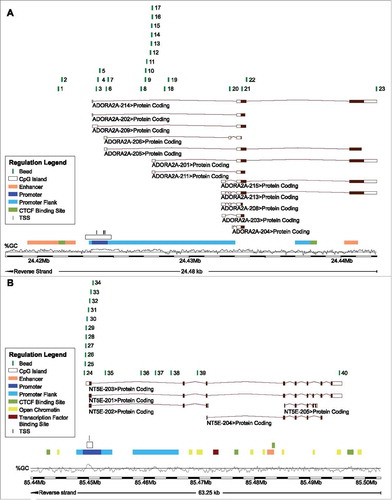
Figure 2. ADORA2A methylation and A2aR mRNA expression in leucocyte subtypes. A) Mean methylation of CD8+ T, CD4+ T, Treg, B cells, and monocytes as well as HPV-positive and HPV-negative cell lines at different loci within ADORA2A targeted by beads from the Infinium HumanMethylation450 BeadChip. B) A2aR mRNA expression in monocytes, B, CD4+, and CD8+ T cells. Asteriks imply a significant difference between two groups (*: p°<°0.05, **: p°<°0.001). C-E) Exemplarily illustrated methylation levels at three different loci within ADORA2A in monocytes, CD8+ T, CD4+ T, Treg, B cells, and HPV-positive and HPV-negative cell lines. Mean values and 95% confidence intervals are given (depicted in red).
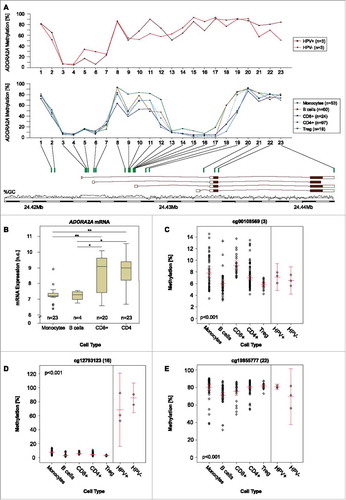
Figure 3. NT5E methylation and CD73 mRNA expression in leucocyte subtypes. A) Mean methylation of CD8+ T, CD4+ T, Treg, B cells, and monocytes as well as HPV-positive and HPV-negative cell lines at different loci within NT5E targeted by beads from the Infinium HumanMethylation450 BeadChip. B) A2aR mRNA expression in monocytes, B, CD4+, and CD8+ T cells. Asteriks imply a significant difference between two groups (*: p°<°0.05, **: p°<°0.001). C-D) Exemplarily illustrated methylation levels at two different loci within NT5E in monocytes, CD8+ T, CD4+ T, Treg, B cells, and HPV-positive and HPV-negative cell lines. Mean values and 95% confidence intervals are given (depicted in red).
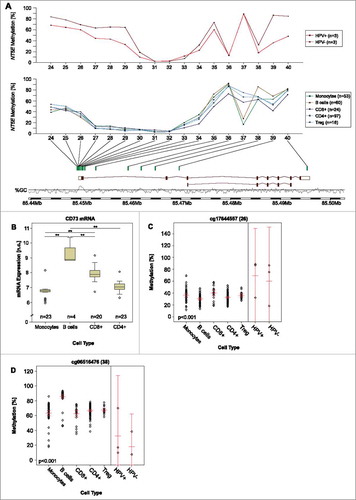
Table 1. Correlations of mRNA expression and methylation in peripheral lymphocytes. Shown are correlations between mRNA expression and DNA methylation at various loci within the ADORA2A and NT5E genes targeted by Infinium HumanMethylation450 BeadChip beads. Immune cell data were adopted by data sets GSE87650 and GSE71245.41,42 Significant features are shown in boldface.
The comprehensive methylation and expression analysis of NT5E in lymphocytes revealed significant positive correlations at 9 out of 17 analyzed loci in CD4+ T cells, 2/17 loci in CD8+ T cells, and 7 out of 17 loci in monocytes (). However, no significant inverse correlations were found.
The analyzed immune cells were obtained from healthy donors and might be different from peripheral leucocyte from HNSCC patients; however, the data shown here support the assumption of a regulatory mechanism of A2aR expression via DNA methylation in the CD4+ and CD8+ T cells under investigation.
Furthermore, we found a significant inverse correlation between ADORA2A methylation and the donors' age in monocytes at seven loci (at beads 2, 9, 10, 11, 12, 18, and 19, Supplemental Table 3). In CD4+ T cells, a significant negative correlation between age and methylation was detected at three of these same loci (beads 9, 11 and 19). An inverse correlation between ADORA2A mRNA expression and donors' age was found in CD8+ T cells at the locus of bead 1 and a positive correlation at bead 16. Regarding the methylation of NT5E and donors' age significant inverse correlations were found in CD4+ T cells (beads 12 and 15) and in monocytes (bead 13).
A2aR and CD73 mRNA expression according to HPV-status in HNSCC
For clinicopathological characteristics of HPV-positive and -negative patients included in the study see . Detailed analysis of A2aR mRNA in the patient cohort under investigation firstly revealed A2aR mRNA levels to be higher in HPV-positive patients compared to HPV-negative individuals (176.2 ± 117.5 n.c. for HPV-positive, 99.9 ± 82.3 n.c. for HPV-negative, p < 0.001; ).
Table 2. Clinicopathological characteristics of HNSCC patients included in the study (n = 279). Shown are normalized counts of A2aR and CD73 mRNA. Significant features are shown in boldface.
In HPV-positive patients, a significant difference in A2aR mRNA expression was detected with regard to the tumor location. Oropharyngeal and laryngeal tumors showed the highest normalized counts (213.8 n.c. and 303.5 n.c., respectively, p = 0.028, ). In HPV-negative patients, normalized A2aR mRNA expression was shown to differ significantly between normal adjacent tissue (NAT) and HNSCC (59.8 ± 26.7 n.c. for NAT; 99.9 ± 82.3 n.c. for HNSCC; p = 0.020, respectively; ). Analogously, normalized CD73 mRNA expression was higher in the HPV-negative cohort compared to the HPV-positive subgroup (494.6 ± 718.0 n.c. for HPV-positive, 1495.8 ± 1604.1 n.c. for HPV-negative, p < 0.001; ). Furthermore, CD73 mRNA normalized counts significantly differed between normal adjacent and carcinomatous tissues in HPV-negative patients (438.6 ± 441.2 n.c. for NAT; 1495.8 ± 1604.1 n.c. for HNSCC; p < 0.001; ). Additionally, differences between CD73 mRNA levels, depending on the tumor site, were seen in both subgroups (p = 0.004 in HPV-positive and p < 0.001 in HPV-negative patients, ). Of note, higher A2aR mRNA normalized counts were observed in HPV-positive tumors, while increased CD73 mRNA levels were detected in HPV-negative patients (detailed data in ).
Table 3. Detailed analysis of ADORA2A methylation and A2aR mRNA in HPV-positive and HPV-negative patients. Shown are differences between normal adjacent tissue (NAT) and tumor tissue and correlations between methylation and mRNA expression in tumor tissues by single Infinium HumanMethylation450 BeadChip bead resolution. Methylation data for NAT were available for 50 patients (six belonging to the HPV-positive cohort), while mRNA expression data for NAT were assessable for 20 individuals (two belonging to the HPV-positive cohort).Significant features are shown in boldface.
Table 4. Detailed analysis of NT5E methylation and CD73 mRNA in HPV-positive and HPV-negative patients. Shown are differences between normal adjacent tissue (NAT) and tumor tissue and correlations between methylation and mRNA expression in tumor tissues by single Infinium HumanMethylation450 BeadChip bead resolution. Methylation data for NAT were available for 50 patients (six belonging to the HPV-positive cohort), while mRNA expression data for NAT were assessable for 20 individuals (two belonging to the HPV-positive cohort). Significant features are shown in boldface.
ADORA2A and NT5E methylation according to HPV-status in HNSCC
The Infinium HumanMethylation450 BeadChip beads targeting the ADORA2A and NT5E gene loci were analyzed to identify a differential methylation between NAT and carcinomatous tissue. Within the ADORA2A gene, all analyzed loci with a significant methylation difference between NAT and HNSCC in HPV-positive patients also differed in NAT vs. tumor in HPV-negative HNSCC ( and ). A similar observation was made for the analyzed loci within NT5E with the exception of the regions targeted by beads 30 and 40 ( and ).
Figure 4. Results for individual BeadChip beads of ADORA2A and NT5E. Results of a detailed analysis of methylation for the genes ADORA2A (A and B) and NT5E (C and D) at single bead resolution with regard to the HPV-status are pictographically displayed (methylation differences between normal adjacent tissue (NAT) and tumor tissue, correlations between mRNA expression and methylation, and association with survival are shown, for exact values see –). Significant results are depicted in red. The beads are numbered according to .
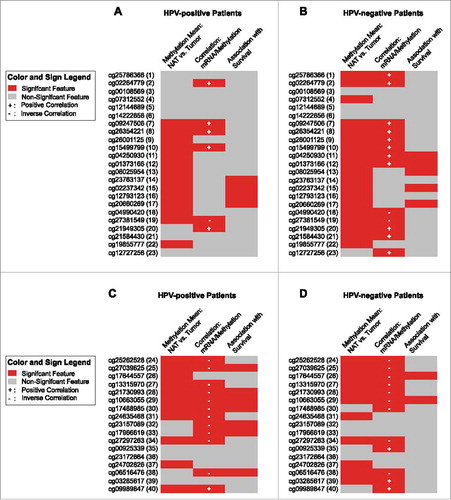
For correlation of ADORA2A methylation with A2aR mRNA, CD73 mRNA expression levels and NT5E methylation see and or . In brief, an inverse correlation was observed for methylation assessed by the majority of NT5E targeting beads. In contrast, methylation as assessed by ADORA2A targeting beads showed a positive correlation with A2aR expression, only sites targeted by the beads 18 and 19 presented with inverse correlations.
Survival analyses of patients stratified by A2aR mRNA, CD73 mRNA, ADORA2A methylation, and NT5E methylation
In order to identify molecular targets potentially relevant for HPV-driven carcinogenesis, A2aR and CD73 mRNA expression and beads targeting ADORA2A and NT5E gene loci were analyzed separately according to patients' HPV status.
In HPV-positive HNSCC, low A2aR mRNA levels were associated with an adverse outcome ( and ). Additionally, low methylation levels assessed by four ADORA2A targeting beads (beads 14 to 17) were associated with a longer OS in Kaplan-Meier analyses (p = 0.006, p = 0.006, p = 0.005, p = 0.006, respectively; and a likelihood ratio (LHR) = 13.41 for each bead, ).
Figure 5. Association of ADORA2A methylation and A2aR mRNA expression with survival. Kaplan-Meier survival analyses of patients with HPV-positive (A) and –negative (B) tumors stratified according to A2aR mRNA expression and ADORA2A methylation determined at various sites within the gene. Median methylation and mRNA expression was used as cut-off for classifying tumors as hypo- and hypermethylated, or high and low expressing, respectively. Shown are only significant results.
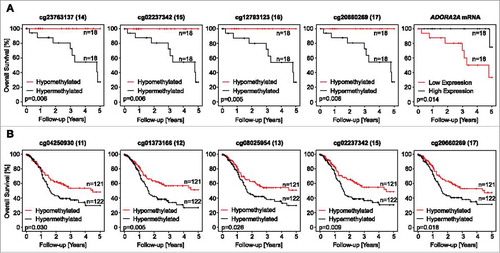
Table 5. Kaplan-Meier analysis of ADORA2A methylation, A2aR mRNA, NT5E methylation, and CD73 mRNA in HPV-positive and HPV-negative patients. Subcohorts are dichotomized by their median. Thus, in the HPV-positive cohort subgroups (“hypomethylated” and “hypermethylated”) consist of 18 patients each, while in the HPV-negative cohort hypomethylated and hypermethylated subgroups consist of 121 and 122 individuals, respectively. Significant features are shown in boldface.
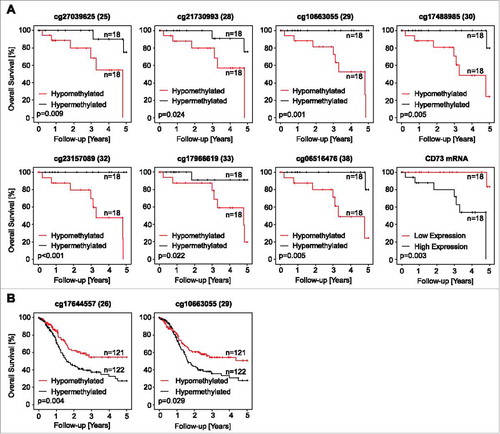
In the HPV-positive subgroup, low NT5E methylation and high CD73 mRNA levels were associated with an adverse outcome in HNSCC patients ( and ). In the subgroup of HPV-negative HNSCC, defined by E6 and E7 RNA-Seq data,Citation15 no prognostic impact could be shown for A2aR or CD73 mRNA expression. In contrast, methylation assessed by two NT5E targeting beads (beads 26 and 29, and ) and five ADORA2A targeting beads (beads 11, 12, 13, 15, and 17; ) revealed prognostic impact for HPV-negative patients in Kaplan-Meier analyses.
Figure 6. Association of NT5E methylation and CD73 mRNA expression with survival. Kaplan-Meier survival analyses of patients with HPV-positive (A) and –negative (B) tumors stratified according to CD73 mRNA expression and NT5E methylation determined at various sites within the gene. Median methylation and mRNA expression was used as cut-off for classifying tumors as hypo- and hyper methylated, or high and low expressing, respectively. Shown are only significant results.
Correlation of A2aR and CD73 mRNA and T cell activation markers
Significant correlations between mRNA expression of genes induced during T cell activation and A2aR mRNA expression could be shown in HPV-positive and HPV-negative subgroups, while only single markers were associated with CD73 mRNA expression ().
Table 6. Correlation of A2aR mRNA and CD73 mRNA with T cell activation markers. Spearman‘s rank between A2aR mRNA and CD73 mRNA expression with mRNA expression of genes that are commonly induced during T cell activation. Significant features are shown in boldface.
Correlation of A2aR mRNA, CD73 mRNA, ADORA2A methylation, and NT5E methylation with lymphocyte infiltrates
Since the expression of A2aR and CD73 is closely related to the adaptive immune cell activity, methylation and mRNA levels were quantified with respect to immune cell densities (B cells, CD4+ T cells, CD8+ B cells, dendritic cells, and regulatory T cells, adopted from Li et al.Citation16) (see Supplemental Tables 4 and 5 for detailed analysis).
Discussion
Epigenetic alterations seem to be involved in key biological processes, especially in the lymphocyte compartment.Citation17-Citation20 De novo methylation further appears to contribute to T cell exhaustion.Citation18 Additionally, methylation of distinct genes might add information about the prognosis of various malignancies.Citation21-Citation24 In the present study, differential ADORA2A and NT5E DNA methylation revealed an impact on the course of HNSCC. While A2aR and CD73 mRNA expression only served as a prognostic factor in HPV-positive subgroup analysis, methylation of ADORA2A and NT5E, determined by various Illumina 450 k beads, performed well as prognostic biomarkers in both subgroups. These findings are in line with the observation that HPV consistently alters the cancer cells' epigenome, thereby affecting the host's immunologic tolerance to tumor cells.Citation25
Our data concur with recent observations by Ma et al., who reported a correlation between A2aR and FOXP3 expression in human HNSCC tissue, indicating that A2aR may be expressed in Tregs.Citation9 Furthermore, we found a strong correlation of A2aR mRNA expression with increased levels of genes known to be induced during T cell activation (granzymes, perforin, PD-1, CD69, interferon gamma, and interleukin 2 receptor subunit alpha) suggesting a role of A2aR in T cell activation. In our study, A2aR mRNA positively correlated with CD4+ and CD8+ T cells, B cells, Tregs, and dendritic cells, whereas Ma et al. observed an inverse correlation with CD8+ T cells in their experimental setup.Citation9 However, due to post-transcriptional modification, mRNA expression, as analyzed in the present study, does not necessarily parallel protein expression in every single aspect. Of note, Ma et al. claimed that high A2aR expression could be detected in HNSCC tissues undergoing induction chemotherapy. The authors hypothesized that A2aR may facilitate drug resistance by altering the immunological tumor microenvironment. Their findings thus strongly emphasize the potential clinical relevance of the current study.
Since HPV persistence is known as a major prognostic factor in HNSCC, HPV-positive and HPV-negative subgroups were analyzed separately in the present study. As reported in earlier studies, HPV interferes with the tumor epigenome, leading to promoter methylation of various genes, especially immune related genes.Citation26 HPV, as a result, induces a tolerant microenvironment allowing tumor prosperity.Citation25 In HPV-positive HNSCC, high ADORA2A methylation and low NT5E methylation, respectively, were associated with shorter OS. The latter may imply that the outcome of patients with HPV-positive HNSCC is linked to the activation status of immune checkpoint pathways, e.g. the adenosine signaling pathway. The detailed functional analysis of the dysregulation of adenosine signaling with special emphasis on HPV-driven tumors, however, is beyond the scope of this study and warrants further mechanistic approaches in future studies.
Remarkably, our data suggest a higher level of immune checkpoint activation in HPV-positive tumors which would therefore be expected to be associated with a worse survival compared to patients with HPV-negative tumors. This is in sharp contrast to the fact that patients with HPV-positive tumors have a significant better prognosis compared to patients with HPV-negative tumors. However, the prognosis of a malignant disease is not only determined by a single factor. HPV-positivity is associated with a HPV-specific CpG Island Methylator (CIMP) phenotype,Citation27 indicating that a multitude of other genes apart from immune checkpoint genes are deregulated. Furthermore, HPV-negative tumors specifically and frequently harbor distinct molecular features, i.e. EGFR, TP53 (p53), FGFR1, HRAS, CCND1, and MYC genomic alterations,Citation15,Citation28 some of which are associated with an adverse course of the disease.Citation29,Citation30 Accordingly, the prognosis of a HNSCC patient cannot be traced back to a single factor but a single factor might be suited as a surrogate parameter reflecting a molecular subtype with an overall better prognosis.
We found a reduced ADORA2A methylation of CD4+ T cells and monocytes in donors of older age. DNA methylation alterations as an effect of age is well described and referred to as ‘epigenetic drift'.For rev.Citation31,Citation32 “Immunosenescence”, aging of the immune system, is associated with chronic inflammation, defective humoral immunity, a shift from a TH1 to a TH2 cytokine profile, and increased differentiation rate of naive to memory T cells. Aging and immunosenescence are accompanied by decreased global DNA methylation and gene specific hypermethylation. Significant age-associated methylation changes have been reported for purified peripheral blood leucocytes, i.e. CD4+ T cells and CD14+ monocytes.Citation33,Citation34 Such age-associated methylation changes frequently affect genes involved in immune processes which are predominantly demethylated with increasing age.Citation35-Citation37
We are aware of two major limitations of the present study: the lack of an independent validation study and cell type-specific methylation and expression analyses. As the analysis of multiple features (beads) is generally prone to multiple testing issues, results would consequently either need to be corrected for multiple testing or validated in an independent cohort. In the present study, we aimed at reducing the risk of multiple testing artifacts by reporting the results for all beads analyzed without any selection. Further, we used median methylation and expression for dichotomization in Kaplan-Meier analyses.
Mainly, tumors represent a heterogeneous mixture of various cell types, including tumor cells, infiltrating immune cells, and tumor-associated stroma. DNA methylation patterns are well recognized tissue- and cell type-specific features associated with cell type-specific gene expression patterns. Consequently, an association between DNA methylation and gene (mRNA) expression can hardly be studied using sample material comprised of a heterogeneous mixture of cells, each showing its specific methylation and gene expression pattern. In order to address this issue, we have analyzed isolated peripheral leucocytes from healthy patients and found a significant inverse correlation between mRNA expression and methylation in CD8+ and CD4+ T cells in the region of a transcription start site pointing towards an epigenetic regulation of ADORA2A in these cells. However, peripheral CD8+ and CD4+ T cells from healthy donors are likely to be different from tumor infiltrating CD8+ and CD4+ T cells. Accordingly, additional studies to comprehensively analyze the association of methylation and mRNA expression levels of purified cells from tumor tissue (tumor cells, tumor-associated stroma, infiltrating CD4+ T, CD8+ T, Treg, and B cells as well as monocytes) are required. The correlative analyses presented in our study should therefore be interpreted with caution and neither allow for the assumption nor the ruling out of a direct epigenetic regulation in cells present in a tumor without additional experimental support. Furthermore, the correlations between methylation and mRNA expression with levels of tumor infiltration lymphocytes reported in our study are based on quantified immune cell infiltrates adopted from Li et al.Citation16 Li and co-workers used mRNA expression signatures to asses immune cell infiltrates. The overall validity of this approach needs to be proven in additional studies. Moreover, additional studies with larger patient cohorts are needed to further investigate differences between distinct HNSCC subgroups, e.g. HPV-associated non-oropharyngeal and oropharyngeal carcinomas.
New therapeutic approaches using A2aR and CD73 inhibition have been focusing on patients with non-small cell lung cancer (NSCLC). At present, the oral antagonistic small molecule drugs CPI-444 (Corvus Pharmaceuticals, Inc. in cooperation with Genentech, Inc.) and PBF-509 (Palobiofarma SL in cooperation with Novartis), AZD4635 (HTL-1071, HTL1071, AstraZeneca) are being investigated in clinical trials including NSCLC, malignant melanoma, renal cell cancer, triple-negative breast cancer, colorectal cancer, bladder cancer, and metastatic castration resistant prostate cancer (ClinicalTrials.gov Identifiers: NCT02655822, NCT02403193, NTC03381274, NTC02740985). Efficacy of CPI-444 has been reported in 50% and 86% of patients with NSCLC and renal cell carcinoma, respectively.Citation38 Furthermore, antagonistic monoclonal antibodies targeting CD73, including BMS-986179 (Bristol-Myers Squibb), MEDI9447 (MedImmune LCC), and IPH53 (Innate Pharma), are being developed and tested in various advanced tumors, including relapsed ovarian cancers and NSCLC (NCT02754141, NCT02503774, NCT03381274, NCT03267589).Citation39 As reflected by the present findings, HNSCC may be a candidate for therapeutic evaluation as well and the potential of NT5E and ADORA2A methylation as predictive biomarker for response to anti-CD73 and/or anti-A2aR treatment should be tested.
Methods
Analysis of mRNA expression and methylation – cell lines and isolated immune cells
Methylation data from three HPV-positive (UPCI:SCC090, 93VU-147 T, UM:SCC047) and three HPV-negative HNSCC cell lines (UPCI:SCC003, UPCI:SCC036, and PCI-30) previously generated by Lechner et al. (Gene Expression Omnibus (GEO) accession number: GSE38271; National Center for Biotechnology Information, Bethesda, MD, USA) were included.Citation40 Methylation data from isolated immune cells (n = 97 CD4+ T, n = 24 CD8+ T, n = 18 Treg, n = 60 B cells, and n = 53 monocytes) were obtained from three previous studies which included 26 healthy controls from Scotland (GSE87650),Citation41 six healthy Israeli women (GSE71245),Citation42 and 72 healthy American volunteers (GSE59250).Citation43 Matched mRNA expression data from the same samples were available from n = 23 CD4+, n = 20 CD8+, n = 4 B cells, and n = 23 monocytes. Methylation was assessed using the InfiniumHumanMethylation450 BeadChip and mRNA expression levels were generated by means of HumanHT-12 V4.0 Gene Expression BeadChip (both Illumina, Inc., San Diego, CA, USA). Raw data was downloaded from the GEO webpage. Methylation values for each bead pair comprised a variant specific for the methylated and the unmethylated status and were calculated by the formula 100% x bead_M / (bead_M + bead_U).
Patient cohort and clinical endpoints
The results reported here are partly based on data generated by The Cancer Genome Atlas Research Network (TCGA, http://cancergenome.nih.gov/). The TCGA cohort comprised 528 patients with histologically confirmed HNSCC collected from centers participating in the TCGA project. Due to the increasing importance of the HPV-status for the treatment of HNSCC, our study only included data on a subgroup of 279 patients adopted from Lawrence et al.Citation15 For this cohort, HPV-status was determined by RNA-Seq data of the viral genes E6 and E7, thus categorizing 36 patients as HPV-positive and 243 as HPV-negative. Clincopathological data were obtained by the TCGA Network. Clinical follow-up was assessable in all individuals (mean follow-up period 2.16 years, range 0–17.6 years). Informed consent was obtained by the TCGA Research Network from all patients in accordance with the Helsinki Declaration of 1975. Primary clinical endpoint of the study was death and time-to-death. Overall survival (OS) was defined as time between surgery and death or last contact.
Analysis of mRNA expression and methylation – HNSCC cohort
Data of level 2 for methylation and mRNA expression (normalized counts, n.c.) were downloaded from the TCGA webpage. A2aR and CD73 mRNA expression data were available for 20 normal adjacent (NAT) and 279 cancer samples. For the analysis of A2aR mRNA, we used RNA SeqV2 (normalized counts) data provided by the TCGA Research Network. ADORA2A and NT5E promoter methylation were available for 279 HNSCC specimens and 50 normal tissues. Methylation data were generated by means of the Infinium HumanMethylation450 BeadChip. Relative methylation levels were calculated as described above.
Immune cell infiltrates
Quantitative data on infiltrating lymphocytes in the HNSCC samples from the TCGA cohort (B cells, dendritic cells, CD4+ and CD8+ T cells) were adopted from Li et al.Citation16 Data on FOXP3 mRNA expression from the TCGA cohort were used as a surrogate for the density of regulatory T cells.
Statistical analysis
Statistical analyses were performed using SPSS, version 23.0 (SPSS Inc., Chicago, IL, USA). According to the data distribution, correlations were calculated using Pearson's or Spearman's correlation (Pearson's r and Spearman's ρ, respectively). Data on mRNA expression was logarithmized to the base of 2 for correlation analyses. Mean value comparisons were performed with the Student's t-test (equal variances not assumed), Wilcoxon-Mann-Whitney U and Kruskal-Wallis test depending on the number of compared groups and data-distribution. Survival analyses were performed using the Kaplan-Meier method, the log rank test, and likelihood ratios. All tested factors were dichotomized according to their median in the respective groups or subgroups. OS was censored at 5 years in order to exclude deaths which were unrelated to HNSCC.Citation27 P-values 0.05 were considered statistically significant.
List of Abbreviations
| 95%-CI | = | 95% confidence interval |
| ADORA2A | = | Adenosine A2a receptor (gene symbol) |
| A2aR | = | Adenosine A2a receptor |
| CCND1 | = | Cyclin D1 (gene symbol) |
| CD73 | = | Cluster of differentiation 73 |
| EGFR | = | Epidermal growth factor receptor (gene symbol) |
| FGFR1 | = | Fibroblast growth factor receptor 1 (gene symbol) |
| HNSCC | = | Head and neck squamous cell carcinoma |
| HPV | = | Human papilloma virus |
| HRAS | = | HRas proto-oncogene, GTPase (gene symbol) |
| LHR | = | Likelihood Ratio |
| MYC | = | MYC proto-oncogene, bHLH transcription factor (gene symbol) |
| NA | = | Not assessable |
| NAT | = | Normal adjacent tissue |
| n.c. | = | normalized counts |
| NT5E | = | ecto-5'-nucleotidase (gene symbol) |
| OS | = | Overall survival |
| PD-1 | = | Programmed cell death 1 |
| PD-L1 | = | Programmed cell death 1 ligand 1 |
| TCGA | = | The Cancer Genome Atlas |
| TP53 | = | Tumor protein p53 (gene symbol) |
| Tregs | = | regulatory T cells |
supp_data.zip
Download Zip (141 KB)Disclosure Statement
A patent application on ADORA2A methylation and other immune checkpoint genes as prognostic and predictive biomarker is pending (Inventor: Dimo Dietrich).
Additional information
Funding
References
- Siegel RL, Miller KD, Jemal A. Cancer Statistics, 2018. CA Cancer J Clin. 2018;67(1):7–30. doi:10.3322/caac.21387.
- Leemans CR, Braakhuis BJ, Brakenhoff RH. The molecular biology of head and neck cancer. Nat Rev Cancer. 2011;11(1):9–22. doi:10.1038/nrc2982. PMID:21160525
- Kumar B, Cordell KG, Lee JS, Prince ME, Tran HH, Wolf GT, Urba SG, Worden FP, Chepeha DB, Teknos TN, et al. Response to therapy and outcomes in oropharyngeal cancer are associated with biomarkers including human papillomavirus, epidermal growth factor receptor,gender, and smoking. Int J Radiat Oncol Biol Phys. 2007;69(2 Suppl):S109–11.
- Kofler B, Laban S, Busch CJ, Lörincz B, Knecht R. New treatment strategies for HPV-positive head and neck cancer. Eur Arch Otorhinolaryngol. 2014;271(7):1861–7. doi:10.1007/s00405-013-2603-0. PMID:23934317
- Ferris RL, Blumenschein G Jr, Fayette J, Guigay J, Colevas AD, Licitra L, Harrington K, Kasper S, Vokes EE, Even C, et al. Nivolumab for Recurrent Squamous-Cell Carcinoma of the Head and Neck. N Eng J Med. 2016;375(19):1856–67. doi:10.1056/NEJMoa1602252.
- Chow LQ, Haddad R, Gupta S, Mahipal A, Mehra R, Tahara M, Berger R, Eder JP, Burtness B, Lee SH, et al. Antitumor Activity of Pembrolizumab in Biomarker-Unselected Patients with Recurrent and/or Metastatic Head and Neck Squamous Cell Carcinoma: Results From the Phase Ib KEYNOTE-012 Expansion Cohort. J Clin Oncol. 2016;34(32):3838–45. doi:10.1200/JCO.2016.68.1478.
- Seiwert TY, Burtness B, Mehra R, Weiss J, Berger R, Eder JP, Heath K, McClanahan T, Lunceford J, Gause C, et al. Safety and clinical activity of pembrolizumab for treatment of recurrent or metastatic squamous cell carcinoma of the head and neck (KEYNOTE-012): an open-label, multicentre, phase 1b trial. Lancet Oncol. 2016;17(7):956–65. doi:10.1016/S1470-2045(16)30066-3. PMID:27247226.
- United States Food and Drug Administration. pembrolizumab (KEYTRUDA). Silver Spring (MD): U.S. Food and Drug Administration; 2016 Aug 09 [accessed 2018 Feb 02]. https://www.fda.gov/drugs/informationondrugs/approveddrugs/ucm515627.htm
- Ma SR, Deng WW, Liu JF, Mao L, Yu GT, Bu LL, Kulkarni AB, Zhang WF, Sun ZJ. Blockade of adenosine A2A receptor enhances CD8+ T cells response and decreases regulatory T cells in head and neck squamous cell carcinoma. Mol Cancer. 2017;16(1):99. doi:10.1186/s12943-017-0665-0. PMID:28592285.
- Antonia SJ, Vansteenkiste JF, Moon E. Immunotherapy: Beyond Anti-PD-1 and Anti-PD-L1 Therapies. Am Soc Clin Oncol Educ Book.2016;35:e450–8.
- Kumar V. Adenosine as an endogenous immunoregulator in cancer pathogenesis: where to go? Purinergic Signal. 2013;9(2):145–65. doi:10.1007/s11302-012-9349-9. PMID:23271562.
- Zarek PE, Huang CT, Lutz ER, Kowalski J, Horton MR, Linden J, Drake CG, Powell JD. A2A receptor signaling promotes peripheral tolerance by inducing T-cell anergy and the generation of adaptive regulatory T-cells. Blood. 2008;111(1):251–9. doi:10.1182/blood-2007-03-081646. PMID:17909080.
- Ohta A, Gorelik E, Prasad SJ, Ronchese F, Lukashev D, Wong MK, Huang X, Caldwell S, Liu K, Smith P, et al. A2A adenosine receptor protects tumors from antitumor T-cells. Proc Natl Acad Sci U S A. 2006;103(35):13132–7. doi:10.1073/pnas.0605251103.
- Mediavilla-Varela M, Luddy K, Noyes D, Khalil FK, Neuger AM, Soliman H, Antonia SJ. Antagonism of adenosine A2A receptor expressed by lung adenocarcinoma tumor cells and cancer associated fibroblasts inhibits their growth. Cancer Biol Ther. 2013;14(9):860–8. doi:10.4161/cbt.25643.
- Lawrence MS, Sougnez C, Lichtenstein L, Cibulskis K, Lander E, Gabriel SB, Getz G, Ally A, Balasundaram M, Birol I, et al. Comprehensive genomic characterization of head and neck squamous cell carcinomas. Nature. 2015;517(7536):576–82. doi:10.1038/nature14129. PMID:25631445.
- Li B, Severson E, Pignon JC, Zhao H, Li T, Novak J, Jiang P, Shen H, Aster JC, Rodig S, et al. Comprehensive analyses of tumor immunity: implications for cancer immunotherapy. Genome Biol. 2016;17(1):174. doi:10.1186/s13059-016-1028-7. PMID:27549193.
- Ikawa T, Masuda K, Endo TA, Endo M, Isono K, Koseki Y, Nakagawa R, Kometani K, Takano J, Agata Y, et. al. Conversion of T cells to B cells by inactivation of polycomb-mediated epigenetic suppression of the B-lineage program. Genes Dev. 2016;30(22):2475–85. doi:10.1101/gad.290593.116. PMID:27913604.
- Ghoneim HE, Fan Y, Moustaki A, Abdelsamed HA, Dash P, Dogra P, Carter R, Awad W, Neale G, Thomas PG, et al. De Novo Epigenetic Programs Inhibit PD-1 Blockade-Mediated T Cell Rejuvenation. Cell. 2017;170(1):142–57. doi:10.1016/j.cell.2017.06.007. PMID:28648661.
- McPherson RC, Konkel JE, Prendergast CT, Thomson JP, Ottaviano R, Leech MD, Kay O, Zandee Se, Sweenie CH, Wraith DC, et. al. Epigenetic modification of the PD-1 (Pdcd1) promoter in effector CD4(+) T cells tolerized by peptide immunotherapy. Elife. 2014;3. doi:10.7554/eLife.03416.
- Youngblood B, Oestreich KJ, Ha SJ, Duraiswamy J, Akondy RS, West EE, Wei Z, Lu P, Austin JW, Riley JL, et. al. Chronic virus infection enforces demethylation of the locus that encodes PD-1 in antigen-specific CD8(+) T cells. Immunity. 2011;35(3):400–12. doi:10.1016/j.immuni.2011.06.015. PMID:21943489.
- Goltz D, Gevensleben H, Grünen S, Dietrich J, Kristiansen G, Landsberg J, Dietrich D. PD-L1 (CD274) promoter methylation predicts survival in patients with acute myeloid leukemia. Leukemia. 2017;31(3):738–43. doi:10.1038/leu.2016.328. PMID:27840427.
- Goltz D, Gevensleben H, Dietrich J, Dietrich D. PD-L1 (CD274) promoter methylation predicts survival in colorectal cancer patients. Oncoimmunology. 2016;6(1):e1257454. doi:10.1080/2162402X.2016.1257454. PMID:28197377.
- Gevensleben H, Holmes EE, Goltz D, Dietrich J, Sailer V, Ellinger J, Dietrich D, Kristiansen G. PD-L1 promoter methylation isa prognostic biomarker for biochemical recurrence-free survival in prostate cancer patients following radical prostatectomy. Oncotarget. 2016;7(48):79943–55. doi:10.18632/oncotarget.13161. PMID:27835597.
- Goltz D, Gevensleben H, Dietrich J, Schroeck F, de Vos L, Droege F, Kristiansen G, Schroeck A, Landsberg J, Bootz F, et al. PDCD1 (PD-1) promoter methylation predicts outcome in head and neck squamous cell carcinoma patients. Oncotarget. 2017;8(25):41011–20. doi:10.18632/oncotarget.17354. PMID:28487502.
- Lyford-Pike S, Peng S, Young GD, Taube JM, Westra WH, Akpeng B, Bruno TC, Richmon JD, Wang H, Bishop Ja, et. al. Evidence for a role of the PD-1:PD-L1 pathway in immune resistance of HPV-associated head and neck squamous cell carcinoma. Cancer Res. 2013;73(6):1733–41. doi:10.1158/0008-5472.CAN-12-2384. PMID:23288508.
- Lechner M, Fenton TR. The Genomics, Epigenomics, and Transcriptoms of HPV-Associated Oropharyngeal Cancer – Understanding the Basis of a Rapidly Evolving Disease. Adv Genet. 2016;93:1–56. PMID:26915269.
- Brennan K, Koenig JL, Gentles AJ, Sunwoo JB, Gevaert O. Identification of an atypical etiological head and neck squamous carcinoma subtype featuring the CpG island methylator phenotype. EBioMedicine. 2017;17:223–36. doi:10.1016/j.ebiom.2017.02.025. PMID:28314692.
- Seiwert TY, Zuo Z, Keck MK, Khattri A, Pedamallu CS, Stricker T, Brown C, Pugh TJ, Stojanov P, Cho J, et al. Integrative and comparative genomic analysis of HPV-positive and HPV-negative head and neck squamous cell carcinomas. Clin Cancer Res. 2015;21(3):632–41. doi:10.1158/1078-0432.CCR-13-3310. PMID:25056374.
- Dubot C, Bernard V, Sablin MP, Vacher S, Chemlali W, Schnitzler A, Pierron G, Ait Rais K, Bessoltane N, Jeannot E, et al. Comprehensive genomic profiling of head and neck squamous cell carcinoma reveals FGFR1 amplifications and tumour genomic alterations burden as prognostic biomarkers of survival. Eur J Cancer. 2018;91:47–55. doi:10.1016/j.ejca.2017.12.016. PMID:29331751.
- Chau NG, Li YY, Jo VY, Rabinowits G, Lorch JH, Tishler RB, Margalit DN, Schoenfeld JD, Annino DJ, Goguen LA, et al. Incorporation of Next-Generation Sequencing into Routine Clinical Care to Direct Treatment of Head and Neck Squamous Cell Carcinoma. Clin Cancer Res. 2016;22(12):2939–49. doi:10.1158/1078-0432.CCR-15-2314. PMID:26763254.
- Teschendorff AE, West J, Beck S. Age-associated epigenetic drift: implications, and a case of epigenetic thrift? Hum Mol Genet. 2013;22(R1):R7–R15. doi:10.1093/hmg/ddt375. PMID:23918660.
- Yuan T, Jiao Y, de Jong S, Ophoff RA, Beck S, Teschendorrf AE. An integrative multi-scale analysis of the dynamic DNA methylation landscape in aging. PLoS Genet. 2015;11(2):e1004996. doi:10.1371/journal.pgen.1004996. PMID:25692570.
- Rakyan VK, Down TA, Maslau S, Andrew T, Yang TP, Beyan H, Whittaker P, McCann OT, Finer S, Valdes AM, et al. Human aging-associated DNA hypermethylation occurs preferentially at bivalent chromatin. Genome Res. 2010;20(4):434–9. doi:10.1101/gr.103101.109. PMID:20219945.
- Zhao M, Qin J, Yin H, Tan Y, Liao W, Liu Q, Luo S, He M, Liang G, Shi y, et al. Distinct epigenomes in CD4+ T cells of newborns, middle-ages and centenarians. Sci Rep. 2016;6:38411. doi:10.1038/srep38411. PMID:27917918.
- Kim J, Kim K, Kim H, Yoon G, Lee K. Characterization of age signatures of DNA methylation in normal and cancer tissues from multiple studies. BMC Genomics. 2014;15:997. doi:10.1186/1471-2164-15-997. PMID:25406591.
- Acevedo N, Reinius LE, Vitezic M, Fortino V, Söderhäll C, Honkanen H, Veijola R, Simell O, Toppari J, Ilonen J, et al. Age-associated DNA methylation changes in immune genes, histone modifiers and chromatin remodeling factors within 5 years after birth in human blood leukocytes. Clin Epigenetics. 2015;7:34. doi:10.1186/s13148-015-0064-6. PMID:25874017.
- Dozmorov MG, Coit P, Maksimowicz-McKinnon K, Sawalha AH. Age-associated DNA methylation changes in naïve CD4+ T cells suggest an evolving autoimmune epigenotype in aging T cells. Epigenomics. 2017;9(4):429–45. doi:10.2217/epi-2016-0143. PMID:28322571.
- Fong L, Forde PM, Powderly JD, Goldman JW, Nemunaitis JJ, Luke JJ, Hellmann MD, Kummar S, Doebele RC, Mahadevan D, et al. Safety and clinical activity of adenosine A2a receptor (A2aR) antagonist, CPI-444, in anti-PD1/PDL1 treatment-refractory renal cell (RCC) and non-small cell lung cancer (NSCLC) patients. Abstract presented at: 2017 ASCO Annual Meeting; J Clin Oncol 35,2017 (suppl; abstr 3004); doi:10.1200/JCO.2017.35.15_suppl.3004. 2017 Jun 5; Chicago, Illinois, USA.
- Innate Pharma. IPH53: Anti-CD73 Checkpoint Inhibitor Program. Marseille (France): Innate Pharma SA; 2017 Nov 16 [accessed 2018 Feb 02].
- Lechner M, Fenton T, West J, Wilson G, Feber A, Henderson S, Thrilwell C, Dibra HK, Jay A, Butcher L, et al. Identification and functional validation of HPV-mediated hypermethylation in head and neck squamous cell carcinoma. Genome Med. 2013;5(2):15. doi:10.1186/gm419. PMID:23419152.
- Ventham NT, Kennedy NA, Adams AT, Kalla R, Heath S, O'Leary KR, Drummond H, IBD BIOM consortium, IBD CHARACTER consortium, Wilson DC, et al. Integrative epigenome-wide analysis demonstrates that DNA methylation may mediate genetic risk in inflammatory bowel disease. Nat Commun. 2016;7:13507. doi:10.1038/ncomms13507. PMID:27886173.
- Mamrut S, Avidan N, Staun-Ram E, Ginzburg E, Truffault F, Berrih-Aknin S, Miller A. Integrative analysis of methylome and transcriptome in human blood identifies extensive sex and immune cell-specific differentially methylated regions. Epigenetics. 2015;10(10):943–57. doi:10.1080/15592294.2015.1084462. PMID:26291385.
- Absher DM, Li X, Waite LL, Gibson A, Roberts K, Edberg J, Chatham WW, Kimberly RP. Genome-wide DNA methylation analysis of systemic lupus erythematosus reveals persistent hypomethylation of interferon genes and compositional changes to CD4+ T-cell population. PLoS Genet. 2013;9(8):e1003678. doi:10.1371/journal.pgen.1003678. PMID:23950730.