
ABSTRACT
Immune checkpoint inhibitors, as nivolumab, are used in advanced non-small cell lung cancer (NSCLC). However, no associated biomarker is validated in clinical practice with this drug. We investigated herein immune-related blood markers in patients with advanced NSCLC treated with nivolumab. Plasma of 43 consecutive patients were prospectively collected at time of the diagnosis of cancer, at the initiation of nivolumab and at the first tumour evaluation (2 months). Concentrations of PD-L1 (sPD-L1), soluble PD-L2 (sPD-L2), Interleukine-2 (sIl-2), Interferon-gamma (sIFN-γ), and Granzyme B (sGranB) were quantified by ELISA. Cell free RNA was quantified by Reverse Transcriptase -PCR), and plasmatic microRNAs (miRNAs) were evaluated by targeted sequencing. Expression of PD-L1 on tumour biopsies was performed by immunohistochemistry using E13LN. High sPD-L1 at 2 months and increase of sPD-L1 concentrations were associated with poor response and absence of clinical benefit (nivolumab treatment less than 6 months). The variation of sPD-L1 concentrations were confirmed by RNA quantification. sPD-L1 concentrations were not correlated with PD-L1 expression on corresponding tumour samples. Low sGranB at nivolumab initiation was also associated with poor response. High sPD-L1 and low sGranB were associated with poor progression-free survival (PFS) and overall survival (OS). Low sPD-L2, low sIl-2 and high sIFN-γ were associated with grade 3–4 toxicities. Finally, miRNA screening showed that patients with clinical benefit (n = 9) had down-expression of miRNA-320b and -375 compared to patients with early progression at 2 months (n = 9). In conclusion, our results highlight the interest of circulating biomarkers in patients treated with nivolumab.
Introduction
Lung cancer is the leading cause of cancer related death worldwide.Citation1 Its prognosis, especially at the advanced stage, is poor with limited efficacy of cytotoxic chemotherapy (CT). Immune checkpoint inhibitors (ICIs), humanised monoclonal antibodies targeting programmed death 1 (PD-1) or programmed death-ligand 1 (PD-L1), have recently been developed. PD-L1 and programmed death-ligand (PD-L2) are membranous proteins expressed by malignant cells that interact with PD-1 expressed by T-cells. When PD-L1/PD-L2 and PD-1 bind, the T-cells' cytotoxic anti-tumour activity is down-regulated. By blocking the interaction between PD-L1 and PD-1, ICIs restore cytotoxic immune response. The Type 1 T helper (Th1)-related cytotoxic lymphocyte activation is mainly mediated by two effectors, interleukine-2 (IL-2) and interferon-gamma (IFN-γ).Citation2,Citation3 After recognition of tumour antigens, activated CD8+ lymphocytes secrete perforins and granzymes (mainly Granzyme B) that induce tumour cell death.Citation2
ICIs have shown their efficacy in advanced non-small cell lung cancer (NSCLC). Nivolumab, an anti-PD-1 antibody, is currently used for second-line treatment in ALK- and EGFR-wild type advanced NSCLC.Citation4,Citation5 There is however no biomarker predictive of nivolumab efficacy validated for clinical practice in this setting. In the two pivotal Checkmate studies,Citation4,Citation5 PD-L1 immunohistochemistry (IHC) was performed on the tumour specimens obtained at the time of diagnosis. This analysis found that patients with non-squamous histology and high PD-L1 expression determined by IHC had longer progression-free survival (PFS) and overall survival (OS) than those with low PD-L1 expression.Citation5 These findings were not replicated in the squamous histology setting.Citation4 Patients were not stratified at randomisation according to PD-L1 IHC, which was performed retrospectively, rendering the interpretation of these results difficult. In addition, IHC was performed on the diagnostic tumour specimens whereas PD-L1 expression varies with time and especially after CT.Citation6,Citation7 Moreover, PD-L1 IHC interpretation can be difficult, as there is a spatial heterogeneity of PD-L1 expression, within one same tumour region or between two different tumour regions (primary and metastatic).Citation8-Citation14 There is therefore an unmet need for developing new biomarkers to predict nivolumab efficacy. Tumour mutation load or IFN-γ signature have recently been evaluated,Citation15,Citation16 but their use in clinical practice is still challenging.
Compared with tumour specimens, plasma has the advantage of being easily accessible, allowing sequential analysis during follow-up. Plasmatic biomarkers also have the advantage of reflecting different tumour clones present throughout the body. Circulating tumour DNA (ctDNA) has shown to be a good predictive marker of ICIs efficacy.Citation17-Citation19 However, no study has been dedicated so far to other circulating biomarkers such as ICI-related proteins or circulating microRNA (miRNA). The presence of soluble PD-L1 (sPD-L1) has already been established in patients with NSCLC with a prognostic impact of sPD-L1 concentrations.Citation20-Citation22 Its prognostic and predictive impact with ICIs is however still unknown.
In this study, we propose to evaluate new plasmatic biomarkers as putative predictive biomarkers associated with nivolumab efficacy and toxicity in advanced NSCLC: sPD-L1, sPD-L2, sGranzyme B (sGran B), sIl, sIFN-γ , and circulating miRNA.
Results
Characteristics of the 43 patients are presented in . Patients were mostly male (67%), current or former smokers (88%) and with adenocarcinoma histology (65%). They had advanced stage disease at diagnosis (93%) and mainly without EGFR-, KRAS- mutations or ALK -rearrangement (63%). Nivolumab was given as second-line treatment in 67% of cases (further line in 33%), and patients had good PS (0 – 1) at nivolumab initiation in 58% of cases.
Table 1. Patients' characteristics.
Objective Response Rate (ORR) with nivolumab in the global population was 40% (n = 17), and 35% (n = 15) had clinical benefit under nivolumab (as defined as still receiving nivolumab at 6 months). With a median follow-up of 16.3 months (IQR 11.7 – 21.1), 24 patients (56%) were deceased at the time of cut-off due to tumour progression, 11 patients (26%) had controlled disease, 5 (12%) were still receiving further treatment after nivolumab progression and 3 (6%) were lost during follow-up. The median nivolumab progression-free survival (PFS) was 3.0 months (IQR 1.6 – 10.1) and median overall survival (OS) was 6.2 months (IQR 2.2 – NR).
At initial diagnosis, nivolumab initiation and first tumour evaluation (2 months of treatment), median sPD-L1 concentrations were 39.81 pg/ml (IQR 29.75 – 59.21), 49.86 pg/ml (IQR 36.11 – 65.91) and 51.57 pg/ml (IQR 31.91 – 72.06), respectively; median sPD-L2 concentrations were 16390.00 pg/ml (IQR 11185.00 – 22335.50), 18250.00 pg/ml (13963.00 – 21750.00) and 17567.00 pg/ml (14384.50 – 22166.50), respectively; median sGranB concentrations were 14.06 pg/ml (IQR 9.84 – 21.13), 13.24 pg/ml (IQR 8.53 – 18.95) and 17.24 pg/ml (IQR 8.63 – 25.79), respectively; median sIL-2 concentrations were 188.00 pg/ml (IQR 113.00 – 227.50), 162.00 pg/ml (IQR 96.75 – 242.00) and 152.00 pg/ml (IQR 91.50 – 176.50), respectively ; median sIFN-γ concentrations were 0.13 pg/ml (IQR -0.03 – 0.29), 0.05 pg/ml (IQR -0.03 – 0.20) and 0.11 pg/ml (IQR -0.06 – 0.27), respectively.
ORR, clinical benefit and survival
sPD-L1
At initial diagnosis and at nivolumab initiation, there was no statistical difference in sPD-L1 concentrations in patients who were responders compared to non-responders to nivolumab (Supplementary Fig. 1A and 1B), and in patients presenting with clinical benefit compared to patients who did not present with clinical benefit (Supplementary Fig. 1C and 1D). However, at first tumour evaluation under nivolumab, sPD-L1 concentrations were significantly higher in non-responders with a median value of 67.64 pg/ml (IQR 46.36 – 75.14) compared to 32.94 pg/ml (IQR 24.89 – 58.91) in responders (p = 0.031) (). In the same way, median sPD-L1 concentrations were significantly higher in patients without clinical benefit with a median value of 67.64 pg/ml (IQR 42.74 – 75.45) compared to 34.14 pg/ml (IQR 24.67 – 56.48) in patients with clinical benefit (p = 0.024) (). Moreover, in case of increase of sPD-L1 concentrations between the initiation of nivolumab and first tumour evaluation (n = 12), ORR was 17% (n = 2) versus 68% (n = 13) in case of decrease or stability of sPD-L1 concentrations (n = 19) (p = 0.005). The clinical benefit rate was 10% (n = 1) in case of increase of sPD-L1 concentrations, versus 47% (n = 8) in case of decrease or stability of sPD-L1 concentrations (n = 17) (p = 0.049).
Figure 1. sPD-L1 and tumour response, clinical benefit, progression-free survival (PFS) and overall survival (OS). A: sPD-L1 concentrations at first tumour evaluation in patients with tumour response and patients without tumour response. B: sPD-L1 concentrations at first tumour evaluation in patients with clinical benefit and patients without clinical benefit. C and D: PFS (C) and OS (D) according to sPD-L1 concentration at first tumour evaluation. E and F: PFS (E) and OS (F) according to sPD-L1 variation between nivolumab initiation and first tumour evaluation. P-values were calculated by Mann-Whitney test (A and B) or log-rank test (C-F).
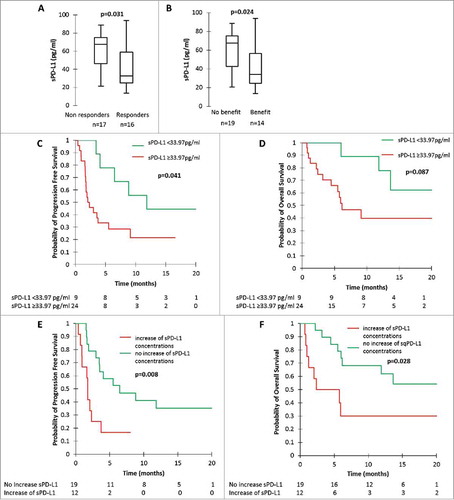
Using ROC curves, we found a sPD-L1 cut-off concentration of 33.97 pg/ml associated with a sensitivity of 94%, a specificity of 56%, a positive predictive value (PPV) of 70% and a negative predictive value (NPV) of 90% to predict response at first tumor evaluation. Using this cut-off, we determined that patients with low sPD-L1 (n = 10) had an ORR of 90% whilst patients who had high sPD-L1 concentrations (n = 23) had an ORR of 30% (p = 0.002). In the same way, we found a cut-off concentration of 36.36 pg/ml associated with a sensitivity of 84%, a specificity of 57%, a PPV of 73% and an NPV of 73% to predict clinical benefit. Using this cut-off, we determined that patients with low sPD-L1 concentrations (n = 11) had clinical benefit in 73% of cases, whereas patients who had high sPD-L1 concentrations (n = 22) had clinical benefit in 38% of cases (p = 0.013).
We confirmed the variation of sPD-L1 by performing RT-PCR analysis on circulating RNA. Selecting the patients with the most important increase (n = 5; ranging from +78% to +101%) and decrease (n = 5; ranging from -39% to -69%) of sPD-L1 concentrations evaluated by ELISA, we showed that patients with sPDL-L1 increase in ELISA had a significant increase of PD-L1 expression (n = 3; 2 patients without evaluable RT-PCR results). In the same way, patients with sPD-L1 decrease in ELISA had a significant decrease of PD-L1 expression (n = 2; 3 patients without evaluable RT-PCR results) ().
Table 2. Relative PD-L1 gene expression in plasma (evaluated by RT-PCR) in patients with the largest increase or decrease of sPD-L1 concentrations (evaluated by ELISA) between nivolumab initiation and first tumour evaluation.
High sPDL-L1 concentrations at the first tumour evaluation and increase of sPD-L1 concentrations were associated with worse PFS and OS (). Patients with low sPD-L1 concentration at first tumour evaluation had a median PFS of 11.8 months (IQR 6.5 – NR) and median OS NR (IQR 13.6 – NR), versus median PFS of 2.2 months (IQR 1.6 – 9.1) and median OS of 6.2 months (IQR 2.4 -NR) for patients with high sPD-L1 concentrations at first tumour evaluation (p = 0.041 for PFS comparison and p = 0.087 for OS comparison) ( and ). Patients presenting with an increase of sPD-L1 concentrations had a median PFS of 1.8 months (IQR 0.9 – 3.0), versus 6.5 months (IQR 3.0 – NR) in patients presenting with a decrease or a stability of sPD-L1 concentrations (p = 0.008). (). Median OS was 5.4 months (IQR 1.1 – NR) in patients with increasing sPD-L1 concentrations, versus NR (6.0 – NR) in patients with stable or decreasing sPD-L1 concentrations (p = 0.028). (). Multivariate analysis on PFS () confirmed the independent role of the increase of sPD-L1, with a hazard ration (HR) at 4.85 (IC95% 1.02-NR; p = 0.048). The only significant factor for OS in multivariate analysis was PS (PS more than 1 associated with a HR = 36.49; IC95% 4.56-291.76; p = 0.001) ().
Table 3. Multivariate analysis (Cox Model) on progression-free survival.
Table 4. Multivariate analysis (Cox model) on overall survival.
Finally, we analysed the outcome in patients with stable disease as best tumour response according to iRECIST (n = 5). Interestingly, the two patients who had decreasing sPD-L1 levels had longer PFS (5.51 and 21.08 months) than patients who had increasing sPD-L1 levels (3.74, 2.33 and 2.07 months). Two examples of stable patients with differential outcome according to sPD-L1 measurements are shown in Supplementary .
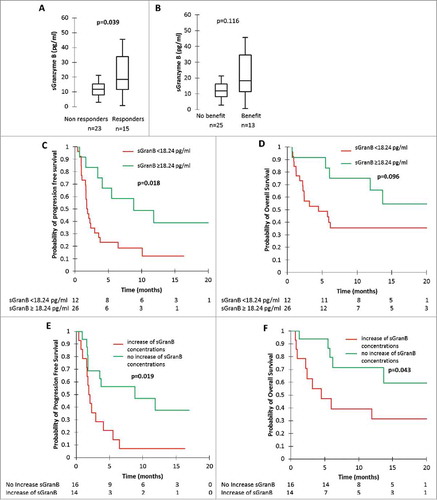
Figure 2. sGranzyme B (sGran B) and tumour response, clinical benefit, progression-free survival (PFS) and overall survival (OS). A: sGran B concentrations at nivolumab initiation in patients with tumour response and patients without tumour response. B: sGran B concentrations at nivolumab initiation in patients with clinical benefit and patients without clinical benefit. C and D: PFS (C) and OS (D) according to sGran B concentrations at nivolumab initiation. E and F: PFS (E) and OS (F) according to sGran B variation between nivolumab initiation and first tumour evaluation. P-values were calculated by Mann-Whitney test (A and B) or log-rank test (C-F).
Of the 43 patients included in the study, PD-L1 IHC was performed in 34 cases (79%) on diagnostic samples. Twenty-four patients (71%) had a positive PD-L1 expression. No association was observed between IHC positivity and sPD-L1 expression in IHC at the time of diagnosis: median sPD-L1 was 30.86 pg/ml (IQR 22.13 – 48.23) in patients with positive IHC and 36.68 pg/ml (IQR 26.10 – 55.34) in patients with negative IHC (p = 0.604).
There was no correlation between sPD-L1 concentrations at diagnosis and level of expression of PD-L1 in IHC according to different cut-offs (Supplementary ).
Figure 3. sPD-L2, sIL-2, sIFN-γ and grade 3–4 toxicity with nivolumab. A and B: sPD-L2 concentrations at initial diagnosis (A) and at nivolumab initiation (B) in patients with grade 3–4 toxicity and patients without grade 3–4 toxicity. C: sIL-2 concentrations at nivolumab initiation in patients with grade 3–4 toxicity and patients without grade 3–4 toxicity. D: sIFN-γ concentrations at first tumour evaluation in patients with grade 3–4 toxicity and patients without grade 3–4 toxicity. P-values were calculated by Mann-Whitney test.
sGranzyme B
There was no statistical difference in sGran B concentrations measured at initial diagnosis and at first tumor evaluation in patients who were responders compared to non-responders (Supplementary Fig. 4A and 4B) and in patients presenting with clinical benefit compared to patients who did not present with clinical benefit (Supplementary Fig. 4C and 4D). However, at nivolumab initiation, responders had significantly higher median sGranzyme B concentrations than non-responders: 18.44 pg/ml (IQR 11.71 – 33.92) versus 11.88 pg/ml (IQR 7.94 – 15.41) (p = 0.039) (). In the same way, median sGran B concentrations tended to be higher in patients with clinical benefit with a median value of 67.64 pg/ml (IQR 42.74 – 75.45) compared to 34.14 pg/ml (IQR 24.67 – 56.48) in patients without clinical benefit (p = 0.116) (). There was also a trend towards a differential evolution of sGran B concentrations according to tumour response and clinical benefit: ORR was 29% (n = 4) in case of increase of sGran B concentrations (n = 14), versus 63% (n = 10) in case of decrease or stability of sGran B concentrations (n = 16) (p = 0.063). In case of increase of sGran B concentrations (n = 14), the clinical benefit rate was 21% (n = 3), versus 56% (n = 9) in case of decrease or a stability of sGran B concentrations (n = 16) (p = 0.052).
Using ROC curves, we found a cut-off concentration of 18.24 pg/ml associated with a sensitivity of 53%, a specificity of 87%, a PPV of 73% and an NPV of 74% to predict tumour response at nivolumab initiation. Using this cut-off, we determined that patients with high sGran B concentrations (n = 11) had an ORR of 73%, whereas patients who had low sGran B concentrations (n = 27) had an ORR of 26% (p = 0.007).
Low sGran B concentrations at nivolumab initiation and increase of sGran B concentrations were also associated with worse PFS and OS (). Patients with high sGran B concentrations at nivolumab initiation had a median PFS of 8.8 months (IQR 3.7 -NR) and median OS NR (IQR 9.0 – NR), versus median PFS of 1.8 months (IQR 1.1 -3.7) and median OS of 4.5 months (IQR 1.8 – NR) for patients with low sGran B concentrations at nivolumab initiation (p = 0.018 for PFS comparison, and p = 0.096 for OS comparison) ( and ). Patients presenting with an increase in sGran B concentrations had a median PFS of 2.0 months (IQR 1.6 – 4.1), versus 8.8 months (IQR 1.8 -NR) in patients presenting with a decrease or a stability of sGran B concentrations (p = 0.019) (). Median OS was 4.5 months (IQR 2.2 – NR) in patients with increasing sGran B concentrations, versus NR (IQR 6.2 – NR) in patients with stable or decreasing sGranzyme B concentrations (p = 0.043) ().
sPD-L2, sIL-2 and sIFN-γ
There was no impact of sPD-L2, sIL-2 and sIFN-γ concentrations and variations on ORR, clinical benefit, PFS or OS, at any time of analysis (Supplementary Figs. 5 and 6).
Immune related adverse events (irAEs)
Eight patients (19%) experienced grade 3 – 4 irAEs whilst receiving nivolumab: hypophysitis (n = 1), arthro-myalgia (n = 1), auto-immune cholangitis (n = 1), auto-immune hepatitis (n = 1), auto-immune kidney failure (n = 1), interstitial pneumonia (n = 1), skin toxicity (n = 1), auto-immune colitis (n = 1).
Of all the tested biomarkers, sPD-L2 at initial diagnosis and at nivolumab initiation, sIL-2 at nivolumab initiation and sIFN-γ at first tumor evaluation were significantly associated with grade 3–4 irAEs with nivolumab ( and Supplementary Fig. 7).
miRNA
We performed miRNA screening on plasma at nivolumab initiation, and compared the miRNA profile between patients with clinical benefit (n = 9) and patients with early progression (at first tumour evaluation) under nivolumab (n = 9). We showed a differential expression of 2 miRNA between the 2 groups of patients (Supplementary Fig. 8), corresponding to miRNA-320b and miRNA-375. Patients with clinical benefit had a down-expression of both miRNA-320b (fold change -3.1) and -375 (fold change -3.2), compared to patients with early progression (p<0.05 for both miRNA). When analyzing target genes using miRecords, miRTarBase and TarBase databases, we found that miRNA-320b was notably associated with proliferation (MYC, TUBB1) genes, while miRNA-375 was notably associated with immune-related genes (JAK2, TGF-β2), Wnt pathway (FZD4, FZD8), proliferation (MYC), Hippo pathway (YAP1) and tumor migration (NCAM1, CDH2) genes.
Discussion
This study reports for the first time the predictive role of plasmatic immune-related biomarkers and circulating miRNA in NSCLC patients treated with nivolumab. We showed that sPD-L1 and sGran B were associated with outcome, whereas sPD-L2, sIL-2 and sIFN-γ were associated with nivolumab-related grade 3 – 4 toxicity. Finally, we observed that the plasmatic miRNA profile at the beginning of treatment was different between patients with objective response and patients with early progression under nivolumab.
Our results suggest that sPD-L1 may play an important part in evaluating response, survival and clinical benefit under nivolumab. sPD-L1 concentrations at first tumour evaluation and the variation of sPD-L1 concentrations at the beginning of treatment were associated with ORR and clinical benefit at six months. sPD-L1 also strongly impacted PFS and OS, with longer median PFS and OS in case of low sPD-L1 concentrations at first tumour evaluation or in case of decrease or stability of sPD-L1 concentrations between initiation of nivolumab and first tumour evaluation. sPD-L1 has already been studied in NSCLC, with results showing a higher sPD-L1 expression in patients with NSCLC than in healthy controls, and that patients had a better prognosis in case of higher sPD-L1 concentrations.Citation20,Citation21 However, patients did not receive ICIs treatment in these studies. Furthermore, the patients did not have multiple sPD-L1 measurements and no dynamic analysis was performed. Finally, the moment of sampling was not specified beforehand with samples taken at different times (diagnosis, during treatment) rendering comparisons difficult. Another report studied the variation of sPD-L1 in patients with locally advanced or inoperable NSCLC undergoing radiotherapy.Citation22 This study showed that sPD-L1 levels measured after 2 and 4 weeks of radiotherapy significantly decreased compared to pre-radiotherapy levels and that patients with lower baseline sPD-L1 levels had longer OS than those with higher sPD-L1 levels.
We did not show a correlation between the sPD-L1 concentrations and the expression of PD-L1 in IHC performed on the initial biopsy. This can in part be explained by the use of two different antibodies for ELISA (28-8 clone) and for IHC (E13LN clone). However, recent publications have shown a good concordance between these two antibodies for PD-L1 expression in tumour cells.Citation23 The difference between ELISA and IHC could also be explained by the fact that plasma reflects the entire tumour heterogeneity, whereas PD-L1 expression can be heterogeneous within one tumour site, but also between different tumour sites.Citation8-Citation14 Finally, sPD-L1 could also be secreted by cells other than tumour cells, such as immune cells. Interestingly, we confirmed the variation of sPD-L1 concentrations by RT-PCR from circulating RNA in patients with the largest variations of sPD-L1 concentrations. Circulating RNA is a mix of RNA from tumour cells and from other cells (immune cells, stroma cells…), so our results cannot precisely determine the source of sPD-L1. Little data is currently available on the origin and function of sPD-L1. The first hypothesis is that sPD-L1 concentrations reflect the tumour mass and that its presence in peripheral blood is due to the lysis of tumour cells. A high level of sPD-L1 would be the reflection of high tumour mass and the increase of sPD-L1 concentrations under nivolumab associated with poorer response could simply reflect the increase of the tumour volume. The second hypothesis is that sPD-L1 has its own biological effect. It could interfere with nivolumab by binding with PD-1 expressed by T lymphocytes and induce a competing effect with nivolumab. The low sPD-L1 concentrations at the beginning of treatment associated with better efficacy of nivolumab is compatible with such a hypothesis. A study is currently underway to try to determine which cells produce sPD-L1 in various malignancies (NCT01660776).
Granzyme B is a serine protease that is a mediator of target-cell apoptosis by cells such as NK cells and cytotoxic CD8+ T cells. Granzymes are delivered to the target cells via cytotoxic granules and are responsible for caspase-dependant apoptosis.Citation24,Citation25 Soluble Granzyme B has already been explored in the context of auto-immune diseases, showing that high levels of sGran B were associated with rheumatoid arthritis, myocardial infarction and lipid-rich carotid plaques.Citation26-Citation28 To our knowledge, this is the first time that sGran B concentrations have been evaluated in the plasma of NSCLC patients treated with nivolumab. We found that patients who presented with an objective response to nivolumab had significantly higher sGran B concentrations at nivolumab initiation than patients who were non-responders. This could reflect the activation of the CD8+ cytotoxic immune response, known to be associated with better response with ICIs. When analysing the variation of sGran B concentrations between nivolumab initiation and first tumour evaluation we found a tendency favouring patients with stable or decreasing concentrations for ORR, clinical benefit, OS and PFS. As for sPD-L1, an increase of sGran B at the beginning of the treatment could be the reflection of the persistence of a high tumour volume, with persistent CD8 lymphocytes activation and Granzyme B secretion. However, these hypotheses need to be validated in further studies.
The prediction of severe adverse events with ICIs remains a daily challenge. Even if grade 3 – 4 adverse events are rare with nivolumab,Citation4,Citation5 they can be severe, impacting quality of life, sometimes life-threatening, and can lead to treatment interruption. We found that several immune-related plasmatic biomarkers were associated with grade 3 – 4 toxicity. Patients presenting grade 3 – 4 toxicity under nivolumab had lower sPD-L2 concentrations at initial diagnosis and at nivolumab initiation, lower sIL-2 concentrations at nivolumab initiation, and higher sIFN-γ concentrations at first tumour evaluation. If confirmed, these results could help predict which patients are at risk for high-grade toxicity as early as the beginning of treatment, leading to close follow-up of such patients.
miRNA are non-coding RNA fragments with biological activity. Their role in solid cancers has been widely studied, and they have been shown to be involved in chemo-resistance.Citation29 Some publications have suggested an implication of miRNA in immune response regulation as well as PD-L1 and PD-1 expression regulation.Citation30-Citation41 We report for the first time the association of down-regulation of circulating miRNA-320b and -375 expression and response to ICIs. miRNA-320b is down-regulated in various cancers, and it is associated with tumorigenesis and poor prognosis in glioma.Citation42 miRNA-375 was also shown to be often down-regulated in NSCLC,Citation43,Citation44 breast cancer,Citation45 colorectal cancer,Citation46-Citation49 oesophageal cancer,Citation50,Citation51 gastric cancer,Citation52,Citation53 and pancreatic cancer.Citation54,Citation55 It is associated with tumour proliferation and metastases.Citation44,Citation48,Citation51,Citation54,Citation56-Citation59 In NSCLC, miRNA-375 is associated with poor prognosis.Citation43,Citation44,Citation60 Interestingly, miRNA-375 is strongly associated with the Wnt/β-catenine pathwayCitation49 and the Hippo pathway,Citation59,Citation61-Citation63 known to be involved in ICIs resistance.Citation64-Citation70 Moreover, miRNA-375 targets the JAK2 gene,Citation62,Citation71 involved in the IFN-γ and TNF-α pathways, key-regulators of cytotoxic CD8+ immune response.Citation72 Taken together, these data, highlighted by our results, suggest an implication of both miRNA-320b and miRNA-375 in anti-tumour immune response with ICIs, and the potential utility of screening for these miRNA in plasma before beginning nivolumab to select patients who will have response and clinical benefit with this treatment.
This study has several limitations. It is a monocentric study of small size, with a possibility of lack of power for some statistical analyses, especially for multivariate analyses. Nevertheless, despite this small population, we observed significant results on ORR, clinical benefit, survival and toxicity. Finally, to confirm the predictive value of sPD-L1 and sGran B it would be necessary to use a validation cohort with a control group. This study also has several strengths. We used a prospective cohort of patients with plasma samples. These samples were well characterised beforehand and underwent rigorous pre-analytical conditioning. Furthermore, our study presents multiple samples for each patient allowing dynamic analyses.
In conclusion, sPD-L1 and sGran B seem to be promising biomarkers associated with tumour response and clinical benefit with nivolumab, while sPD-L2, sIL-2 and sIFN- γ were effective in predicting immune-related toxicities. Furthermore, the screening of circulating miRNA also seems to be an exciting research possibility. If confirmed, our results suggest that an approach integrating plasmatic immune-related biomarkers such as sPD-L1, sGran B or circulating miRNA could help us to rapidly detect patients who truly benefit from immunotherapy and, on the contrary, consider a rapid change of strategy in case of no anticipated clinical benefit. Further studies are needed, for validation of these biomarkers in a different cohort of patients and evaluation in other ICIs treatment settings (first-line treatment, combination of ICIs, ICIs and chemotherapy combined treatment).
Materials and methods
Experimental design
This study was an exploratory study, based on the analysis of consecutive patients prospectively included in the Department of Respiratory Medicine and Thoracic Oncology (APHP – Ambroise Pare Hospital) between July 2015 and September 2017. Exploratory endpoints were ORR, clinical benefit (i.e. complete response, partial response or stability, according to iRECIST, lasting 6 months or more after initiation of nivolumab treatment), PFS, OS, grade 3 – 4 toxicity (according to CTCAE v4.0), according to plasmatic concentrations of various circulating biomarkers. Differential analysis of plasmatic miRNA profiles between responders and patients with early progression with nivolumab was also planned.
Patients and plasma
Tumour response was evaluated every two months using iRECIST criteria. Medical records were reviewed, and data retrospectively extracted on clinical and pathological features as well as treatment history. Plasma samples were taken at diagnosis, just before the first injection of nivolumab (C1), and at the first tumour evaluation (at 2 months, M2) (Supplementary Fig. 9). Two 10ml-EDTA tubes of peripheral blood were taken, and plasma was isolated within one hour after and immediately conserved at −80°C.
Ethical considerations
All patients signed an informed consent allowing blood to be drawn and stored within the Centre de Ressources Biologiques (CRB) of the Ambroise Paré University Hospital during their follow-up and treatment. The protocol was approved by the Institutional Review Board CPP IDF n°8 (ID CRB 2014-A00187-40).
ELISA technique
sPD-L1, sPD-L2, sGran B, sIL-2, sIFN-γ concentrations were calculated by ELISA. ELISA tests were performed using commercial kits (ab214565 Human PD-L1 [28-8] ELISA Kit, Abcam; BMS 2215 Human PD-L2 Platinum ELISA, Thermo Fisher Scientific; BMS 2027 Human Granzyme b Coated ELISA Kit, Thermo Fisher Scientific; ab174443 Human IFN gamma ELISA Kit, Abcam; ab174444 Human Il-2 ELISA Kit, Abcam) according to manufacturer's instructions. Corresponding recombinant proteins were used for each test at pre-specified concentrations to build standard curves. The results were obtained using a spectrophotometer (reading at 450nm), and concentrations were calculated according to the standard curves. All samples, standards and negative controls were tested in duplicate.
IHC technique
IHC was performed using an automated method (Leica) and the E13LN anti-PD-L1 antibody (Cell signalling Technology) diluted to the 1/80th on 4µm-slides from the treatment-naïve diagnostic samples. The assay was performed using human amygdala as positive control, and IgG as isotype negative control. The IHC was considered as being positive if at least one tumour cell out of 100 analysed tumour cells was positively stained.
Quantitative reverse-transcriptase polymerase chain reaction (RT-PCR)
Plasmatic RNAs were extracted using miRNeasy Serum/Plasma kit (Qiagen), according to manufacturer's instructions. RNA concentrations were evaluated by Nanodrop. cDNA was synthesized using iScript cDNA Synthesis Kit (Bio-Rad) according to the manufacturer's instructions. RT-PCR for PD-L1 gene expression was performed using specific Taqman primers and probes (Hs00204257_m1, ThermoFisher) on 7900HT Fast Real-Time PCR System (Applied Bisosystems). Gene expression analysis was calculated with the delta-delta CT method normalized to an endogenous control (RPLP0). All samples were tested in triplicate.
miRNA screening
Plasmatic miRNA were extracted using miRNeasy Serum/Plasma kit (Qiagen), according to manufacturer's instructions. miRNA concentrations were evaluated by BioAnalyzer. Screening of plasmatic miRNA was performed by targeted sequencing using TruSeq Small RNA kit (Illumina). Briefly, after a ligation step of miRNA with specific Illumina adapters, a RT-PCR was run. Banks of sequences were then analysed on HiSeq2500 (single read mode), with reading of 50 nucleotides (enough to cover the 19 to 22 bases of miRNA). After normalization and a trimmed mean calculation step,Citation73 a differential analysis of expressed miRNA between patients with clinical benefit and patients with early progression with nivolumab was performed.Citation74,Citation75 After identification of miRNA differentially expressed, corresponding target genes were identified using miRecords, miRTarBase and TarBase databases.Citation76
Statistical analysis
Median soluble concentrations of all the tested biomarkers were analysed according to ORR, clinical benefit, grade 3–4 toxicities. The comparison of median biomarker levels between groups was performed using Mann-Whitney test and inter-quartile range (IQR) is given for each value. Receiving Operating Curve (ROC) method was used to determine a cut-off level for each biomarker with a significant difference for endpoints with the Mann-Whitney test. Kaplan-Meier method was used to determine OS and PFS. Comparison between survival curves was performed using log-rank method. Multivariate analysis was performed using Cox proportional hazards model (PFS, OS), integrating experimental variables with significant result in univariate abalyses, and known prognostic and predictive associated with ICIs (PS, PD-L1 IHC). Data analysis was computed using XLStat v 19.4 (Addinsoft). P-values were considered as significant if <0.05.
2018ONCOIMM0026R-f04-z-4c.docx
Download MS Word (2.6 MB)Disclosure statement
EGL received research funding from Bristol-Myers Squibb. Other authors did not have conflict of interest related to this project.
Additional information
Funding
References
- Siegel RL, Miller KD, Jemal A. Cancer statistics, 2016. CA Cancer J Clin. 2016;66:7–30. doi:10.3322/caac.21332.
- Martinez-Lostao L, Anel A, Pardo J. How Do Cytotoxic Lymphocytes Kill Cancer Cells? Clin Cancer Res. 2015;21:5047–56. doi:10.1158/1078-0432.CCR-15-0685. PMID:26567364.
- Balkhi MY, Ma Q, Ahmad S, Junghans RP. T cell exhaustion and Interleukin 2 downregulation. Cytokine. 2015;71:339–47. doi:10.1016/j.cyto.2014.11.024. PMID:25516298.
- Brahmer J, Reckamp KL, Baas P, Crinò L, Eberhardt WEE, Poddubskaya E, Antonia S, Pluzanski A, Vokes EE, Holgado E, et al. Nivolumab versus Docetaxel in Advanced Squamous-Cell Non-Small-Cell Lung Cancer. N Engl J Med. 2015;373:123–35. doi:10.1056/NEJMoa1504627. PMID:26028407.
- Borghaei H, Paz-Ares L, Horn L, Spigel DR, Steins M, Ready NE, Chow LQ, Vokes EE, Felip E, Holgado E, et al. Nivolumab versus Docetaxel in Advanced Nonsquamous Non-Small-Cell Lung Cancer. N Engl J Med. 2015;373:1627–39. doi:10.1056/NEJMoa1507643. PMID:26412456.
- Sheng J, Fang W, Yu J, Chen N, Zhan J, Ma Y, Yang Y, Huang Y, Yanhuang null, Zhao H, et al. Expression of programmed death ligand-1 on tumor cells varies pre and post chemotherapy in non-small cell lung cancer. Sci Rep. 2016;6:20090. doi:10.1038/srep20090. PMID:26822379.
- Lim SH, Hong M, Ahn S, Choi Y-L, Kim K-M, Oh D, Ahn YC, Jung S-H, Ahn M-J, Park K, et al. Changes in tumour expression of programmed death-ligand 1 after neoadjuvant concurrent chemoradiotherapy in patients with squamous oesophageal cancer. Eur J Cancer Oxf Engl 1990. 2016;52:1–9.
- Kim S, Kim M-Y, Koh J, Go H, Lee DS, Jeon YK, Chung DH. Programmed death-1 ligand 1 and 2 are highly expressed in pleomorphic carcinomas of the lung: Comparison of sarcomatous and carcinomatous areas. Eur J Cancer Oxf Engl 1990. 2015;51:2698–707..
- Ilie M, Long-Mira E, Bence C, Butori C, Lassalle S, Bouhlel L, Fazzalari L, Zahaf K, Lalvée S, Washetine K, et al. Comparative study of the PD-L1 status between surgically resected specimens and matched biopsies of NSCLC patients reveal major discordances: a potential issue for anti-PD-L1 therapeutic strategies. Ann Oncol Off J Eur Soc Med Oncol. 2016;27:147–53. doi:10.1093/annonc/mdv489.
- Li C, Huang C, Mok TS, Zhuang W, Xu H, Miao Q, Fan X, Zhu W, Huang Y, Lin X, et al. Comparison of 22C3 PD-L1 Expression between Surgically Resected Specimens and Paired Tissue Microarrays in Non-Small Cell Lung Cancer. J Thorac Oncol Off Publ Int Assoc Study Lung Cancer. 2017;12:1536–43.
- Casadevall D, Clavé S, Taus Á, Hardy-Werbin M, Rocha P, Lorenzo M, Menéndez S, Salido M, Albanell J, Pijuan L, et al. Heterogeneity of Tumor and Immune Cell PD-L1 Expression and Lymphocyte Counts in Surgical NSCLC Samples. Clin Lung Cancer. 2017;18:682–91. e5. doi:10.1016/j.cllc.2017.04.014. PMID:28549836.
- Uruga H, Bozkurtlar E, Huynh TG, Muzikansky A, Goto Y, Gomez-Caraballo M, Hata AN, Gainor JF, Mark EJ, Engelman JA, et al. Programmed Cell Death Ligand (PD-L1) Expression in Stage II and III Lung Adenocarcinomas and Nodal Metastases. J Thorac Oncol Off Publ Int Assoc Study Lung Cancer. 2017;12:458–66.
- Pinato DJ, Shiner RJ, White SDT, Black JRM, Trivedi P, Stebbing J, Sharma R, Mauri FA. Intra-tumoral heterogeneity in the expression of programmed-death (PD) ligands in isogeneic primary and metastatic lung cancer: Implications for immunotherapy. Oncoimmunology. 2016;5:e1213934. doi:10.1080/2162402X.2016.1213934. PMID:27757309.
- Mansfield AS, Aubry MC, Moser JC, Harrington SM, Dronca RS, Park SS, Dong H. Temporal and spatial discordance of programmed cell death-ligand 1 expression and lymphocyte tumor infiltration between paired primary lesions and brain metastases in lung cancer. Ann Oncol Off J Eur Soc Med Oncol. 2016;27:1953–8. doi:10.1093/annonc/mdw289.
- Van Allen EM, Miao D, Schilling B, Shukla SA, Blank C, Zimmer L, Sucker A, Hillen U, Foppen MHG, Goldinger SM, et al. Genomic correlates of response to CTLA-4 blockade in metastatic melanoma. Science. 2015;350:207–11. doi:10.1126/science.aad0095. PMID:26359337.
- Garcia-Diaz A, Shin DS, Moreno BH, Saco J, Escuin-Ordinas H, Rodriguez GA, Zaretsky JM, Sun L, Hugo W, Wang X, et al. Interferon Receptor Signaling Pathways Regulating PD-L1 and PD-L2 Expression. Cell Rep. 2017;19:1189–201. doi:10.1016/j.celrep.2017.04.031. PMID:28494868.
- Cabel L, Riva F, Servois V, Livartowski A, Daniel C, Rampanou A, Lantz O, Romano E, Milder M, Buecher B, et al. Circulating tumor DNA changes for early monitoring of anti-PD1 immunotherapy: a proof-of-concept study. Ann Oncol. 2017;28:1996–2001. doi:10.1093/annonc/mdx212. PMID:28459943.
- Iijima Y, Hirotsu Y, Amemiya K, Ooka Y, Mochizuki H, Oyama T, Nakagomi T, Uchida Y, Kobayashi Y, Tsutsui T, et al. Very early response of circulating tumour-derived DNA in plasma predicts efficacy of nivolumab treatment in patients with non-small cell lung cancer. Eur J Cancer Oxf Engl 1990. 2017;86:349–57.
- Giroux Leprieur E, Herbretau G, Dumenil C, Julie C, Giraud V, Labrune S, Dumoulin J, Tisserand J, Emile J-F, Blons H, et al. Circulating tumor DNA evaluated by Next-Generation Sequencing is predictive of tumor response and prolonged clinical benefit with nivolumab in advanced non-small cell lung cancer. OncoImmunology. 2018. doi:10.1080/2162402X.2018.1424675.
- Zhang J, Gao J, Li Y, Nie J, Dai L, Hu W, Chen X, Han J, Ma X, Tian G, et al. Circulating PD-L1 in NSCLC patients and the correlation between the level of PD-L1 expression and the clinical characteristics. Thorac Cancer. 2015;6:534–8. doi:10.1111/1759-7714.12247. PMID:26273411.
- Okuma Y, Hosomi Y, Nakahara Y, Watanabe K, Sagawa Y, Homma S. High plasma levels of soluble programmed cell death ligand 1 are prognostic for reduced survival in advanced lung cancer. Lung Cancer Amst Neth. 2017;104:1–6. doi:10.1016/j.lungcan.2016.11.023.
- Zhao J, Zhang P, Wang J, Xi Q, Zhao X, Ji M, Hu G. Plasma levels of soluble programmed death ligand-1 may be associated with overall survival in nonsmall cell lung cancer patients receiving thoracic radiotherapy. Medicine (Baltimore). 2017;96:e6102. doi:10.1097/MD.0000000000006102. PMID:28207525.
- Adam J, Rouquette I, Damotte D, Badoual C, Danel C, Damiola F, Penault-Llorca F, Lantuejoul S. Multicentric French Harmonization Study for PD-L1 IHC Testing in NSCLC. J Thorac Oncol Off Publ Int Assoc Study Lung Cancer. 2017;12 (1s):PL04a.04.
- Trapani JA, Sutton VR. Granzyme B: pro-apoptotic, antiviral and antitumor functions. Curr Opin Immunol. 2003;15:533–43. doi:10.1016/S0952-7915(03)00107-9. PMID:14499262.
- Waterhouse NJ, Sutton VR, Sedelies KA, Ciccone A, Jenkins M, Turner SJ, Bird PI, Trapani JA. Cytotoxic T lymphocyte-induced killing in the absence of granzymes A and B is unique and distinct from both apoptosis and perforin-dependent lysis. J Cell Biol. 2006;173:133–44. doi:10.1083/jcb.200510072. PMID:16606695.
- Tak PP, Spaeny-Dekking L, Kraan MC, Breedveld FC, Froelich CJ, Hack CE. The levels of soluble granzyme A and B are elevated in plasma and synovial fluid of patients with rheumatoid arthritis (RA). Clin Exp Immunol 1999;116:366–70. doi:10.1046/j.1365-2249.1999.00881.x. PMID:10337032.
- Kondo H, Hojo Y, Tsuru R, Nishimura Y, Shimizu H, Takahashi N, Hirose M, Ikemoto T, Ohya K-I, Katsuki T, et al. Elevation of plasma granzyme B levels after acute myocardial infarction. Circ J Off J Jpn Circ Soc. 2009;73:503–7.
- Skjelland M, Michelsen AE, Krohg-Sørensen K, Tennøe B, Dahl A, Bakke S, Brosstad F, Damås JK, Russell D, Halvorsen B, et al. Plasma levels of granzyme B are increased in patients with lipid-rich carotid plaques as determined by echogenicity. Atherosclerosis. 2007;195:e142–146. doi:10.1016/j.atherosclerosis.2007.05.001. PMID:17568588.
- Naidu S, Garofalo M. microRNAs: An Emerging Paradigm in Lung Cancer Chemoresistance. Front Med. 2015;2:77. doi:10.3389/fmed.2015.00077..
- Zhou S, Dong X, Zhang C, Chen X, Zhu J, Li W, Song X, Xu Z, Zhang W, Yang X, et al. MicroRNAs are implicated in the suppression of CD4+CD25− conventional T cell proliferation by CD4+CD25+ regulatory T cells. Mol Immunol. 2015;63:464–72. doi:10.1016/j.molimm.2014.10.001. PMID:25457879.
- Wei J, Nduom EK, Kong L-Y, Hashimoto Y, Xu S, Gabrusiewicz K, Ling X, Huang N, Qiao W, Zhou S, et al. MiR-138 exerts anti-glioma efficacy by targeting immune checkpoints. Neuro-Oncol. 2016;18:639–48. doi:10.1093/neuonc/nov292. PMID:26658052.
- Ali MA, Matboli M, Tarek M, Reda M, Kamal KM, Nouh M, Ashry AM, El-Bab AF, Mesalam HA, Shafei AE-S, et al. Epigenetic regulation of immune checkpoints: another target for cancer immunotherapy? Immunotherapy. 2017;9:99–108. doi:10.2217/imt-2016-0111. PMID:28000527.
- Cioffi M, Trabulo SM, Vallespinos M, Raj D, Kheir TB, Lin M-L, Begum J, Baker A-M, Amgheib A, Saif J, et al. The miR-25-93-106b cluster regulates tumor metastasis and immune evasion via modulation of CXCL12 and PD-L1. Oncotarget. 2017;8:21609–25. doi:10.18632/oncotarget.15450. PMID:28423491.
- Khorrami S, Zavaran Hosseini A, Mowla SJ, Soleimani M, Rakhshani N, Malekzadeh R. MicroRNA-146a induces immune suppression and drug-resistant colorectal cancer cells. Tumour Biol J Int Soc Oncodevelopmental Biol Med. 2017;39:1010428317698365. doi:10.1177/1010428317698365.
- Xu C, Zhang Y, Wang Q, Xu Z, Jiang J, Gao Y, Gao M, Kang J, Wu M, Xiong J, et al. Long non-coding RNA GAS5 controls human embryonic stem cell self-renewal by maintaining NODAL signalling. Nat Commun. 2016;7:13287. doi:10.1038/ncomms13287. PMID:27811843.
- Yee D, Shah KM, Coles MC, Sharp TV, Lagos D. MicroRNA-155 induction via TNF-α and IFN-γ suppresses expression of programmed death ligand-1 (PD-L1) in human primary cells. J Biol Chem. 2017;292:20683–93. doi:10.1074/jbc.M117.809053. PMCID: PMC5733604.
- Cortez MA, Ivan C, Valdecanas D, Wang X, Peltier HJ, Ye Y, Araujo L, Carbone DP, Shilo K, Giri DK, et al. PDL1 Regulation by p53 via miR-34. J Natl Cancer Inst. 2016;108:djv303. doi:10.1093/jnci/djv303. PMID:26577528.
- Zhao L, Yu H, Yi S, Peng X, Su P, Xiao Z, Liu R, Tang A, Li X, Liu F, et al. The tumor suppressor miR-138-5p targets PD-L1 in colorectal cancer. Oncotarget. 2016;7:45370–84. PMID:27248318.
- Zhu J, Chen L, Zou L, Yang P, Wu R, Mao Y, Zhou H, Li R, Wang K, Wang W, et al. MiR-20b, -21, and -130b inhibit PTEN expression resulting in B7-H1 over-expression in advanced colorectal cancer. Hum Immunol. 2014;75:348–53. doi:10.1016/j.humimm.2014.01.006. PMID:24468585.
- Li Q, Johnston N, Zheng X, Wang H, Zhang X, Gao D, Min W. miR-28 modulates exhaustive differentiation of T cells through silencing programmed cell death-1 and regulating cytokine secretion. Oncotarget. 2016;7:53735–50. PMID:27447564.
- Wang X, Li J, Dong K, Lin F, Long M, Ouyang Y, Wei J, Chen X, Weng Y, He T, et al. Tumor suppressor miR-34a targets PD-L1 and functions as a potential immunotherapeutic target in acute myeloid leukemia. Cell Signal. 2015;27:443–52. doi:10.1016/j.cellsig.2014.12.003. PMID:25499621.
- Lv Q-L, Du H, Liu Y-L, Huang Y-T, Wang G-H, Zhang X, Chen S-H, Zhou H-H. Low expression of microRNA-320b correlates with tumorigenesis and unfavorable prognosis in glioma. Oncol Rep. 2017;38:959–66. doi:10.3892/or.2017.5762. PMID:28656255.
- Li Y, Jiang Q, Xia N, Yang H, Hu C. Decreased expression of microRNA-375 in nonsmall cell lung cancer and its clinical significance. J Int Med Res. 2012;40:1662–9. doi:10.1177/030006051204000505. PMID:23206448.
- Chen L-J, Li X-Y, Zhao Y-Q, Liu W-J, Wu H-J, Liu J, Mu X-Q, Wu H-B. Down-regulated microRNA-375 expression as a predictive biomarker in non-small cell lung cancer brain metastasis and its prognostic significance. Pathol Res Pract. 2017;213:882–8. doi:10.1016/j.prp.2017.06.012. PMID:28688608.
- Zou Q, Yi W, Huang J, Fu F, Chen G, Zhong D. MicroRNA-375 targets PAX6 and inhibits the viability, migration and invasion of human breast cancer MCF-7 cells. Exp Ther Med. 2017;14:1198–204. doi:10.3892/etm.2017.4593. PMID:28810579.
- Dai X, Chiang Y, Wang Z, Song Y, Lu C, Gao P, Xu H. Expression levels of microRNA-375 in colorectal carcinoma. Mol Med Rep. 2012;5:1299–304. PMID:22377847.
- Xu L, Li M, Wang M, Yan D, Feng G, An G. The expression of microRNA-375 in plasma and tissue is matched in human colorectal cancer. BMC Cancer. 2014;14:714. doi:10.1186/1471-2407-14-714. PMID:25255814.
- Alam KJ, Mo J-S, Han S-H, Park W-C, Kim H-S, Yun K-J, Chae S-C. MicroRNA 375 regulates proliferation and migration of colon cancer cells by suppressing the CTGF-EGFR signaling pathway. Int J Cancer. 2017;141:1614–29. doi:10.1002/ijc.30861. PMID:28670764.
- Xu L, Wen T, Liu Z, Xu F, Yang L, Liu J, Feng G, An G. MicroRNA-375 suppresses human colorectal cancer metastasis by targeting Frizzled 8. Oncotarget. 2016;7:40644–56. PMID:27276676.
- Lv H, He Z, Wang H, Du T, Pang Z. Differential expression of miR-21 and miR-75 in esophageal carcinoma patients and its clinical implication. Am J Transl Res. 2016;8:3288–98. PMID:27508050.
- Hu C, Lv L, Peng J, Liu D, Wang X, Zhou Y, Huo J. MicroRNA-375 suppresses esophageal cancer cell growth and invasion by repressing metadherin expression. Oncol Lett. 2017;13:4769–75. doi:10.3892/ol.2017.6098. PMID:28599478.
- Lee SW, Park KC, Kim JG, Moon SJ, Kang SB, Lee DS, Sul HJ, Ji JS, Jeong HY. Dysregulation of MicroRNA-196b-5p and MicroRNA-375 in Gastric Cancer. J Gastric Cancer. 2016;16:221–9. doi:10.5230/jgc.2016.16.4.221. PMID:28053808.
- Lian S, Park JS, Xia Y, Nguyen TT, Joo YE, Kim KK, Kim HK, Jung YD. MicroRNA-375 Functions as a Tumor-Suppressor Gene in Gastric Cancer by Targeting Recepteur d'Origine Nantais. Int J Mol Sci. 2016;17:p. 1633. doi:10.3390/ijms17101633.
- Zhou J, Song S, Cen J, Zhu D, Li D, Zhang Z. MicroRNA-375 is downregulated in pancreatic cancer and inhibits cell proliferation in vitro. Oncol Res. 2012;20:197–203. doi:10.3727/096504013X13589503482734. PMID:23581226.
- Song S, Zhou J, He S, Zhu D, Zhang Z, Zhao H, Wang Y, Li D. Expression levels of microRNA-375 in pancreatic cancer. Biomed Rep. 2013;1:393–8. doi:10.3892/br.2013.88. PMID:24648956.
- Cui F, Wang S, Lao I, Zhou C, Kong H, Bayaxi N, Li J, Chen Q, Zhu T, Zhu H. miR-375 inhibits the invasion and metastasis of colorectal cancer via targeting SP1 and regulating EMT-associated genes. Oncol Rep. 2016;36:487–93. doi:10.3892/or.2016.4834. PMID:27222350.
- Yang D, Yan R, Zhang X, Zhu Z, Wang C, Liang C, Zhang X. Deregulation of MicroRNA-375 inhibits cancer proliferation migration and chemosensitivity in pancreatic cancer through the association of HOXB3. Am J Transl Res. 2016;8:1551–9. PMID:27186281.
- Kong KL, Kwong DLW, Chan TH-M, Law SY-K, Chen L, Li Y, Qin Y-R, Guan X-Y. MicroRNA-375 inhibits tumour growth and metastasis in oesophageal squamous cell carcinoma through repressing insulin-like growth factor 1 receptor. Gut. 2012;61:33–42. doi:10.1136/gutjnl-2011-300178. PMID:21813472.
- Liu AM, Poon RTP, Luk JM. MicroRNA-375 targets Hippo-signaling effector YAP in liver cancer and inhibits tumor properties. Biochem Biophys Res Commun. 2010;394:623–7. doi:10.1016/j.bbrc.2010.03.036. PMID:20226166.
- Shao Y, Geng Y, Gu W, Huang J, Ning Z, Pei H. Prognostic significance of microRNA-375 downregulation in solid tumors: a meta-analysis. Dis Markers. 2014;2014:626185. doi:10.1155/2014/626185. PMID:25404787.
- Hu Y, Wang L, Gu J, Qu K, Wang Y. Identification of microRNA differentially expressed in three subtypes of non-small cell lung cancer and in silico functional analysis. Oncotarget. 2017;8:74554–66. PMID:29088807.
- Chen X, Li B, Luo R, Cai S, Zhang C, Cao X. Analysis of the function of microRNA-375 in humans using bioinformatics. Biomed Rep. 2017;6:561–6. doi:10.3892/br.2017.889. PMID:28515914.
- Selth LA, Das R, Townley SL, Coutinho I, Hanson AR, Centenera MM, Stylianou N, Sweeney K, Soekmadji C, Jovanovic L, et al. A ZEB1-miR-375-YAP1 pathway regulates epithelial plasticity in prostate cancer. Oncogene. 2017;36:24–34. doi:10.1038/onc.2016.185. PMID:27270433.
- Spranger S, Gajewski TF. A new paradigm for tumor immune escape: β-catenin-driven immune exclusion. J Immunother Cancer. 2015;3:43. doi:10.1186/s40425-015-0089-6. PMID:26380088.
- Ramos RN, Piaggio E, Romano E. Mechanisms of Resistance to Immune Checkpoint Antibodies. Handb Exp Pharmacol. 2017; doi:10.1007/164_2017_11. PMID:28315073. [Epub ahead of print]
- Moroishi T, Hayashi T, Pan W-W, Fujita Y, Holt MV, Qin J, Carson DA, Guan K-L. The Hippo Pathway Kinases LATS1/2 Suppress Cancer Immunity. Cell. 2016;167:1525–39. e17.
- Siemers NO, Holloway JL, Chang H, Chasalow SD, Ross-MacDonald PB, Voliva CF, Szustakowski JD. Genome-wide association analysis identifies genetic correlates of immune infiltrates in solid tumors. PloS One. 2017;12:e0179726. doi:10.1371/journal.pone.0179726. PMID:28749946.
- Kakavand H, Rawson RV, Pupo GM, Yang JYH, Menzies AM, Carlino MS, Kefford RF, Howle JR, Saw RPM, Thompson JF, et al. PD-L1 Expression and Immune Escape in Melanoma Resistance to MAPK Inhibitors. Clin Cancer Res Off J Am Assoc Cancer Res. 2017;23:6054–61. doi:10.1158/1078-0432.CCR-16-1688..
- Pai SG, Carneiro BA, Mota JM, Costa R, Leite CA, Barroso-Sousa R, Kaplan JB, Chae YK, Giles FJ. Wnt/beta-catenin pathway: modulating anticancer immune response. J Hematol OncolJ Hematol Oncol. 2017;10:101. doi:10.1186/s13045-017-0471-6..
- Massi D, Romano E, Rulli E, Merelli B, Nassini R, De Logu F, Bieche I, Baroni G, Cattaneo L, Xue G, et al. Baseline β-catenin, programmed death-ligand 1 expression and tumour-infiltrating lymphocytes predict response and poor prognosis in BRAF inhibitor-treated melanoma patients. Eur J Cancer Oxf Engl 1990. 2017;78:70–81.
- Wei R, Yang Q, Han B, Li Y, Yao K, Yang X, Chen Z, Yang S, Zhou J, Li M, et al. microRNA-375 inhibits colorectal cancer cells proliferation by downregulating JAK2/STAT3 and MAP3K8/ERK signaling pathways. Oncotarget. 2017;8:16633–41. PMID:28186962.
- Wang J, Huang H, Wang C, Liu X, Hu F, Liu M. MicroRNA-375 sensitizes tumour necrosis factor-alpha (TNF-α)-induced apoptosis in head and neck squamous cell carcinoma in vitro. Int J Oral Maxillofac Surg. 2013;42:949–55. doi:10.1016/j.ijom.2013.04.016. PMID:23726271.
- Robinson MD, Oshlack A. A scaling normalization method for differential expression analysis of RNA-seq data. Genome Biol. 2010;11:R25. doi:10.1186/gb-2010-11-3-r25. PMID:20196867.
- Robinson MD, McCarthy DJ, Smyth GK. edgeR: a Bioconductor package for differential expression analysis of digital gene expression data. Bioinformatics. 2010;26:139–40. doi:10.1093/bioinformatics/btp616. PMID:19910308.
- McCarthy DJ, Chen Y, Smyth GK. Differential expression analysis of multifactor RNA-Seq experiments with respect to biological variation. Nucleic Acids Res. 2012;40:4288–97. doi:10.1093/nar/gks042. PMID:22287627.
- Ru Y, Kechris KJ, Tabakoff B, Hoffman P, Radcliffe RA, Bowler R, Mahaffey S, Rossi S, Calin GA, Bemis L, et al. The multiMiR R package and database: integration of microRNA–target interactions along with their disease and drug associations. Nucleic Acids Res. 2014;42:e133−e133. doi:10.1093/nar/gku631. PMID:25063298.