
ABSTRACT
A high concentration of circulating vascular endothelial growth factor (VEGF) in cancer patients is associated with an aggressive tumor phenotype. Here, serum levels of 27 cytokines and blood cell counts were assessed in breast cancer patients receiving neoadjuvant chemotherapy with or without bevacizumab (Bev) in a randomized cohort of 132 patients with non-metastatic HER2-negative tumors. Cytokine levels were determined prior to treatment and at various time-points. The cytotoxic chemotherapy regimen of fluorouracil, epirubicin, and cyclophosphamide (FEC) had a profound impact on both circulating white blood cells and circulating cytokine levels. At the end of FEC treatment, the global decrease in cytokine levels correlated with the drop in white blood cell counts and was significantly greater in the patients of the Bev arm for cytokines, such as VEGF-A, IL-12, IP-10 and IL-10. Among patients who received Bev, those with pathological complete response (pCR) exhibited significantly lower levels of VEGF-A, IFN-γ, TNF-α and IL-4 than patients without pCR. This effect was not observed in the chemotherapy-only arm. Certain circulating cytokine profiles were found to correlate with different immune cell types at the tumor site. For the Bev arm patients, the serum cytokine levels correlated with higher levels of cytotoxic T cells at the end of the therapy regimen, which was indicative of treatment response. The higher response rate for Bev-treated patients and stronger correlations between serum cytokine levels and infiltrating CD8T cells merits further investigation.
Introduction
The tumor microenvironment considerably influences tumor progression and clinical outcome.Citation1 Immune cell infiltration has been associated with disease progression, estrogen receptor (ER) activity, and genomic complexity in breast cancer patients.Citation2 We and others have further demonstrated that immune responses in breast adenocarcinoma and adjacent normal tissue are dependent on patient age and estrogen availability.Citation3 Characterizing the relationship between a tumor and its microenvironment will increase our understanding of cancer pathogenesis.Citation4
Analyses of interactions between tumor cells and the immune system may have prognostic value in the assessment of patient survival and treatment response.Citation5 However, it remains challenging to accurately measure the extent of immune cell infiltration into a tumor. In addition, immune cells can mediate both pro-tumorigenic and anti-tumorigenic effects.Citation6,Citation7
Factors secreted by stromal, immune, and/or tumor cells may affect the composition of a patient's serum. As such, these factors may represent interesting targets in the detection of cancers or in the monitoring of pathogenesis. Cytokines and chemokines are small molecules (10–30 kDa) which regulate the development, maturation, localization, interactions, activation, and life span of immune cells.Citation8-10 Furthermore, cytokines play an essential role in regulating both adaptive and innate immunity. It was recently demonstrated that assays which facilitate a multiplex format and high-throughput analysis of cytokine concentrations in biomaterials, such as those that employ Luminex technology, can help monitor the immune system and provide exceptional insight into disease pathogenesis and immunity.Citation11
Vascular endothelial growth factor type A (VEGF-A) is a key cytokine produced by both normal cells and tumor cells and it regulates angiogenesis, as well as vascular permeability, by activating two receptors: VEGFR-1 and VEGFR-2.Citation12,Citation13 Both receptors are present on the plasma membrane of endothelial cells and their expression is regulated by hypoxia.Citation14
In the serum of cancer patients, including breast cancer patients, a marked increase in VEGF-A and its receptors' levels has been found to be an indicator of poor prognosis.Citation15,Citation16 Therefore, it has been proposed that targeting of VEGF-driven angiogenesis in combination with standard chemotherapy in a neoadjuvant setting may improve patients' prognosis.Citation17 Recently, two trials using bevacizumab (Bev): MERiDiAN and GeparQuinto investigated whether plasma level of VEGF-A or SNPs in VEGF-A pathway may be predictive biomarkers for Bev efficacy in breast cancer.Citation18,Citation19 However, the overall benefit of such a combinatorial therapy has been difficult to interpret due to variability in patients' treatment response.Citation18,Citation20-23 For example, the NSABP B49 trial found that Bev significantly increased overall survival of patient with advanced HER2-non-amplified invasive breast adenocarcinoma.Citation24 While, the GeparQuinto trial studies reported that for HER2 negative breast tumors, Bev improved pathological complete response (pCR) but not disease-free survival.Citation25-27
Consequently, a defined need exists for the identification of markers which can help predict and improve our understanding of patient response to antiangiogenic therapy. It has been observed that antiangiogenic therapy affects the immune system and endothelial cell migration,Citation12,Citation28 as well as plasma levels of cytokines, including IL-10 and transforming growth factor (TGF)-β.Citation28,Citation29
Using Luminex technology, we systematically assessed the levels of 27 cytokines and chemokines in the serum of breast cancer patients in a randomized phase II neoadjuvant trial. This trial compared response to treatment with chemotherapy in combination with or without Avastin (bevacizumab (Bev); Neo-Ava; ClinicalTrials.gov: NCT00773695).Citation30 We measured serum cytokine levels at diagnosis, during surgery, and at key time points during each treatment course. These data were analyzed according to clinical parameters such as treatment type and patient response. In addition, cytokine concentrations were correlated to the counts of circulating white blood cells (WBCs) and cells inferred to be infiltrating immune cells.
Results
Cytokine co-expression during therapy
Serum levels of 27 cytokines were measured in breast cancer patients at four time points during a neoadjuvant clinical trial (chemotherapy with or without Bev).
Initially, a co-expression analysis was performed on the measured cytokines. Heatmaps for Spearman rank correlations were generated to visualize the degree of cytokine association at each time point (). Independent of treatment arm, groups of cytokines were found to be highly correlated in the serum of breast cancer patients at each time point (). Co-expression between cytokines may indicate a common role for these cytokines in regulating inflammatory and immune responses.
Figure 1. Co-expression of 27 cytokines in the serum of breast cancer patients during therapy. Correlation heatmaps assess the strength of correlation between the 27 cytokines measured by the Luminex assay. Correlations are assessed by Spearman rank test, only significant correlations (Bonferroni corrected P < 0.05) are shown. An initial correlation heatmap included cytokine levels is shown for all samples at screening (A, n = 88). Both arms of the randomized control trial are represented: left panel: chemotherapy, right panel: Combination (+ Bev) arm at the different time points of measurement, (A, week zero) pre-treatment; (B & C, week 12, n = 41 and 44) after FEC therapy; (D & E, week 25, n = 40 and 40) after taxane; and (F & G, week 31, n = 45 and 45) six weeks after surgery
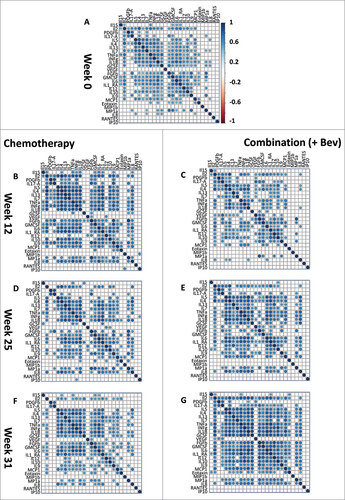
In the combination treatment arm (e.g. chemotherapy + Bev), the number of significant (Bonferroni corrected) correlations between the 27 cytokines decreased between screening: (n = 160) and 12 weeks (n = 128). Then in the Bev arm, the numbers of significant correlations gradually increased (12 weeks: 128, 25 weeks: 157, 31 weeks: 205). By week 25, 21 out of 27 cytokines were significantly correlated (). At week 31 (6 weeks after therapy), correlations among the 27 cytokines remained high in this arm (). These results indicate that Bev therapy may have profound effects on the immune system and cytokine levels.
In the chemotherapy-only arm, we observed a different behavior of cytokine correlations during treatment: the number of significant inter-correlations (Bonferroni corrected) increased from week 0 to week 12 (, and ; screening (n = 128), 12 weeks (n = 179) and then decreased between 12 (n = 179) and 25 weeks (n = 146). These results further suggest that remodeling of the immune system occurred in response to the cytotoxic effects of FEC therapy within the first 12 weeks of treatment and may be affected by addition of Bev.
Overall, the co-expression analysis of serum cytokine levels suggests that FEC treatment reshaped the immune response by the end of the 12-week treatment regimen. Furthermore, these effects were more prominent in the patient group receiving Bev, as demonstrated by the continuously increased cytokine co-expression up until week 31.
Changes in cytokine levels at two successive time points
To assess changes in cytokine levels according to chemotherapy type, differences between cytokine levels at two successive time points were examined ( and ).
Figure 2. Changes in serum cytokine levels between two consecutive time points. Differences in cytokine levels between two successive time points are presented as barplots in both treatment arms, (A) Differences between 0 and 12 weeks, n = 85, (B) between 12 and 25 weeks n = 80, (C) between 25 and 31 weeks, n = 80. Error bars represent ± 1 standard deviation. # P < 0.05 (FDR adjusted P < 0.1), t-test showing significant differences of cytokine levels between two time points independently of the treatment arm
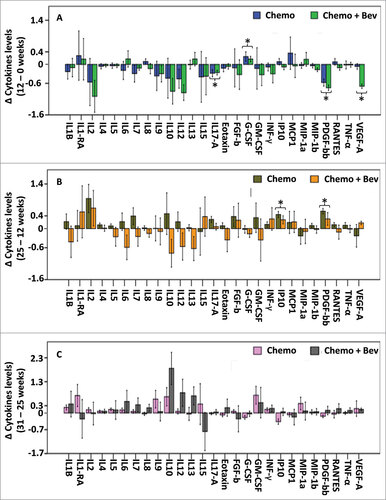
Table 1. One-way ANOVA to compare log cytokine levels between time points of treatment, independent of treatment arm (F-tests). Cytokines with FDR-adjusted p-value<0.1 in the global three-way ANOVA with time points, treatment arm and treatment response as factors (and TNF-alpha in addition) are highlighted. Only these highlighted cytokines are investigated further in post-hoc tests, if the ANOVA F-test was significant (p < 0.05)
Between the initial time point (screening) and 12 weeks after FEC ± Bev, the levels of most of the cytokines examined decreased in both treatment arms. Most notably, when considering samples from both arms, IL-17A and PDGF-BB concentrations significantly decreased (P = 0.014 and P < 0.001 respectively; and ). Levels of VEGF-A also decreased when considering samples from both arms (P = 0.022, and ), yet this result is driven by the important decrease in VEGF-A in the combination (Bev) arm of treatment. In general, the decrease in cytokine levels after FEC administration may reflect a global loss of circulating leukocytes.
While the levels of most of the cytokines decreased in both treatment arms during the first treatment period (i.e. between 0 and 12 weeks), after treatment with taxane ± Bev (between 12 and 25 weeks), PDGF-BB and IP-10 levels increased in both arms (P = 0.001 and P < 0.001 respectively; and ). In addition, treatment-arm specific variations in cytokines levels were observed during the second treatment course.
Six weeks after the completion of neoadjuvant treatment (i.e. between weeks 25 and 31), the levels of IL-10 increased in both treatment arms (P = 0.055, and ).
Blood cell counts during treatment
These initial results led us to hypothesize that the global decrease in serum cytokine levels observed at 12 weeks was due to the cytotoxic effects of FEC chemotherapy on immune cells. Hence, we assessed the changes in blood cell counts. Circulating white blood cells (WBCs) and neutrophil counts significantly decreased between the initial screening and the end of therapy at 25 weeks (, and , respectively). In contrast, platelet counts increased between week 0 and week 12, and then decreased between weeks 12 and 25 (). Similar observations were made when the patients were subdivided according to treatment arm or response to treatment (Supplementary Fig. 2). To further investigate the relationship between circulating immune cells and serum cytokines, we correlated serum cytokine levels and blood cell counts across all patients within a treatment arm and at a given time point. At the initial screening, no or negative correlations were observed between cytokine levels and blood cell counts (). In contrast, significant positive correlations were observed between WBC and cytokine levels at 12 weeks in both treatment arms (), suggesting that the decrease in both WBC and cytokine levels between 0 and 12 weeks could be interrelated. After 25 weeks of treatment, different patterns of correlations between WBCs and cytokines were observed according to treatment arm, which suggests that a global depletion of WBCs because of FEC administration was followed by further reshaping of the immune response during taxane treatment.
Figure 3. Effects of treatments on blood cell counts and correlation with cytokines levels. Comparison of the blood cell counts (109 per liter): white blood cells (WBC, A), neutrophils (Neutro, B) and platelets (C), at the different time points of treatment. # indicates t-test P < 0.01 between two successive time points, error bars represent standard deviation. Heatmap showing Spearman rank correlations between cytokine levels and blood cell counts at screening n = 98, (D), 12 weeks, (n = 44, Bev; n = 41, Chemo) (E) and 25 weeks (n = 40, Bev; n = 40, Chemo) (F). All correlations are shown independently of p values. Heatmaps were obtained using the pheatmap R package
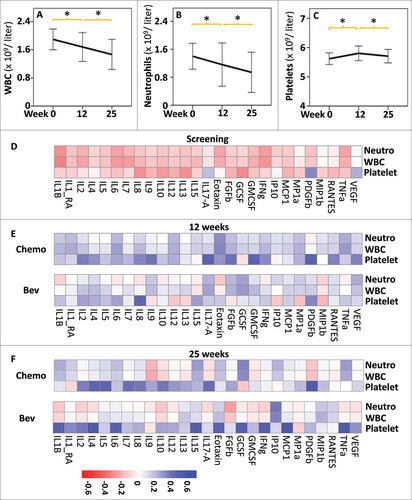
Taken together, these results indicate that FEC chemotherapy drastically decreased the counts of circulating leukocytes in the cohort examined, affecting cytokine levels.
Effect of Bev on serum cytokine levels
We next wanted to test the hypothesis that Bev may induce specific changes in cytokine levels ().
Table 2. Two-way ANOVA to compare log cytokine levels between the two arms of treatment across all four time-points (F-tests). Cytokines with FDR-adjusted p-value<0.1 in the global three-way ANOVA with time points, treatment arm and treatment response as factors (and TNF-alpha in addition) are highlighted. Only these highlighted cytokines are investigated further in subgroup analyses, if the ANOVA F-test was significant (p<0.05)
Administration of Bev was associated with a significant decrease in the levels of VEGF-A at 12 and 31 weeks (P < 0.001 and P = 0.008 respectively; and ). A concomitant significant decrease in IL-12 levels was also observed (week12, P = 0.041, week 25, P = 0.002 and week 31, P = 0.01, and ), suggesting that the decrease in VEGF-A may directly influence the level of IL-12. In addition, levels of IP-10 (CXCL10), a cytokine involved in the chemoattraction of monocytes/macrophages, cytotoxic T cells, natural killer (NK) cells, and dendritic cells, as well as the levels of IL-10, an anti-inflammatory cytokine, both had significantly lower levels at week 25 in the serum of patients treated with Bev compared to patients without Bev treatment (P = 0.023, ; P = 0.028, respectively and ). Lower serum levels of IL-4 and IL-5 were also detected during the treatment course of Bev-treated patients (ANOVA P = 0.013 and P = 0.033 respectively; Supplementary Fig. 3 and Table 2).
Figure 4. Effect of Bevacizumab on serum cytokines levels. Cytokine serum levels were assessed in the two treatment arms: chemotherapy (blue), chemotherapy + Bev (green), and at four different time points, 0, 12, 25 and 31 weeks. To find the most relevant and significant differences between the two arms, we first tested for global differences using ANOVA (), and only for the significant values showing a significant result in the global three-way ANOVA (FDR-adjusted P < 0.1) (and TNF-alpha) further tested for significant difference at each time point using t-test. For (A) VEGF-A, (B) IL-12, (C) IP-10, and (D) IL-10, we found a global difference between their levels when comparing the two arms (ANOVA P < 0.05) and further identified significant differences at the indicated time points: # P < 0.05, ## P < 0.01, ### P < 0.001. Error bars represent ± 1 standard deviation
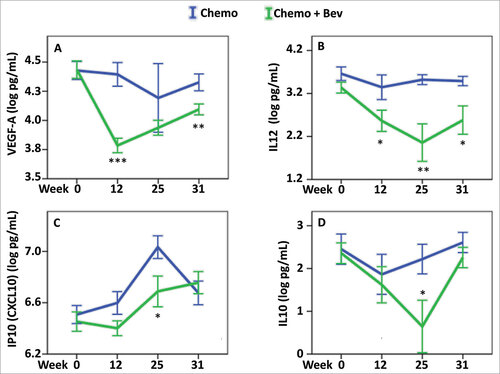
Overall, these results indicate that combination therapy with Bev, in addition to the obligate decrease in VEGF-A serum levels can have important repercussions on systemic levels of other cytokines, which may be involved in angiogenesis and/or the immune response.
Bev, serum cytokine levels, and pCR
The addition of Bev to neoadjuvant treatment increased the fraction of patients exhibiting pCR from 12% to 26%.Citation30 In patients with pCR, a number of serum cytokines had lower global levels than those in non-PCR (ANOVA < 0.05, all time points considered together) ( and Supplementary Fig. 4). When stratified by treatment arm the levels of six cytokines (VEGF-A, IL-17A, IFN-γ, TNF-α, IL-4, and IL-5) were globally lower in the serum of Bev-treated patients who responded to treatment (ANOVA < 0.05, , and Supplementary Fig. 5). Moreover, the levels of these cytokines were predictive to response only in the Bev arm. Lower levels of VEGF-A in the serum of Bev-treated patients at week 12 after FEC were associated with pCR (). Similarly, other cytokines exhibited a decrease in their levels at week 12 after FEC, and these included: IL-17A, an inducer of inflammatory and angiogenic growth factor productionCitation31; INF-γ and TNF-α, markers of TH1 activity; and IL-4, a regulator of TH2 activity Supplementary Figure 5D and Fig. 5 D, F, H. Furthermore, lower levels of TNF-α and IL-4 were detected at week 25 after taxane treatment (, CitationF and CitationH).
Table 3. ANOVA to compare log cytokine levels between pathological complete response (pCR) groups, for both treatment arms, as well as within each arm separately, across four time-points. Cytokines with FDR-adjusted p-value<0.1 in the global three-way ANOVA with time points, treatment arm and treatment response as factors (and TNF-alpha in addition) are highlighted. Only these highlighted cytokines are investigated further in subgroup and post-hoc tests, if the ANOVA F-test for pCR in both arms was significant (p<0.05)
Figure 5. Cytokine levels associated with pathological complete response. Cytokine levels were assessed in the patients with pathological complete response in both treatment arms: chemotherapy (left panel) and combination arm (right panel). To find the most relevant and significant differences between responders and non-responders, we first tested for global differences using ANOVA () and only for the significant values (ANOVA P < 0.05) that also showed a significant result in the global three-way ANOVA (FDR-adjusted P < 0.1) (and TNF-alpha), we further tested for significant difference at each time point using t-test. (A & B) VEGF-A, (C & D) IFN-γ, (E & F) TNF-α and (G & H) IL4, we found a global difference between responders and non-responders in the combination arm (ANOVA P < 0.05) and further identified significant differences at the indicated time points. # P < 0.05, ## P < 0.01. Error bars represent ± 1 standard deviation
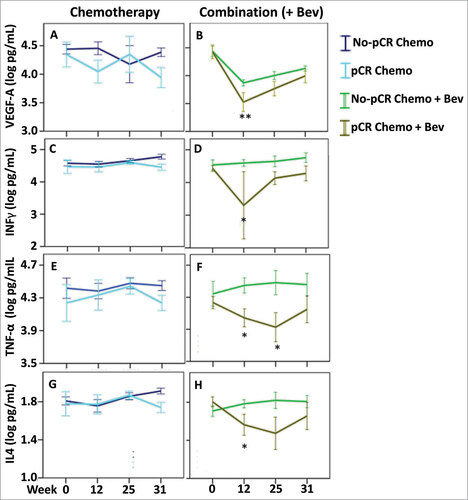
These results indicate that several cytokines had serum levels associated with treatment response in the Bev arm. Furthermore, lower levels of VEGF-A, and possibly other related cytokines, at week 12 may predict treatment response in Bev-treated patients.
Effect of Bev on intratumoral immune infiltration and its correlation to circulating cytokine levels
To further investigate the possible mechanisms by which Bev, in combination with chemotherapy, could induce a better patient response, we assessed whether the observed changes in cytokine levels correlated with immune cell infiltration of tumors. Using expression dataCitation30 and the algorithm, CIBERSORT, we inferred the extent of immune cell infiltration in the tumor at the initial screening and at weeks 12 and 25 in both treatment arms (Supplementary Table 3). CIBERSORT is able to predict the relative proportions of 22 types of immune cells by using a set of 547 reference gene expression values obtained from bulk tumor samples.Citation32 We then assessed the correlations between the measured serum levels of the 27 cytokines and the relative immune cell infiltration at each time point with Spearman rank correlation heatmaps (Supplementary Fig. 6).
At week 12, specific correlations appeared to differ between the treatment arms. For example, in the chemotherapy arm, a pattern of significant correlations between the cytokines examined and naïve CD4+ T cells as well as B naïve and memory cells was observed, whereas in the Bev arms, most of the significant correlations identified were associated with the levels of M0 macrophages. On the overall, comparing the average of the significant correlations between the two arms remained insignificant (P = 0.31) at this time point (week 12).
At week 25, however, the correlation heatmaps greatly differed, the average of the significant correlations between the two treatment arms (P < 0.001), indicating that Bev therapy has a profound effect on the immune system in association with cytokine levels. Most notably only for the Bev-treated patients, increased correlations between several cytokines and CD8+ cytotoxic T cells or T follicular helper cells were observed at week 25 (Supplementary Fig. 6).
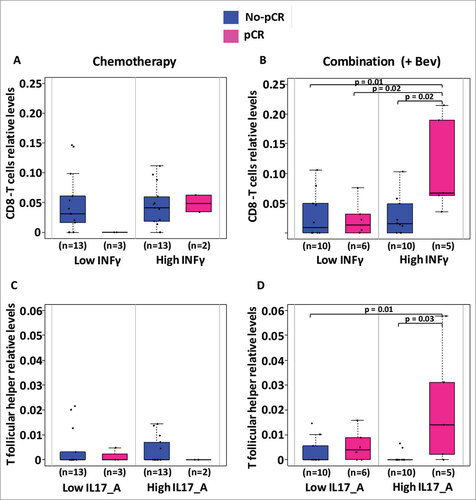
Considering the increased positive correlations observed between the cytokines examined and cytotoxic T cells or the negative correlations between cytokines and T follicular helper within the Bev-treated patients, we hypothesized that infiltration of cytotoxic T cells or T follicular helper cells may facilitate the treatment response in the Bev arm. Correspondingly, the Bev-treated patients that exhibited pCR had higher levels of cytotoxic T cells at weeks 12 and 25 at their tumor sites (P = 0.07 and P = 0.06, respectively; ). Responders in the Bev arms also exhibited higher levels of T follicular helper cells at 25 weeks, which may also contribute to complete response (). Furthermore, at week 25, responders who received Bev, had their levels of INF-γ in their serum associated with higher infiltration in CD8 cytotoxic T cells as well as serum levels of IL-17A associated to higher infiltration of T follicular helper cells in their tumor ().
Figure 6. Levels of CD8T and T follicular helper cells according to response and treatment. Levels of infiltrating CD8T cells and T follicular helper cells were inferred using CIBERSORT and expression levels. In both treatment arms levels of CD8T cells and T follicular helper are plotted at the different time points (screening, 12 and 25 weeks). The global levels of CD8 and follicular T cells appeared significantly different only in the combination (+Bev) arm (ANOVA P < 0.001 in both cases)
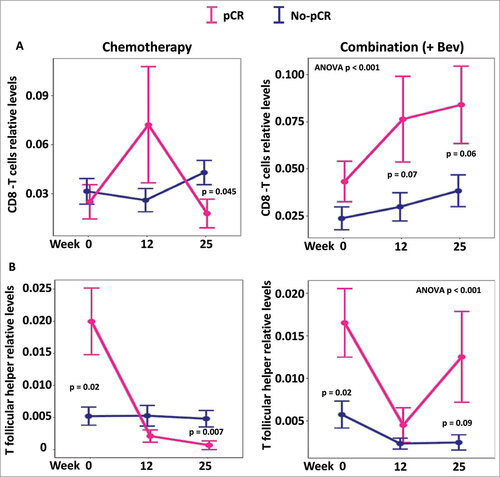
Figure 7. Levels of CD8T cells and T follicular helper cells according to levels of INF-γ and IL-17A. Levels of infiltrating CD8T cells and T follicular helper cells inferred using CIBERSORT were analyzed in regard to the circulating levels of INF-γ and IL-17A respectively. In each treatment arm, we divided patients for having low or high levels of circulating cytokines according to the median level of cytokine and further assessed for differences in infiltrating CD8T or T follicular helper cells. Only significant Students t-test p-values (P < 0.05) are depicted
Discussion
In the present cohort,Citation30 treatment with bevacizumab increased the number of patients with complete response in breast and axillary nodes from 8 patients (12%) to 15 patients (23%).Citation30 Results of the present study suggest that a certain threshold of VEGF-A inhibition in serum is necessary for Bev therapy to be effective in breast cancer (). For other types of cancer, such as small cell lung cancer, low serum levels of VEGF also correlated with better survival.Citation33 In addition, Hyodo et al. reported that gastrointestinal cancer patients with lower pretreatment plasma levels of VEGF exhibited better response to treatment.Citation34 The results of the present study further suggest that targeted depletion of VEGF-A by Bev influenced the serum levels of other cytokines, and a greater correlation was observed among cytokines in the Bev arm during the treatment course (). Interestingly, low levels of TNF-α were also associated with treatment response in the Bev-treated patients. TNF-α induces VEGF-A production and can trigger metastasis through inflammatory pathways.Citation35,Citation36 Further studies are needed to confirm these findings and to investigate a possible correlation.
In Silwal-Pandit et al., we reported the association of hormone receptor status (ER status) to pCR: of the 132 patients, 23 (17%) achieved pCR. Among the estrogen receptor–positive patients, 11 of 54 (20%) treated with bevacizumab and chemotherapy achieved pCR, while in the arm treated with chemotherapy only 3 of 57 (5%) reached pCR.Citation30 We also recently showed that cytokine levels in the tumor interstitium were associated with breast tumor subtype,Citation37 it is therefore conceivable that ER status may influence the results described here. However, in the present study, there were only few ER negative samples, eight in the chemotherapy only arm and ten in the Bev arm, which did not allow to assess thoroughly the effect of the ER status on cytokine serum levels. The number of ER negative patients achieving pCR in each arm is even lower and ER status specific analysis underpowered.
The levels of 27 cytokines in serum during neoadjuvant chemotherapy with or without concomitant bevacizumab are reported here. In the assessment of a breast cancer patient cohort randomized for chemotherapy with or without the humanized anti-VEGF monoclonal antibody, Bev, serum levels of VEGF-A were observed to decrease significantly following treatment with Bev. The decrease in circulating levels of VEGF-A was most significant after 12 weeks of FEC therapy and was most prominent in patients, which exhibited good treatment response. Moreover, these effects were sustained for at least six weeks after the therapy ended.
Levels of IL-12 also decreased in the Bev arm at weeks 12 and 25. IL-12 is mainly secreted by activated B cells, macrophages, and other antigen presenting cells of myeloid and lymphoid origin.Citation38 Subsets of CD49d+ pro-inflammatory leukocytes also produce IL-12 and express both VEGFR1 and VEGFR2.Citation39-41 Bev-induced depletion of VEGF-A may directly affect the function and production of such cells causing decreased production of IL-12. IL-12 can act as a suppressor of angiogenic activity of VEGF.Citation42,Citation43 In the present study, the patients exhibiting good response in the Bev arm concomitantly exhibited reductions in levels of IL-12, IFN-γ, and VEGF-A. These results suggest that the interaction of VEGF-A with IL-12 and IFN-γ, as well as their effect on IP-10 (CXCL10) should be examined in future studies of resistance to antiangiogenic treatment.
Levels of IL-17A and PDGF-BB were highly correlated in both treatment arms, and these correlations were stronger after the second line of treatment that combined taxane with Bev. IL-17A is a hallmark of Th17 immunoactivity and is a pro-inflammatory cytokine which triggers the release of inflammatory and angiogenic growth factors.Citation31,Citation35,Citation44 PDGF-BB has two subunits and binds to PDGF receptor beta to activate the mTOR/JAK/STAT pathway and initiate cell growth and proliferation.Citation45,Citation46 Here, FEC affected the levels of both inflammatory cytokines and growth factors concomitant with significant reductions in blood levels of IL-17A and PDGF-BB. High levels of IL-17A have previously been associated with resistance to anti-VEGF therapy,Citation47 with induction of VEGF-A productionCitation35 leading to induction of PDGF-BB, and both molecules synergistically promoting neo-angiogenesis.Citation31,Citation48,Citation49 In the present study, patients achieving pCR in the Bev arm had significantly lower serum levels of IL-17A at 12 weeks after FEC administration, and these levels remained lower up to 31 weeks after the start of treatment. These results indicate that counteracting the effects of IL-17A during anti-angiogenesis therapy may also increase treatment response.
The serum levels of PDGF-BB, IL-17A, and IP-10, which decreased at week 12 () were increased again at week 25 (, marked with #). IP-10 recruits cytotoxic T cells and NK cells, which express a receptor for IP-10, CXCR3.Citation50-53 Therefore, the induction of higher levels of IP-10 may account for the observed increase in levels of CD8+ T cells that were found in the Bev-responsive tumors.
Paclitaxel, the chemotherapy used in the second stage of treatment in this study, has been shown to inhibit mitosis by affecting microtubule dynamics.Citation54 The administration of taxane has also been reported to increase T-cell blastogenesis and NK cell cytotoxicity.Citation55 Consistent with the present findings, another study recently reported that paclitaxel upregulates IP-10.Citation56 Based on these observations, it is possible that higher levels of inflammatory cytokines and greater NK cell invasion as a result of taxane administration may result in greater immune related toxicity/ adverse events.Citation55-57
TH2 related cytokines stimulate antibody production and may also activate eosinophils and inhibit macrophages.Citation58 In the current study, the TH2 related cytokines, IL-4 and IL-5, remained at stable levels or were present at lower levels after treatment with taxane in the Bev arm. It has been hypothesized that a TH2 dominant immune response at a tumor site can stop tumor rejection and/or promote factors involved in tumor recurrence.Citation59 Consistent with this concept, a decrease in IL-4 and IL-5 levels was observed in the serum of patients achieving pCR.
IFN-γ and TNF-α polarize mesenchyme stromal cells into TH1 type cells.Citation60 In addition, IFN-γ enhances IL-12 expression, and vice versa.Citation58 Lower levels of IL-12 between weeks 12 and 25 affected IFN-γ production by TH1, and this correlation continued to be observed up to week 31. TH1 cells activate macrophages and phagocytes, and these interactions mediate phagocyte-dependent immune responses.Citation61 Consequently, it is hypothesized that TH1-mediated immunity leads to tumor rejection.Citation59
The results of the present study suggest that cytotoxic therapy radically affects WBC counts, and this facilitates a remodeling of the immune system to enhance treatment response by an increase in cytotoxic T cell infiltration to a tumor site. The current assessment further demonstrates that complex interactions within the immune system may influence the levels of various cytokines. It is important to recognize that the pro-inflammatory agents and growth factors that were examined in this study may be produced by epithelial, endothelial, stromal, and/or hematopoietic cells, as well as by cancers cells. Additional studies are needed to understand the interactions between the cytokines examined, especially regarding the interplay between IL-12 and VEGF-A which was identified in this study.
In the present cohort, the administration of bevacizumab in combination with chemotherapy suppressed levels of VEGF-A as well as levels of functionally related cytokines, particularly IL-12. Furthermore, patients who achieved pCR in the Bev treatment arm had lower serum concentrations of VEGF-A, as well as lower serum concentrations of cytokines previously shown to regulate adaptive immunity, including IFN-γ, TNF-α, IL-4, and IP-10. In contrast, expression data indicated an increase in CD8T cells at the tumor site. Here we demonstrate the potential for cytokine level monitoring during treatment to contribute to treatment decisions in breast cancer. These results will require confirmation in a separate cohort of patients in another clinical trial.
Materials and methods
Patient material
Patients with large primary breast tumors (≥ 2.5 cm) (T2–T4) were recruited between November 2008 and July 2012 at Oslo University Hospital or St. Olav's Hospital, Trondheim. The few patients who received hormonal therapy in the trial were excluded from this sub-study. The trial was approved by our institutional protocol review board, the regional ethics committee, the Norwegian Medicines Agency, and carried out in accordance with the Declaration of Helsinki, International Conference on Harmony/Good Clinical practice. The study is registered at http://www.ClinicalTrials.gov/ database with the identifier NCT00773695. Available blood/ serum samples were collected: prior to treatment (screening: SC, week 0), after 4 cycles of FEC regimen (at 12 weeks from the beginning of chemotherapy), after subsequent 4 cycles of taxane therapy (week 25 from start of chemotherapy) and at 6 weeks after the end of chemotherapy (week 31, also corresponding to the time of surgery). WBC, neutrophil, and platelet counts were recorded at the same time points at week 0, 12 and 25.
A block randomization procedure was used, and the randomization was performed by the centralized research support facility at Oslo University Hospital. The randomization list was not known to the personnel responsible for providing information or treatment to the patients. The patients were stratified based on their tumor size (2.5 ≤ T ≤ 5 cm, T > 5 cm) and hormone receptor status (positive for estrogen (ER), progesterone, or both), and randomized 1:1 to receive bevacizumab and chemotherapy (combination-therapy arm) or chemotherapy alone (chemotherapy arm). Of the 138 patients treated with chemotherapy, 66 in each group were included in the primary efficacy analysis.Citation30 The findings and results for pCR relative to hormonal status are included in the recent study, and therefore not included here.Citation30
Treatment
A total of 132 breast cancer cases were included in the trial, of these, serum was available for 98 patients. Patients were randomized to treatment with (n = 50) or without Bev (n = 48), Supplementary Table 1. Between 0 and 12 weeks, patients received chemotherapy: 5-fluorouracil (FEC; 600 mg/m2), epirubicin (100 mg/m2), and cyclophosphamide (600 mg/m2) three times (every third week). Over the next 12 weeks, patients received taxane (100 mg/m2 docetaxel every third week or 80 mg/m2 paclitaxel weekly). Response to treatment was evaluated at time of surgery based on a histopathological assessment of the remaining tumor. Pathological complete response (pCR), herein defined as complete eradication of all invasive cancer cells in both breast and axillary lymph nodes (at time of surgery), was the primary end point. Patients were then categorized as pathological complete responders (pCR) (n = 20), incomplete responders or non-responders (No-pCR) (n = 78). Of the 20 complete responders, 14 were in the Bev arm. Of the 78 non-responders, 36 were in the Bev arm and 42 in the Chemo arm. Tumor measurement prior to treatment was determined based on magnetic resonance imaging, ultrasound, and mammography, MR measurements were used if available for the patient, and otherwise the largest measurement of either mammography or ultrasound were recorded and used.
Granulocyte colony-stimulating factor (G-CSF; 6 mg/dose) was administered to 33 patients (Supplementary Table 1) suffering from neutropenia during the first 12 weeks of therapy, with by mean 3–4 injections performed over these 12-weeks period. Detailed treatment information, side effects, and response have previously been published.Citation30 Since G-CSF was administered mostly between 0 and 12 weeks, specific changes in cytokine levels induced by G-CSF were monitored at the start and end of the 12-week period (Supplementary Fig. 1). No significant changes in cytokine levels were detected between the groups of patients receiving G-CSF. However, as some patients received G-CSF the results concerning G-CSF are only discussed here.
Cytokine measurements
A total of 27 molecules (Supplementary Table 2), including interleukins, chemokines, growth factors, interferon (IFN), and tumor necrosis factor (TNF), were measured in a 27-plex commercially available cytokine panel from Bio-Rad and were analyzed with the Luminex xMAP 200 platform. The assays included a series of known concentrations to generate standard curves. The results obtained were collected and processed with Bio-Plex Manager 6.0 (Bio-Rad). Supplementary Table 2 lists the log transformed cytokine levels for all of the patients examined at all of the time points assayed.
Inferred infiltrating immune cells
Normalized gene expression dataCitation30 was available for 132 patients from the NeoAva trial, of whom 88 patients had also serum cytokine levels. These were used to infer the relative proportions of 22 types of infiltrating immune cells using CIBERSORT, a deconvolution algorithm that uses a set of reference gene expression values (547 genes) to predict 22 immune cell type proportions from bulk tumor sample expression data by using support vector regression.Citation32 To assess the reliability of the deconvolution method, CIBERSORT derives a P-value for each sample. CIBERSORT algorithm was dowloaded at [http://cibersort.stanford.edu/], analyses were performed by using the default signature matrix at 1000 permutations. Output of this CIBERSORT analysis is provided in Supplementary Table 3.
Statistical analysis
Statistical analyses done (after natural log transformations of cytokines levels) were performed with IBM SPSS Statistics 22 or R version 3.3.2. Three-way analysis of variance (ANOVA) was performed with time points, treatment arm, and treatment response as factors to identify cytokines with global significant differences in log cytokine expression levels for any of the factors (the results are repeatedly shown in –, respectively, to highlight that only cytokines with global significant differences according to the three-way ANOVA are considered further in post-hoc and sub-group analyses). P-values were adjusted for multiple testing by controlling the false discovery rate (FDR) according to the method of Benjamini-Hochberg.Citation62 FDR-corrected p-values less than 0.1 were considered significant.
Following the global three-way ANOVA, individual factors were further analyzed with ANOVA analyses – followed by t-tests for sub-group analyses and for post-hoc two-group comparisons (if appropriate) corrected for multiple testing by Bonferroni – to investigate significant global differences in cytokine levels: (i) between all four time-points (one-way ANOVA; ), (ii) between the two arms of treatment at all four time-points (two-way ANOVA; ), and (iii) according to pCR versus non-pCR for the patients in each arm at four time-points (ANOVA followed by t-test for each time point separately; ).
Spearman rank correlations among the cytokine expression levels were assessed with R and were visualized with the corrplot package version 0.84. Spearman rank correlations between cytokine levels and circulating or infiltrating immune cells were assessed by using R and heatmap (pheatmap package version 1.08) or corrplot packages, respectively.
Conflict of interest
The authors declare no conflict of interest.
supp_data.zip
Download Zip (945.8 KB)Acknowledgments
This clinical trial was supported by the Pink Ribbon Movement, the Norwegian Breast Cancer Society (Project no. 11003001), and the Norwegian Research Council (Project no. 191436/V50). The K. G. Jebsen Center for Breast Cancer Research also contributed to this project. SJ was a PhD fellow of the South Eastern Norway Health Authority (Grant 272904 to VN Kristensen). Cytokine profiling was performed with a grant from Strategiske Midler at Akershus University Hospital (Grant 266972). We wish to acknowledge Grethe I. G. Alnæs and Jovana Klajic for their assistance with sample handling.
Additional information
Funding
References
- Kristensen VN, Vaske CJ, Ursini-Siegel J, Van Loo P, Nordgard SH, Sachidanandam R, Sørlie T, Wärnberg F, Haakensen VD, Helland Å, et al. Integrated molecular profiles of invasive breast tumors and ductal carcinoma in situ (DCIS) reveal differential vascular and interleukin signaling. PNAS. 2012;109:2802–7. doi:10.1073/pnas.1108781108. PMID:21908711.
- Dannenfelser R, Nome M, Tahiri A, Ursini-Siegel J, Vollan HKM, Haakensen VD, Helland Å, Naume B, Caldas C, Børresen-Dale AL, et al. Data-driven analysis of immune infiltrate in a large cohort of breast cancer and its association with disease progression, ER activity, and genomic complexity. Oncotarget. 2017;8:57121–33. doi:10.18632/oncotarget.19078. PMID:28915659.
- Quigley DA, Tahiri A, Luders T, Riis MH, Balmain A, Borresen-Dale AL, Bukholm I, Kristensen V. Age, estrogen, and immune response in breast adenocarcinoma and adjacent normal tissue. Oncoimmunology. 2017;6:e1356142. doi:10.1080/2162402X.2017.1356142. PMID:29147603.
- Clancy T, Dannenfelser R, Troyanskaya O, Malmberg KJ, Hovig E, Kristensen V. Bioinformatics Approaches to Profile the Tumor Microenvironment for Immunotherapeutic Discovery. Curr Pharm Des. 2017;23:4716–25. PMID:28699527.
- Quigley DA, Kristensen V. Predicting prognosis and therapeutic response from interactions between lymphocytes and tumor cells. Mol Oncol. 2015;9:2054–62. doi:10.1016/j.molonc.2015.10.003. PMID:26607741.
- Burugu S, Asleh-Aburaya K, Nielsen TO. Immune infiltrates in the breast cancer microenvironment: detection, characterization and clinical implication. Breast Cancer. 2017;24:3–15. doi:10.1007/s12282-016-0698-z. PMID:27138387.
- Okabe M, Toh U, Iwakuma N, Saku S, Akashi M, Kimitsuki Y, Seki N, Kawahara A, Ogo E, Itoh K, et al. Predictive factors of the tumor immunological microenvironment for long-term follow-up in early stage breast cancer. Cancer Sci. 2017;108:81–90. doi:10.1111/cas.13114. PMID:27801993.
- Parrish-Novak J, Dillon SR, Nelson A, Hammond A, Sprecher C, Gross JA, Johnston J, Madden K, Xu W, West J, et al. Interleukin 21 and its receptor are involved in NK cell expansion and regulation of lymphocyte function. Nature. 2000;408:57–63. doi:10.1038/35040504. PMID:11081504.
- Tan JT, Dudl E, LeRoy E, Murray R, Sprent J, Weinberg KI, Surh CD. IL-7 is critical for homeostatic proliferation and survival of naive T cells. PNAS. 2001;98:8732–7. doi:10.1073/pnas.161126098. PMID:11447288.
- Zou L, Barnett B, Safah H, Larussa VF, Evdemon-Hogan M, Mottram P, Wei S, David O, Curiel TJ, Zou W. Bone marrow is a reservoir for CD4+CD25+ regulatory T cells that traffic through CXCL12/CXCR4 signals. Cancer Res. 2004;64:8451–5. doi:10.1158/0008-5472.CAN-04-1987. PMID:15548717.
- Gaucher D, Therrien R, Kettaf N, Angermann BR, Boucher G, Filali-Mouhim A, Moser JM, Mehta RS, Drake DR 3rd, Castro E, et al. Yellow fever vaccine induces integrated multilineage and polyfunctional immune responses. J Exp Med. 2008;205:3119–31. doi:10.1084/jem.20082292. PMID:19047440.
- Chintalgattu V, Nair DM, Katwa LC. Cardiac myofibroblasts: a novel source of vascular endothelial growth factor (VEGF) and its receptors Flt-1 and KDR. J Mol Cell Cardiol. 2003;35:277–86. doi:10.1016/S0022-2828(03)00006-3. PMID:12676542.
- Shibuya M. Vascular Endothelial Growth Factor (VEGF) and Its Receptor (VEGFR) Signaling in Angiogenesis: A Crucial Target for Anti- and Pro-Angiogenic Therapies. Genes & cancer. 2011;2:1097–105. doi:10.1177/1947601911423031.
- Collet G, Lamerant-Fayel N, Tertil M, El Hafny-Rahbi B, Stepniewski J, Guichard A, Foucault-Collet A, Klimkiewicz K, Petoud S, Matejuk A, et al. Hypoxia-regulated overexpression of soluble VEGFR2 controls angiogenesis and inhibits tumor growth. Mol Cancer Ther. 2014;13:165–78. doi:10.1158/1535-7163.MCT-13-0637. PMID:24170768.
- Bando H, Weich HA, Brokelmann M, Horiguchi S, Funata N, Ogawa T, Toi M. Association between intratumoral free and total VEGF, soluble VEGFR-1, VEGFR-2 and prognosis in breast cancer. Br J Cancer. 2005;92:553–61. doi:10.1038/sj.bjc.6602374. PMID:15668703.
- Lambrechts D, Lenz HJ, de Haas S, Carmeliet P, Scherer SJ. Markers of response for the antiangiogenic agent bevacizumab. J Clin Oncol: Official journal of the American Society of Clinical Oncology. 2013;31:1219–30. doi:10.1200/JCO.2012.46.2762.
- Pierga JY, Petit T, Delozier T, Ferrero JM, Campone M, Gligorov J, Lerebours F, Roché H, Bachelot T, Charafe-Jauffret E, et al. Neoadjuvant bevacizumab, trastuzumab, and chemotherapy for primary inflammatory HER2-positive breast cancer (BEVERLY-2): an open-label, single-arm phase 2 study. Lancet Oncol. 2012;13:375–84. doi:10.1016/S1470-2045(12)70049-9. PMID:22377126.
- Hein A, Lambrechts D, von Minckwitz G, Haberle L, Eidtmann H, Tesch H, Untch M, Hilfrich J, Schem C, Rezai M, et al. Genetic variants in VEGF pathway genes in neoadjuvant breast cancer patients receiving bevacizumab: Results from the randomized phase III GeparQuinto study. Int J Cancer. 2015;137:2981–8. doi:10.1002/ijc.29656. PMID:26100253.
- Miles D, Cameron D, Bondarenko I, Manzyuk L, Alcedo JC, Lopez RI, Im SA, Canon JL, Shparyk Y, Yardley DA, et al. Bevacizumab plus paclitaxel versus placebo plus paclitaxel as first-line therapy for HER2-negative metastatic breast cancer (MERiDiAN): A double-blind placebo-controlled randomised phase III trial with prospective biomarker evaluation. Eur J Cancer. 2017;70:146–55. doi:10.1016/j.ejca.2016.09.024. PMID:27817944.
- Geiger-Gritsch S, Stollenwerk B, Miksad R, Guba B, Wild C, Siebert U. Safety of bevacizumab in patients with advanced cancer: a meta-analysis of randomized controlled trials. Oncologist. 2010;15:1179–91. doi:10.1634/theoncologist.2009-0155. PMID:21045188.
- Lassau N, Koscielny S, Chami L, Chebil M, Benatsou B, Roche A, Ducreux M, Malka D, Boige V. Advanced hepatocellular carcinoma: early evaluation of response to bevacizumab therapy at dynamic contrast-enhanced US with quantification–preliminary results. Radiology. 2011;258:291–300. doi:10.1148/radiol.10091870. PMID:20980447.
- Wu S, Kim C, Baer L, Zhu X. Bevacizumab increases risk for severe proteinuria in cancer patients. Journal of the American Society of Nephrology: JASN. 2010;21:1381–9. doi:10.1681/ASN.2010020167. PMID:20538785.
- Zhuang H, Yuan X, Zheng Y, Li X, Chang JY, Wang J, Wang X, Yuan Z, Wang P. A study on the evaluation method and recent clinical efficacy of bevacizumab on the treatment of radiation cerebral necrosis. Sci Rep. 2016;6:24364. doi:10.1038/srep24364. PMID:27067388.
- Bear HD, Tang G, Rastogi P, Geyer CE, Jr., Liu Q, Robidoux A, Baez-Diaz L, Brufsky AM, Mehta RS, Fehrenbacher L, et al. Neoadjuvant plus adjuvant bevacizumab in early breast cancer (NSABP B-40 [NRG Oncology]): secondary outcomes of a phase 3, randomised controlled trial. Lancet Oncol. 2015;16:1037–48. doi:10.1016/S1470-2045(15)00041-8. PMID:26272770.
- Untch M, Loibl S, Bischoff J, Eidtmann H, Kaufmann M, Blohmer JU, Hilfrich J, Strumberg D, Fasching PA, Kreienberg R, et al. Lapatinib versus trastuzumab in combination with neoadjuvant anthracycline-taxane-based chemotherapy (GeparQuinto, GBG 44): a randomised phase 3 trial. Lancet Oncol. 2012;13:135–44. doi:10.1016/S1470-2045(11)70397-7. PMID:22257523.
- von Minckwitz G, Eidtmann H, Rezai M, Fasching PA, Tesch H, Eggemann H, et al. Neoadjuvant chemotherapy and bevacizumab for HER2-negative breast cancer. N Engl J Med. 2012;366:299–309. doi:10.1056/NEJMoa1111065. PMID:22276820.
- von Minckwitz G, Loibl S, Untch M, Eidtmann H, Rezai M, Fasching PA, Tesch H, Eggemann H, Schrader I, Kittel K, et al. Survival after neoadjuvant chemotherapy with or without bevacizumab or everolimus for HER2-negative primary breast cancer (GBG 44-GeparQuinto)dagger. Annals of oncology: Official journal of the European Society for Medical Oncology. 2014;25:2363–72. doi:10.1093/annonc/mdu455. PMID:25223482.
- Cattin S, Fellay B, Pradervand S, Trojan A, Ruhstaller T, Ruegg C, Fürstenberger G. Bevacizumab specifically decreases elevated levels of circulating KIT+CD11b+ cells and IL-10 in metastatic breast cancer patients. Oncotarget. 2016;7:11137–50. doi:10.18632/oncotarget.7097. PMID:26840567.
- Varadan V, Kamalakaran S, Gilmore H, Banerjee N, Janevski A, Miskimen KL, Williams N, Basavanhalli A, Madabhushi A, Lezon-Geyda K, et al. Brief-exposure to preoperative bevacizumab reveals a TGF-beta signature predictive of response in HER2-negative breast cancers. Int J Cancer. 2016;138:747–57. doi:10.1002/ijc.29808. PMID:26284485.
- Silwal-Pandit L, Nord S, von der Lippe Gythfeldt H, Moller EK, Fleischer T, Rodland E, Borgen E, Garred Ø, Olsen T, et al. The Longitudinal Transcriptional Response to Neoadjuvant Chemotherapy with and without Bevacizumab in Breast Cancer. Clinical cancer research: an official journal of the American Association for Cancer Research. 2017;23:4662–70. doi:10.1158/1078-0432.CCR-17-0160. PMID:28487444.
- Ahn SH, Edwards AK, Singh SS, Young SL, Lessey BA, Tayade C. IL-17A Contributes to the Pathogenesis of Endometriosis by Triggering Proinflammatory Cytokines and Angiogenic Growth Factors. J Immunol (Baltimore, Md: 1950). 2015;195:2591–600. doi:10.4049/jimmunol.1501138.
- Newman AM, Liu CL, Green MR, Gentles AJ, Feng W, Xu Y, Hoang CD, Diehn M, Alizadeh AA. Robust enumeration of cell subsets from tissue expression profiles. Nat Methods. 2015;12:453–7. doi:10.1038/nmeth.3337. PMID:25822800.
- Salven P, Ruotsalainen T, Mattson K, Joensuu H. High pre-treatment serum level of vascular endothelial growth factor (VEGF) is associated with poor outcome in small-cell lung cancer. Int J Cancer. 1998;79:144–6. doi:10.1002/(SICI)1097-0215(19980417)79:2%3c144::AID-IJC8%3e3.0.CO;2-T. PMID:9583728.
- Hyodo I, Doi T, Endo H, Hosokawa Y, Nishikawa Y, Tanimizu M, Jinno K, Kotani Y. Clinical significance of plasma vascular endothelial growth factor in gastrointestinal cancer. Eur J Cancer. 1998;34:2041–5. doi:10.1016/S0959-8049(98)00282-2. PMID:10070308.
- Honorati MC, Cattini L, Facchini A. IL-17, IL-1beta and TNF-alpha stimulate VEGF production by dedifferentiated chondrocytes. Osteoarthritis Cartilage. 2004;12:683–91. doi:10.1016/j.joca.2004.05.009. PMID:15325633.
- Wu Y, Zhou BP. TNF-alpha/NF-kappaB/Snail pathway in cancer cell migration and invasion. Br J Cancer. 2010;102:639–44. doi:10.1038/sj.bjc.6605530. PMID:20087353.
- Espinoza JA, Jabeen S, Batra R, Papaleo E, Haakensen V, Timmermans Wielenga V, Møller Talman ML, Brunner N, Børresen-Dale AL, Gromov P, et al. Cytokine profiling of tumor 3interstitial fluid of the breast and its relationship with lymphocyte infiltration and clinicopathological characteristics. Oncoimmunology. 2016;5:e1248015. doi:10.1080/2162402X.2016.1248015. PMID:28123884.
- D'Andrea A, Rengaraju M, Valiante NM, Chehimi J, Kubin M, Aste M, et al. Production of natural killer cell stimulatory factor (interleukin 12) by peripheral blood mononuclear cells. J Exp Med. 1992;176:1387–98. doi:10.1084/jem.176.5.1387. PMID:1357073.
- Haile LA, Gamrekelashvili J, Manns MP, Korangy F, Greten TF. CD49d is a new marker for distinct myeloid-derived suppressor cell subpopulations in mice. J immunol (Baltimore, Md: 1950). 2010;185:203–10. doi:10.4049/jimmunol.0903573.
- Kleinewietfeld M, Starke M, Di Mitri D, Borsellino G, Battistini L, Rotzschke O, Falk K. CD49d provides access to “untouched” human Foxp3+ Treg free of contaminating effector cells. Blood. 2009;113:827–36. doi:10.1182/blood-2008-04-150524. PMID:18941119.
- Massena S, Christoffersson G, Vagesjo E, Seignez C, Gustafsson K, Binet F, Herrera Hidalgo C, Giraud A, Lomei J, Weström S, et al. Identification and characterization of VEGF-A-responsive neutrophils expressing CD49d, VEGFR1, and CXCR4 in mice and humans. Blood. 2015;126:2016–26. doi:10.1182/blood-2015-03-631572. PMID:26286848.
- Airoldi I, Di Carlo E, Cocco C, Caci E, Cilli M, Sorrentino C, Sozzi G, Ferrini S, Rosini S, Bertolini G, et al. IL-12 can target human lung adenocarcinoma cells and normal bronchial epithelial cells surrounding tumor lesions. PLoS One. 2009;4:e6119. doi:10.1371/journal.pone.0006119. PMID:19582164.
- Dias S, Boyd R, Balkwill F. IL-12 regulates VEGF and MMPs in a murine breast cancer model. Int J Cancer. 1998;78:361–5. doi:10.1002/(SICI)1097-0215(19981029)78:3%3c361::AID-IJC17%3e3.0.CO;2-9. PMID:9766572.
- Katz Y, Nadiv O, Beer Y. Interleukin-17 enhances tumor necrosis factor alpha-induced synthesis of interleukins 1,6, and 8 in skin and synovial fibroblasts: a possible role as a “fine-tuning cytokine” in inflammation processes. Arthritis Rheum. 2001;44:2176–84. doi:10.1002/1529-0131(200109)44:9%3c2176::AID-ART371%3e3.0.CO;2-4. PMID:11592383.
- Essaghir A, Toffalini F, Knoops L, Kallin A, van Helden J, Demoulin JB. Transcription factor regulation can be accurately predicted from the presence of target gene signatures in microarray gene expression data. Nucleic Acids Res. 2010;38:e120. doi:10.1093/nar/gkq149. PMID:20215436.
- Park J, Kim S, Joh J, Remick SC, Miller DM, Yan J, Kanaan Z, Chao JH, Krem MM, Basu SK, et al. MLLT11/AF1q boosts oncogenic STAT3 activity through Src-PDGFR tyrosine kinase signaling. Oncotarget. 2016;7:43960–73. PMID:27259262.
- Maniati E, Hagemann T. IL-17 mediates resistance to anti-VEGF therapy. Nat Med. 2013;19:1092–4. doi:10.1038/nm.3333. PMID:24013745.
- Kano MR, Morishita Y, Iwata C, Iwasaka S, Watabe T, Ouchi Y, Miyazono K, Miyazawa K. VEGF-A and FGF-2 synergistically promote neoangiogenesis through enhancement of endogenous PDGF-B-PDGFRbeta signaling. J Cell Sci. 2005;118:3759–68. doi:10.1242/jcs.02483. PMID:16105884.
- Siedlecki J, Wertheimer C, Wolf A, Liegl R, Priglinger C, Priglinger S, Eibl-Lindner K. Combined VEGF and PDGF inhibition for neovascular AMD: anti-angiogenic properties of axitinib on human endothelial cells and pericytes in vitro. Graefe's archive for clinical and experimental ophthalmology = Albrecht von Graefes Archiv fur klinische und experimentelle Ophthalmologie. 2017;255:963–72. doi:10.1007/s00417-017-3595-z. PMID:28161830.
- Berahovich RD, Lai NL, Wei Z, Lanier LL, Schall TJ. Evidence for NK cell subsets based on chemokine receptor expression. J immunol (Baltimore, Md: 1950). 2006;177:7833–40. doi:10.4049/jimmunol.177.11.7833.
- Groom JR, Luster AD. CXCR3 in T cell function. Exp Cell Res. 2011;317:620–31. doi:10.1016/j.yexcr.2010.12.017. PMID:21376175.
- Shields PL, Morland CM, Salmon M, Qin S, Hubscher SG, Adams DH. Chemokine and chemokine receptor interactions provide a mechanism for selective T cell recruitment to specific liver compartments within hepatitis C-infected liver. J immunol (Baltimore, Md: 1950). 1999;163:6236–43.
- Wendel M, Galani IE, Suri-Payer E, Cerwenka A. Natural killer cell accumulation in tumors is dependent on IFN-gamma and CXCR3 ligands. Cancer Res. 2008;68:8437–45. doi:10.1158/0008-5472.CAN-08-1440. PMID:18922917.
- Perez EA. Microtubule inhibitors: Differentiating tubulin-inhibiting agents based on mechanisms of action, clinical activity, and resistance. Mol Cancer Ther. 2009;8:2086–95. doi:10.1158/1535-7163.MCT-09-0366. PMID:19671735.
- Carson WE, 3rd, Shapiro CL, Crespin TR, Thornton LM, Andersen BL. Cellular immunity in breast cancer patients completing taxane treatment. Clinical cancer Research: An official journal of the American Association for Cancer Research. 2004;10:3401–9. doi:10.1158/1078-0432.CCR-1016-03. PMID:15161695.
- Zaks-Zilberman M, Zaks TZ, Vogel SN. Induction of proinflammatory and chemokine genes by lipopolysaccharide and paclitaxel (Taxol) in murine and human breast cancer cell lines. Cytokine. 2001;15:156–65. doi:10.1006/cyto.2001.0935. PMID:11554785.
- Jackman RW, Rhoads MG, Cornwell E, Kandarian SC. Microtubule-mediated NF-kappaB activation in the TNF-alpha signaling pathway. Exp Cell Res. 2009;315:3242–9. doi:10.1016/j.yexcr.2009.08.020. PMID:19732770.
- Romagnani S. Th1/Th2 cells. Inflamm Bowel Dis. 1999;5:285–94. doi:10.1097/00054725-199911000-00009. PMID:10579123.
- Kobayashi M, Kobayashi H, Pollard RB, Suzuki F. A pathogenic role of Th2 cells and their cytokine products on the pulmonary metastasis of murine B16 melanoma. J immunol (Baltimore, Md: 1950). 1998;160:5869–73.
- Jin P, Zhao Y, Liu H, Chen J, Ren J, Jin J, Bedognetti D, Liu S, Wang E, Marincola F, et al. Interferon-gamma and Tumor Necrosis Factor-alpha Polarize Bone Marrow Stromal Cells Uniformly to a Th1 Phenotype. Sci Rep. 2016;6:26345. doi:10.1038/srep26345. PMID:27211104.
- Romagnani S. Th1/Th2 cells. Inflamm Bowel Dis. 1999;5:285–94. doi:10.1097/00054725-199911000-00009. PMID:10579123.
- Benjamini YaH. Y Controlling the false discovery rate: A practical and powerful approach to multiple testing. J R Statistic society. 1995;57:289–300.