
ABSTRACT
mTOR inhibition can promote or inhibit immune responses in a context dependent manner, but whether this will represent a net benefit or be contraindicated in the context of immunooncology therapies is less understood. Here, we report that the mTORC1/2 dual kinase inhibitor vistusertib (AZD2014) potentiates anti-tumour immunity in combination with anti-CTLA-4 (αCTLA-4), αPD-1 or αPD-L1 immune checkpoint blockade. Combination of vistusertib and immune checkpoint blocking antibodies led to tumour growth inhibition and improved survival of MC-38 or CT-26 pre-clinical syngeneic tumour models, whereas monotherapies were less effective. Underlying these combinatorial effects, vistusertib/immune checkpoint combinations reduced the occurrence of exhausted phenotype tumour infiltrating lymphocytes (TILs), whilst increasing frequencies of activated Th1 polarized T-cells in tumours. Vistusertib alone was shown to promote a Th1 polarizing proinflammatory cytokine profile by innate primary immune cells. Moreover, vistusertib directly enhanced activation of effector T-cell and survival, an effect that was critically dependent on inhibitor dose. Therefore, these data highlight direct, tumour-relevant immune potentiating benefits of mTOR inhibition that complement immune checkpoint blockade. Together, these data provide a clear rationale to investigate such combinations in the clinic.
Introduction
Evasion from anti-tumour immunity is a hallmark feature of cancer. Whilst strategies employed by the tumour to avoid immune-mediated clearance are complex and multifaceted, some therapeutic approaches to promote anti-tumour immunity are emerging. Antibody-mediated blockade of immune-checkpoint receptors is now clinically approved across a range of indications,Citation1 however such treatments lack sustained efficacy in the majority of patients.Citation2 Thus, a deeper understanding of therapeutic interventions represents an area of unmet clinical need. Given that redundancy may exist between immunosuppressive mechanisms utilized by a tumour, there is great scope to improve clinical responses by combining existing immune-targeting and/or tumour targeting therapies in a rational manner.
The mechanistic target of rapamycin (mTOR) signalling pathway represents a key pathway in many human cancers.Citation3-Citation5 Therapeutic mTOR inhibition has been well studied as a tumour targeting agent in the context of many tumour types, including ER+ breast cancer in combination with endocrine therapy.Citation6 mTOR kinase functions in the context of multiprotein complexes termed mTORC1 and mTORC2, which under physiological conditions can be engaged by a variety metabolic, stress and immunological signals in immune cell populations. Inhibitors of mTOR signalling have been long believed to be profoundly immunosuppressive, and blockade of mTOR signalling with the allosteric mTORC1 inhibitor rapamycin inhibits effector T-cell expansion following mitogen treatment.Citation7 To this end, structurally related compounds (collectively termed rapalogues) have been used clinically to prevent graft rejection following transplantation.Citation8 However, an emerging body of literature suggests that in some immunological contexts, mTOR inhibition can also potentiate immune responses.Citation9,Citation10
Given the unusual nature of the suppressed immune-microenvironment within a tumour, and the pleiotropic impacts of mTOR inhibitors on distinct immune cell subsets, it remains unclear whether mTOR inhibition will suppress anti-tumour immunity,Citation11 or whether it will potentiate anti-tumour responses.Citation12,Citation13 Interpretation of these questions has been obscured by the use of mTORC1-targeting rapalogues, that deliver incomplete pathway inhibition,Citation14 or by non-clinical quality mTOR kinase inhibitor compounds which may possess off-target activity at therapeutically relevant doses.Citation15 To systematically address the immunological impact of acute mTOR inhibition in cancer, we investigated the impact of the clinical dual mTORC1/2 kinase inhibitor vistusertib (AZD2014) in the context of anti-tumour immunotherapy.
Results
mTOR kinase inhibition with vistusertib potentiates the effects of immune checkpoint blockade in preclinical tumour models
Vistusertib (AZD2014) is a potent, orally available, mTOR kinase inhibitor, with a reported IC50 in sensitive tumour cell lines of between 100-200 nM,Citation6 and is under investigation as a tumour targeted agent against both solid and hematological malignancies. To investigate whether primary immune cells were sensitive to vistusertib treatment, we first asked whether vistusertib inhibited downstream mTOR pathway targets in primary CD8+ T-cells. Following in vitro activation, we observed dose-dependent inhibition of mTORC1 complex signaling (measured by phosphorylation of S6 on Ser240/244) with a similar potency to sensitive tumour cell lines (Fig. S1A).Citation6 This contrasted treatment with rapamycin, which promoted an extremely potent inhibitory effect on pS6 (Ser240/244) at sub-pM concentrations (Fig. S1B). Phosphorylation of the alternative mTORC1 target 4Ebp1 (Thr36/45) was previously shown to be less sensitive to rapamycin-mediated inhibition compared to pS6 (Ser240/244).Citation16 Comparably vistusertib was capable of inhibiting p4Ebp1 (Thr36/45) to a greater extent than rapamycin (Fig. S1C). Vistusertib also inhibited mTORC2 signaling (measured by phosphorylation of Akt on Ser473) in primary naïve T-cells, further differentiating vistusertib from rapamycin, which preferentially targeted mTORC1 (Fig. S1D-E). We further confirmed mTORC2 target engagement in immunoinfiltrated CT-26 syngeneic tumours in vivo, finding robust inhibition of Akt Ser473 4h after dosing (Fig. S1F). Therefore, vistusertib promoted acute mTOR pathway inhibition in primary native T-cells, and exhibited a differentiated pharmacology consistent with mTOR kinase inhibition.
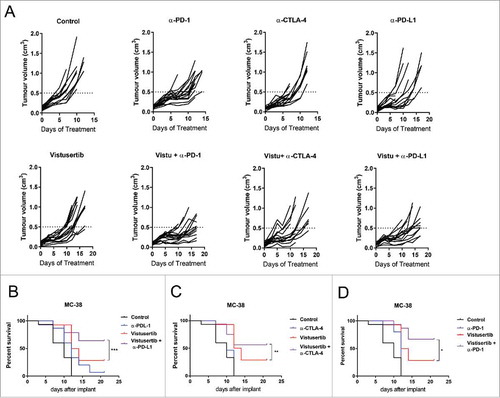
Given the sensitivity of immune cells to vistusertib, we further investigated whether mTOR kinase inhibition influenced anti-tumour immunity in the context of immune-checkpoint blockade. We investigated the vistusertib/immune checkpoint combinations in mice bearing syngeneic MC-38 tumour. MC-38 is derived from a colorectal (CRC) tumour and has a predominant infiltration of myeloid cells in relation to T and NK cells.Citation17 MC-38 tumours were modestly sensitive to either checkpoint blockade (αPD-1, αCTLA-4 and αPD-L1) or mTORC1/2 inhibiton as a monotherapy. However significant anti-tumour effects were observed when combining vistusertib and checkpoint blockade (), along with improved survival compared to treatment with each single agent (-). Taken together these data sugget that mTORC1/2 inhibitors have a positive anti-tumour effect in combination with immuno-checkpoint blockade.
Figure 1. Vistusertib combines with immune checkpoint blockade to potentiate anti-tumour efficacy in the MC-38 tumour model. (A) Spider plots show individual mouse tumour volumes from C57BL6 mice bearing MC-38 tumours treated from 4 days post-implantation with vehicle control, Vistusertib at 15 mg/kg daily, αPD-1, αPD-L1 and αCTLA-4 10 mg/kg 2x weekly. Survival curves depicting Vistusertib 15 mg/kg daily in combination with (B) a-PD-1, (C) a-PD-L1 and (D) α-CTLA-4 blocking antibodies at 10 mg/kg 2x weekly. n=15 mice per group. Statistics calculated using Log-rank test. Data are representative of 2 experiments.
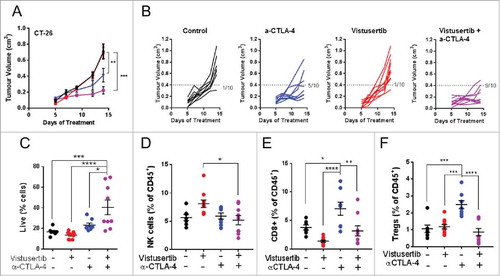
To confirm the applicability of these observations to additonal tumour models, we further investigated the vistusertib/checkpoint blockade combination in a second model, CT-26. CT-26 tumour cells harbour an activating mutation in K-Ras,Citation18 which commonly confers resistance to PI3K/mTORC1/2 inhibition.Citation19,Citation20 We confirmed this prediction, observing that CT-26 tumours were insensitive to vistusertib when delivered with a regimen that promotes anti-tumour efficacy in sensitive tumour cell lines.Citation6. Interestingly, vistusertib potentiated anti-tumour efficacy when co-administered as a combination therapy with αCTLA-4 immune-checkpoint blockade (-), although the CT-26 model did not respond to αPD-L1 (data not shown). Pharmacokinetic (PK) experiments demonstrated that the dosing regimen employed achieved exposures over the cellular IC50 for ∼15-20 hours, and that PK properties were not impacted by either the presence of a CT-26 tumour, or the administration of αCTLA-4 blocking antibodies (Fig. S1E). Therefore in two models that represent varied immunological landscapes, vistusertib showed combinatorial with immune checkpoint blockade to potentiate antitumour activity and survival.
Figure 2. Vistusertib combines with αCTLA-4 immune checkpoint blockade to potentiate anti-tumour efficacy in the CT-26 tumour model. (A) Line graph shows average tumour volumes from BALB/c mice bearing CT-26 tumours. (B) Spider plots show individual mouse tumour volumes. (C) Spider plots show individual mouse tumour volumes. (A-B) CT-26 tumour bearing mice were treated with vistusertib, αCTLA-4 or vehicle as indicated from day 1 post implantation. Tumours were analysed by flow cytometry on day 11 after first dose. (C) Scatter bar charts show frequency of CD45+ cells within tumours, (D) frequency of NK cells, (E) frequency of Tregs and (F) frequency of CD8+ T-cells. Error bars represent mean ±SEM, statistical differences were calculated using a 1-way ANOVA with post hoc analysis. n=10 mice per group. Data are representative of ≥2 experiments.
mTOR inhibition reverses the exhausted phenotype of tumour infiltrating CD8+ T-cells
mTOR inhibition is associated with both suppression and potentiation of immunity, which depends on the immunological context. Given the enhanced anti-tumour effect observed when vistusertib was combined with immune checkpoint blockade, we hypothesized that in the context of cancer immunotherapy, vistusertib may potentiate anti-tumour immune cell functions. To investigate this concept, we measured pharmacodynamic (PD) changes in vistusertib treated CT-26 tumour bearing mice in the presence or absence of αCTLA-4 immune-checkpoint inhibition. αCTLA-4 administration conferred a trend of enhanced CD45+ hematopoietic cell recruitment to tumours, an effect that was significantly potentiated by vistusertib (). Vistusertib did not significantly impact NK cell frequencies under conditions tested (). Instead, we observed a reduction in the frequency of both Foxp3+ regulatory T-cells (Tregs), and CD8+ T-cells infiltrating the tumours in vistusertib/αCTLA-4 combination groups, as compared to αCTLA-4 treatment alone (-). Thus, we found direct evidence that vistusertib therapy modulated the tumour-immune microenvironment and impacted both pro-tumourigenic and anti-tumourigenic immune populations.
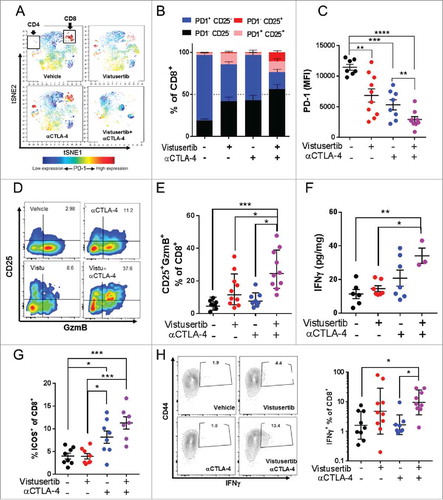
To better understand how mTOR inhibition could impact the functional state of the tumour-immune infiltrate, we performed tSNE analysis on our high dimensional flow cytometry dataset generated from mice bearing CT-26 tumours.Citation21 Interestingly, we observed the monotherapeutic αCTLA-4 immune checkpoint administration resulted in clusters of PD-1+ T-cells (), supporting recent observations that immune checkpoint blocking antibodies preferentially expand exhausted phenotype T-cells in both mice and man.Citation22 However, T-cell populations appeared functionally less exhausted in vistusertib treated tumour bearing mice, exhibiting lower expression of the exhaustion marker PD-1 (-). In keeping with this observation, we also observed an increased proportion of cells expressing the high affinity IL-2 receptor CD25, which marks activated/effector cells and of the cytotoxic functional marker Granzyme B (GzmB) (-). IFNγ is a major cellular effector cytokine produced by cytotoxic and Th1 polarized T-cells, which serves to enhance antigen presentation of tumour and recruit cytotoxic immune cells.Citation23 Analysis of tumour aqueous extract revealed that vistusertib/αCTLA-4 treated mice maintained high levels of IFNγ (). Similar results were also observed in MC-38 tumour bearing mice, where the vistusertib/αCTLA-4 combination enhanced the frequencies of CD8+ T-cells expressing the activation marker ICOS+ (), which is a positive biomarker of αCTLA-4 therapeutic and clinical responses.Citation24 Moreover, vistusertib/αCTLA-4 combination significantly enhanced the proportion of IFNγ expressing CD8+ T-cells (). Finally, combination of vistusertib and αCTLA-4 blockade was inactive in nude mice lacking mature T-cells (Fig. S2A-B), supporting the improving T-cell activation profile as the main mode of action. When taken together, our data indicate the clinical mTOR kinase inhibitor vistusertib synergizes with αCTLA-4 immune checkpoint blockade by reducing the level of CD8+ T-cell exhaustion, and had a net effect to enhance anti-tumour effector responses.
Figure 3. mTOR inhibition reduces the exhaustion phenotype of TILs within CT-26 tumours. (A-F) CT-26 tumour bearing mice were treated with vistusertib, αCTLA-4 or vehicle as indicated from day 1 post implantation. Tumours were analysed by flow cytometry on day 11 after first dose. (A) viSNE plots show PD-1 expression on clustered populations. Clusters that represent CD4+ and CD8+ T-effector cells are indicated. (B) Stacked bar chars show a quantitation of indicated population frequencies (≥5 per group). (C) Scatter bar chart shows PD-1 expression on conventionally gated CD8+CD62L-CD44+ T-effector memory cells. (D) Pseudocolor plots show expression of CD25 and Granzyme B on CD8+ gated T-cells from representative tumors. (E) Scatter bar chart shows the frequency of CD8+GzmB+PD-1- T-effector cells (F) Scatter bar chart shows the concentration of interferon-γ in tumour aqueous extracts, as measured by LegendPLEX analysis. Error bars represent mean±SEM, statistical differences were calculated using a 1-way ANOVA with post hoc analysis (G-H) MC-38 tumour bearing mice were treated with vistusertib, αCTLA-4 or vehicle as indicated from day 1 post implantation. Tumours were analysed by flow cytometry on day 10 after first dose. (G) Scatter bar chart shows the frequency of CD8+ICOS+ T-effector cells. (H) Contour plots show expression of CD44 and IFN-γ on CD8+ gated T-cells from representative tumors after restimulation ex vivo. Scatter bar chart shows the frequencies of CD8+CD44hiIFN-γ+ cells within groups. Error bars represent Geo mean±SD. Statistical differences were calculated with a Kruskal-Wallis test with post hoc analysis. *, P<0.05, **, P<0.01, ***, P<0.001. Data are representative of ≥2 experiments
Vistusertib enhances the proinflammatory cytokine profile of APCs
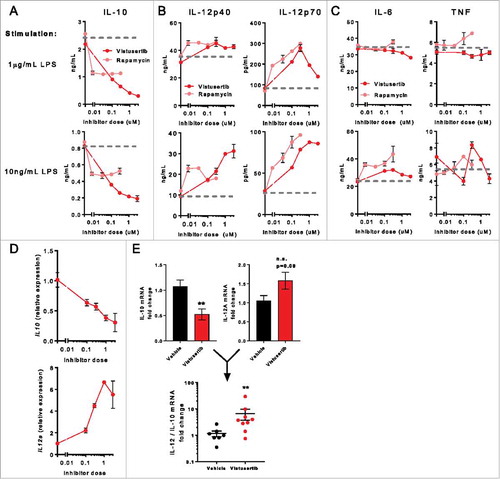
To understand the direct cellular targets that result in immunopotentiated phenotypes, we considered that mTOR signaling can restrain immunity in a variety of contexts. This is perhaps best characterized in innate immune cells, where pharmacological inhibition or genetic ablation of mTOR can promote pro-inflammatory cytokine production by antigen presenting cells (APCs).Citation10,Citation25-Citation29 To investigate whether vistusertib promoted a proinflammatory/cytotoxic innate immune cytokine profile, bone-marrow derived DCs (BMDCs) were generated from WT bone marrow and activated in vitro, in the presence of vistusertib, or the mTORC1 inhibitor rapamycin. Both vistusertib and rapamycin reduced expression of the immunosuppressive cytokine IL-10, but the impacts were far more striking with vistusertib at doses >100nM (). In addition, production of the pro-inflammatory Th1 promoting cytokine IL-12 was enhanced ), whereas other pro-inflammatory cytokines IL-6 and TNF were unaffected by mTOR inhibition (), Fig. S3A), consistent with previous reports.Citation26,Citation28 The exquisite sensitivity of IL-10 production to mTOR signaling was confirmed over a wider dose range by Meso Scale Discovery (MSD), revealing the EC50 of the IL-10 inhibitory effect conferred by vistusertib was between ∼30-100nM (Fig. S3B). Finally, the impact of vistusertib on IL-10 and IL-12 was additionally observed to occur at the transcriptional level (). Together, these observations prompted us to investigate whether vistusertib influenced the cytokine milieu in CT-26 tumours. Here, we observed a significant decrease in IL-10 mRNA, in addition to a 1.5 fold increase in IL-12 mRNA. Examining individual mice revealed that vistusertib was able to positively skew the IL-12:IL-10 ratio in tumours (). We concluded that mTOR inhibition with vistusertib may contribute to enhanced pro-inflammatory modality of tumour resident antigen presenting cells, which is a likely contributor to its synergistic therapeutic benefit with immune checkpoint blockade.
Figure 4. mTOR inhibition promotes a proinflammatory cytokine profile in DCs. Bone marrow derived DCs (BMDCs) were pre-incubated with indicated concentrations of inhibitors for 2h, then stimulated overnight with indicated quantities of LPS. (A) IL-10, (B) IL-12p40 and IL-12p70, (C) IL-6 and TNF were quantified in culture supernatant by ELISA. (D) Gene expression profiling was performed on LPS-activated BMDCs. Line graphs show expression of IL12a and IL10 expression normalized to controls. Data represent ≥2 experiments. (E) CT-26 tumours bearing mice were treated with vistusertib or vehicle from day 1 post implantation. Bulk tumours were lysed and RNA was analysed by fluidigm on day 11 after first dose. Bar graphs show expression of IL-10 or IL-12A mRNA, scatter bar chart shows the IL-12/IL-10 mRNA ratio for individual mice. Statistical differences were calculated with a Mann-Whitney test. Data represent n=9 per group.
Vistusertib enhances the survival of weakly activated effector CD8+ T-cells
Given evidence that vistusertib potentiated the T-cell response against tumours, we also investigated whether mTOR inhibition could directly modulate T-cell function. Intratumoural T-cells are likely to be sub-optimally activated and the impact of mTOR inhibition in such a context has not been reported.Citation30,Citation31 We therefore developed an in vitro assay to model a suboptimal stimulatory environment. Purified CD8+ naïve T-cells were cultured at a 1:1 ratio with αCD3/αCD28 coated T-cell activation beads or αCD3 coated plates with soluble αCD28. Culture with activation beads resulted in a sub-optimal activation, as measured by the activation marker CD69, and could be further augmented upon addition of IL-2 (Fig. S4A). Activated T-cells produce autocrine IL-2 to support their ongoing differentiation/survival, and IL-2 signalling promotes upregulation of the high affinity receptor CD25 as part of a feed-forward loop.Citation32,Citation33 In our culture system, IL-2 addition could also enhance CD25 expression on sub-optimally stimulated T-cells (Fig. S4B), suggesting that autocrine IL-2 production was rate-limiting under these conditions. As expected, IL-2 did not impact the expression of CD5, a surface protein that is uniquely regulated by TCR signalling (Fig. S4C).Citation34,Citation35 Finally, despite αCD3/αCD28 bead stimulation promoting a weaker T-cell activation, the differentiation marker CD44 was nevertheless upregulated, suggesting that differentiation from naïve to T-effector cells was still preserved (Fig. S4D).
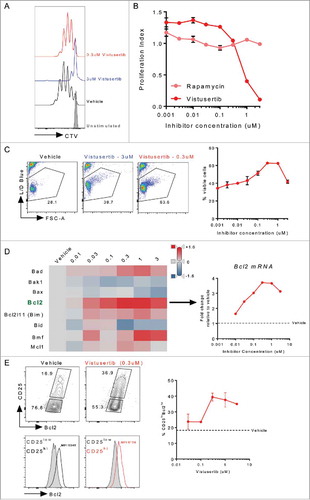
Having established a weak T-cell activation assay, we asked whether mTOR inhibitors could potentiate or inhibit this process. Whilst high doses of vistusertib profoundly blocked T-cell proliferation, doses under 1μM preserved T-cell proliferative capacity. This dose response contrasted that of the well characterized mTORC1 inhibitor rapamycin, which partially inhibited T-cell proliferation at all doses investigated (-). Indeed, these results were reminiscent of the subtly reduced T-cell accumulation observed in tumours in vivo (). However, we additionally observed that vistusertib enhanced survival of activated T-cells at intermediate doses (). Whilst a pro-survival phenotype following mTOR inhibition has been previously reported in memory precursor cells,Citation36 this represented an unexpected finding in freshly activated T-effector cells. To better understand the mechanism underlying vistusertib-dependent CD8 T-effector cell survival, we examined the expression of a panel of pro- and anti-apoptotic factors that have been previously associated with T-cell population dynamics in the thymus.Citation37 This analysis revealed a vistusertib-dependent upregulation of the pro-survival gene Bcl2 (), but not the related prosurvival gene Bcl2l1, which encodes Bclxl (Fig. S5). To confirm the significance of this finding, we examined Bcl2 protein expression after 4d of culture. Rather than representing a global increase in Bcl2 expression, we found that vistusertib promoted accumulation of a CD25+Bcl2hi subpopulation of cells (). When taken together, we conclude that intermediate doses of vistusertib enhance the survival of weakly activated CD8+ T-effector cells.
Figure 5. mTOR inhibition with vistusertib promotes CD8+ T-effector cell survival. Naïve CD8+ T-cells were purified from spleen, labelled with CTV and stimulated for 3d with αCD3/αCD28 coateed activator beads. Inhibitors were added to indicated concentrations. (A) Histogram shows representative proliferation as measured by CTV dilution following culture. (B) Line graph shows proliferation index. (C) Line graph shows the frequency of viable cells, pseudocolor plots show representative live cell gating. (D) Heat map shows relative expression (neg ddct) of select pro and anti-apoptotic genes measured by fluidigm mRNA analysis, the line graph shows fold-change Bcl2 mRNA expression. (E) Pseudo-colour plots show CD25 versus Bcl2, histograms show Bcl2 expression for CD25lowBcl2low (grey fill), or CD25hiBcl2hi (black or red line) gated cells. MFI for the CD25hiBcl2hi cell population is indicated on the histograms. Line graph shows the frequency of CD25hiBcl2hi cells across a range of vistusertib doses. Data represent ≥2 experiments.
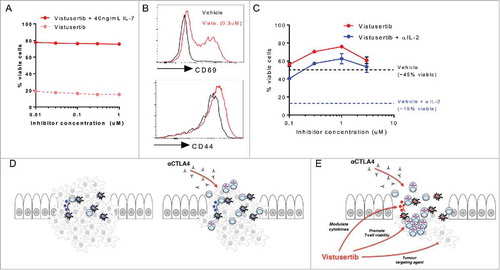
Given the in vivo pharmacokinetic exposure profile (Fig. S1G), and observed dose-dependent impacts of vistusertib on T-cell proliferation and survival, we reasoned that the preferential survival of effector cells could account for a global reduction of T-cell frequencies, but relative enrichment for effector T-cells in tumours (). If this hypothesis was correct, we predicted that the pro-survival effect of vistusertib would be selective for effector T-cells. To investigate this, naïve T-cells were cultured for 3d, in the presence or absence of the prosurvival cytokine IL-7.Citation38 Under these unstimulated culture conditions, vistusertib did not detectably impact T-cell survival within the dose range investigated (). We made a second prediction, that vistusertib treatment could enhance the accumulation of activated/effector phenotype T-cells in vitro. Indeed, we observed that vistusertib potentiated the expression of the effector/memory marker CD44, and greatly increased the presence of cells expressing the CD69 activation marker (). Finally, we asked whether vistusertib could enhance survival in conditions that model rate-limiting pro-survival factors in vivo. The autocrine/paracrine production of IL-2 can be limiting for T-cell survival in tumours.Citation39,Citation40 In vitro, T-cell activation for 3d in the presence of an αIL-2 neutralizing antibody reduced the frequency of surviving vehicle treated effector cells from ∼45% to ∼15% (, dotted lines). In contrast, IL-2 neutralization only modestly decreased survival of vistusertib treated effector cells, suggesting that mTOR kinase inhibition can dissociate effector T-cells from a strict requirement for cytokine-mediated survival (). Together, these data provide novel insight as to how vistusertib can synergize with immune-checkpoint therapy, suggesting that mTOR inhibitors function to potentiate multiple arms of an anti-tumour immune response to favour accumulation of effector, Th1-polarized, cytotoxic T-cell responses.
Figure 6. Vistusertib selectively enhances the activation phenotype of effector T-cells to synergize with immune checkpoint blockade. (A) Purified naïve CD8+ T-cells were rested for 3d with vistusertib in the presence (red) or absence (dotted salmon) of the naïve T-cell prosurvival cytokine IL-7. The line graph shows the frequency of viable cells. (B) Histograms show expression of CD69 and CD44 on T-cells stimulated in the presence of vehicle or vistusertib (0.3 μM). (C) Purified CD8+ T-cells were stimulated in the presence of vistusertib or vehicle +/- 10 μg/mL αIL-2 neutralizing antibody. Data represent ≥2 experiments. (D-E) Model depicting mechanistic benefit between αCTLA-4 immune checkpoint blockade and vistusertib. (D) αCTLA-4 monotherapy can promote activation and accumulation of effector T-cells to the suppressive tumour microenvironment. (E) Vistusertib enhances the effects of immune checkpoint blockade favourably modulating Th1-promoting cytokine expression and directly promoting effector T-cell viability. In addition, vistusertib acts as a tumour-targeting agent, which may further synergize with immunotherapies by reducing overall tumour burden.
Discussion
mTOR inhibition is classically understood to confer a state of immunosuppression, however a growing body of literature points to context-dependent immune potentiating phenotypes following mTOR inhibition/ablation. We have uncovered an additive effect of combining the clinical mTOR inhibitor vistusertib with immune-checkpoint therapy in cancer. Whilst not efficacious as a monotherapy in the CT-26 model, the combination of vistusertib and αCTLA-4 checkpoint blockade enhanced the accumulation of effector CD8+ T-cells within tumours, driving anti-tumour immune responses. In the MC-38 model, vistusertib enhanced anti-tumour responses conferred by both αCTLA-4 and αPD-L1 administration. These results contribute to a growing body of evidence that suggest mTOR inhibition can promote favourable immune effects. For instance, mTOR inhibitors have been shown to synergize with tumour vaccines,Citation41,Citation42 in addition to αPD-L1 immune checkpoint blockade,Citation12 suggesting that combination of mTOR inhibitors and immune potentiating therapies could represent a broadly applicable therapeutic approach.
How do mTOR inhibitors promote anti-tumour immunity? We have revealed two novel effects of the mTOR inhibitor vistusertib on key immune populations. Firstly in activated DCs, vistusertib modulated cytokine production in a dose-dependent manner, reducing the production of the immune inhibitory cytokine IL-10 whilst enhancing IL-12 (). This finding is in agreement with several reports showing that mTORC1 inhibition or mTOR ablation can enhance proinflammatory phenotypes in DCs.Citation25,Citation26,Citation29 Vistusertib has previously been shown to limit IL-10 production by tumour cells themselves in diffuse large B-cell lymphoma (DLBCL) cell lines,Citation43 suggesting this mechanism may extend beyond immune cells to more broadly impact the tumour microenvironment in some contexts. The IL-10:IL-12 axis has been recently identified as an important indicator of chemotherapeutic responses, with IL-10 shown to limit subsequent intratumoral cytotoxic T-cell activity.Citation44 Moreover, a lower IL-12:IL-10 ratio is a negative prognostic marker, indicative of a suboptimal immune response in HPV-associated pre-neoplastic lesions.Citation45 In addition, IL-12 is a key Th1 promoting cytokine, which may underlie the enhanced IFNγ production observed in vistusertib/αCTLA-4 treated tumours.() Citation46
A second novel phenotype was identified when we investigated the dose-dependent effects of vistusertib on weakly activated effector CD8+ T-cells. Whilst high doses of vistusertib could completely inhibit T-cell activation, intermediate doses (<1μM) selectively promoted effector T-cell survival, which was associated with an accumulation of CD25hiBcl2hi cells in culture. Bcl-2 downregulation normally occurs prior to the contraction phase of effector T-cell responses,Citation47 and this prosurvival benefit of vistusertib appeared to translate in vivo where we observed accumulation of CD8+ T-effector cells within tumours. To our knowledge, this data represents the first evidence of a dose-dependent immune potentiating impact of mTOR signalling in primary effector T-cells. These findings are in keeping with evidence that rapamycin promotes the accumulation of T-cell memory cells during viral infection or vaccination,Citation36,Citation48 and that mTOR plays a generalized role to limit biological lifespan.Citation49 In addition, given that mTOR inhibition is known to promote autophagy,Citation50 our results may extend findings by Xu et al., who linked autophagy to enhanced effector T-cell survival and differentiation during immune responses to chronic viral infection,Citation51 Further study will be required to delineate the contributions of downstream mTOR-dependent processes that limit intratumoral immunity.
Altogether, the insights from this study provide a comprehensive, systems-level analysis of the direct tumour-relevant targets of mTOR kinase inhibition. Whilst these studies build on previous pre-clinical observations of combinatorial benefit between the mTORC1 inhibitor rapamycin and α-PD-L1 immune checkpoint blockade in a syngeneic oral cavity cancer model,Citation12 our results provide novel insight to the mechanisms underlying such potential synergy and extend these findings to a clinical mTOR kinase inhibitor for the first time. Whilst we observed that αCTLA-4 immune-checkpoint blockade was efficient at recruiting/expanding CD8+ T-effector populations in tumours, these cells retained a somewhat exhausted phenotype ().Citation22 In contrast, through pleiotropic effects to modulate Th1 promoting innate immune cytokines, and selectively enhance effector CD8+ T-cell viability, vistusertib was able to confer a less suppressive tumour microenvironment (). These data support a model where careful scheduling/dosing of mTOR inhibitors can directly benefit anti-tumour immune-checkpoint therapy,Citation52,Citation53 and provide a clear rationale for exploration of vistusertib/immune checkpoint blockade in the clinic. It is of note that vistusertib treatment resulted in a bell-shaped phenotypic response in T-cells, with the maximal potentiating effect observed at around the IC50 for pathway inhibition. Given our measurement of rapamycin potency in primary T-cells suggesting IC50 for mTOR pathway inhibition may be in the sub-pM range (Fig. S1B), our data predicts that conventional therapeutic doses of rapalogues may be well above the concentration predicted to confer maximal immunological benefit.Citation54 Interestingly, early phase clinical trials are underway, aiming to understand the dosing/scheduling of rapalogue/αPD-1 combinations (NCT02423954, and NCT02890069, clinicaltrials.gov), with a view to understand potential combinatorial benefit. However, caution must be taken when extending the conclusions of such studies beyond rapalogue treatment, as clinically important differentiation from mTOR kinase inhibitors may be expected. Nevertheless, our data predicts that combinatorial benefit of mTOR inhibitors may extend to additional immune-checkpoint blocking antibodies or other immune-potentiating therapies beyond PD-1. Moreover, we identify biomarkers (IL-10:IL-12 ratio, non-exhausted effector T-cell accumulation, IFNγ production) that may be directly relevant to assess clinical outcomes of mTORi/immune checkpoint combinations.
Materials and methods
Media, reagents and inhibitors
Hanks Balanced Salt Solution (HBSS) was supplemented with 2% FCS and 5mM HEPES (Gibco), complete RPMI (cRPMI) refers to RPMI supplemented with 10% FCS, non-essential amino acids (Thermo Fisher Scientific, 1X concentration), Sodium pyruvate (1 mM), glutamine (4 mM), penicillin and streptomycin (Sigma Aldrich, 1X), 2-mercaptoethanol (50 μM) and HEPES (2 mM). Cell purification buffer consisted of PBS containing 2% FCS and 2mM EDTA.
Rapamycin was purchased from Selleck chemicals, and all other inhibitors were synthesized in-house and stored in DMSO under anoxic conditions (Sigma). LPS-EB was purchased from invivogen and resuspended in dH2O. Recombinant murine IL-2 and IL-7 were purchased from peprotech. α-mouse IL-2 neutralizing antibody (clone JES6-1A12) was purchased from eBioscience.
Mice
Male or female BALB/c, C57BL-6 and nude mice were purchased from Envigo and housed under specific pathogen free conditions at the CRUK Cambridge institute animal facility. All procedures were carried out in accordance with UK home office regulations and with approved institutional guidelines.
CT-26 (5x10⁶ cells/mouse) or MC-38 (5x10⁶ cells/mouse) tumour cells were implanted subcutaneously (s.c.) in the left flank of female mice. Four days (CT-26) or one day (MC-38) after implantation mice were randomised by body weight and dosed dosed at 15 mg/kg daily p.o. with vistusertib in 1% Polysorbate and 20 mg/kg 2 times a week, i.p. with anti- CTLA-4 (9D9) IgG1, or 10 mg/kg 2 times a week with anti-PD-L1 (D265A) IgG1 in PBS. At end of study tumour tissues were then transferred into the gentleMACS C Tube containing RPMI. Tumour samples were processed using the mouse tumour dissociation kit from Miltenyi Biotec. Cells were liberated from tumours for downstream application using a mouse tumour dissociation kit and octodissociator (Miltenyi) according to manufacturer's instructions.
Plasma pharmacokinetic analysis of vistusertib concentrations was performed as previously described.Citation6
Flow cytometry
The following fluorophore-conjugated antibodies were used in this study: αCD45-Brilliant violet® (BV)786 (30-F11), αCD8α-APC or Brilliant violet® (BV)650 (53-6.7 CD4- Brilliant violet® (BV)711 (RM4-5), NKp46 Brilliant violet® (BV)605 (29A140, αPD-1-Brilliant violet® (BV)421 (29F.1.A12), αGranzyme B-PE (GB12), αCD25-PeCy7 (BC96), Foxp3-APC (FJK-16S), αCD3ϵ-Brilliant UV® (BUV)395 (17A2) CD69-PE (H1.2F3), CD62L PE-CF594 (MEL14), CD44-BUV737 (IM7), Ki67-Alexa488 (11F6), CD5-FITC (53-7.3), phospho-S6(ser240/244)-Alexa647, (Cell signaling technologies cat. #2215), phospho-Akt(ser473)-PE (M89-61), phospho-4Ebp1(Thr36/45)-PE (M31-16), Bcl2-PE (clone BCL/10C4), IFNγ-FITC (Clone XMG1.2). All antibodies were purchased from Biolegend, eBioscience, BD or Cell signaling technology. Cells were stained with a viability marker (Live/Dead Aqua®, Thermofisher scientific) according to manufacturer's instructions, and stained for surface/intracellular markers as described previously.Citation28
CellTrace Violet (CTV) labelling was performed in PBS containing 0.05% BSA and 1.6 μM CTV for 10 minutes at 37°C. CTV was then quenched following two washes with ice cold MACS buffer. Detection of phospho-specific antibodies was performed following a 25’ stimulation of T-cells at 37°C. Cells were fixed for 10’ at 37°C with BD phosflow fixation buffer I, permeabilized for 30’ on ice with pre-chilled (-20°C) BD phosflow perm buffer III, and stained for 40’ on ice with BD phosflow perm/wash buffer I, according to manufacturer's instructions. For detection of intracellular IFNγ, single cell suspensions were derived from tumours and subsequently restimulated with 100ng/mL PMA, 1 μg/mL Ionomycin, 1X golgi stop (BD) and 1X golgi plug (BD) in cRPMI (3.5h, 37°C, 5% CO2), before fixation/permeabiliation with a cytofix/cytoperm kit (BD) according to manufacturer's instructions.
Samples were filtered through 40 μm cell strainers and acquired on a BD LSRFortessa cytometer. Downstream analysis was performed using FlowJo software (V10) and viSNE (Cytobank) high-dimensional, single-cell analysis.Citation21
Immunohistochemistry
Immunohistochemical analysis of paraffin-embedded CT-26 tumours were performed with Phospho-Akt (Ser473) clone 736E11 (Cell Signaling Technology). Cytoplasmic staining was quntified using Aperio Imangescope (Leica Byosystems).
Cytokine quantitation
ELISA quantification of IL-10, IL-12p40, IL-12p70, IL-6 and TNF was performed using BD OptEIA ELISA kits according to manufacturer's instructions. Meso Scale Discovery (MSD) analysis was performed using an MSD V-PLEX Mouse Cytokine 19-Plex kit according to manufacturer's instructions. IFNγ was quantified in tumour aqueous extract using a LEGENDplex™ kit (Biolegend).
Cell culture
Bone marrow DCs (BMDCs) were generated and cultured as described previously.Citation28
Naïve CD8 T-cells were purified from splenocytes using an EasySep™ Mouse Naïve CD8+ T Cell Isolation Kit (Stemcell Technologies) and cell purification buffer, according to manufacturer's instructions. T-cells were cultured in cRPMI at 2.5-5x10⁵ cells/mL in a 96-well plate. Cells were activated with 1 μg/mL plate bound αCD3ϵ (145.2C11) and 1 μg/mL soluble αCD28 (37.51), or with Dynabeads® mouse T-cell activator beads (1:1 bead:cell ratio) at 37°C in a humidified incubator (5% CO2).
Gene profiling and analysis
Total RNA was isolated from snap frozen tissue and cells using Qiashredder and Qiazol Lysis Buffer on Qiacube-HT following the RNeasy 96 QIAcube HT total RNA cell with DNase protocol according to manufacturer's instructions (Qiagen). Reverse transcription was performed from 50ng of total RNA (Thermo Scientific #4374967) and further pre-amplified (Thermo Scientific #4488593; 14 cycles) using a pool of TaqMan primers (listed in Table S1), following the manufacturer's instructions (Thermo Scientific), and further run on a 96.96 Fluidigm Dynamic array on the Biomark according to the manufacturer's instructions (Fluidigm). Data was collected and analysed using Fluidigm Real-Time PCR Analysis 2.1.1 providing Ct values. All gene expression calculations were performed in Jmp®13.0.1, and data represented in TIBCO™ Spotfire® 6.5.2 or GraphPrism®. Ct values were normalised to the average of housekeeping genes (dCt), and all treatment group compared (subtracted) to the average control group (-ddCt) and Fold Change was calculated by taking 2-ddCt. Statistical analysis of gene expression data (-ddCt) was performed in Jmp®13.0.1, using a pairwise Student's t-test, which identify genes significantly modulated compared to control.
Statistics
Error bars relate to SEM unless indicated in Fig. legends. Appropriate statistical testing was performed using Graphpad Prism (v7). Statistical significance is indicated as follows: * p ≤ 0.05, ** p ≤ 0.01, *** p ≤ 0.001, **** p ≤ 0.0001. Proliferation index refers to the mean number of cell divisions, and was calculated as previously described.Citation55,Citation56
Disclosure of potential conflicts of interest
The authors are employed by AstraZeneca. There are no other potential conflicts of interest to declare.
2018ONCOIMM0254-file002.docx
Download MS Word (892.2 KB)Acknowledgments
We thank the AstraZeneca UK in vivo and PD groups for support with tumour models, provision of primary tissues and flow cytometric analysis and members of the UK I/O group for critical discussion of the manuscript.
References
- Postow MA, Callahan MK, Wolchok JD. Immune Checkpoint Blockade in Cancer Therapy. J Clin Oncol: official journal of the American Society of Clinical Oncology. 2015;33(17):1974–82. doi:10.1200/JCO.2014.59.4358. PMID:25605845.
- Pitt JM, Vetizou M, Daillere R, Roberti MP, Yamazaki T, Routy B, Lepage P, Boneca IG, Chamaillard M, Kroemer G, et al. Resistance Mechanisms to Immune-Checkpoint Blockade in Cancer: Tumor-Intrinsic and -Extrinsic Factors. Immunity. 2016;44(6):1255–69. doi:10.1016/j.immuni.2016.06.001. PMID:27332730.
- Thomas HE, Mercer CA, Carnevalli LS, Park J, Andersen JB, Conner EA, Tanaka K, Matsutani T, Iwanami A, Aronow BJ, et al. mTOR inhibitors synergize on regression, reversal of gene expression, and autophagy in hepatocellular carcinoma. Sci Transl Med. 2012;4(139):139ra84. doi:10.1126/scitranslmed.3003923. PMID:22539746.
- Altomare DA, Wang HQ, Skele KL, De Rienzo A, Klein-Szanto AJ, Godwin AK, Testa JR. AKT and mTOR phosphorylation is frequently detected in ovarian cancer and can be targeted to disrupt ovarian tumor cell growth. Oncogene. 2004;23(34):5853–7. doi:10.1038/sj.onc.1207721. PMID:15208673.
- Ezell SA, Wang S, Bihani T, Lai Z, Grosskurth SE, Tepsuporn S, Davies BR, Huszar D, Byth KF. Differential regulation of mTOR signaling determines sensitivity to AKT inhibition in diffuse large B cell lymphoma. Oncotarget. 2016;7(8):9163–74. doi:10.18632/oncotarget.7036. PMID:26824321.
- Guichard SM, Curwen J, Bihani T, D'Cruz CM, Yates JW, Grondine M, Howard Z, Davies BR, Bigley G, Klinowska T. AZD2014, an Inhibitor of mTORC1 and mTORC2, Is Highly Effective in ER+ Breast Cancer When Administered Using Intermittent or Continuous Schedules. Mol Cancer Ther. 2015;14(11):2508–18. doi:10.1158/1535-7163.MCT-15-0365. PMID:26358751.
- Dumont FJ, Staruch MJ, Koprak SL, Melino MR, Sigal NH. Distinct mechanisms of suppression of murine T cell activation by the related macrolides FK-506 and rapamycin. J. Immunol. 1990;144(1):251–8.
- Kreis H, Cisterne JM, Land W, Wramner L, Squifflet JP, Abramowicz D, Morales JM, Grinyo JM, Mourad G, Berthoux FC, et al. Sirolimus in association with mycophenolate mofetil induction for the prevention of acute graft rejection in renal allograft recipients. Transplantation. 2000;69(7):1252–60. doi:10.1097/00007890-200004150-00009. PMID:10798738.
- Powell JD, Pollizzi KN, Heikamp EB, Horton MR. Regulation of immune responses by mTOR. Annu Rev Immunol. 2012;30:39–68. doi:10.1146/annurev-immunol-020711-075024. PMID:22136167.
- Sukhbaatar N, Hengstschlager M, Weichhart T. mTOR-Mediated Regulation of Dendritic Cell Differentiation and Function. Trends in immunology. 2016;37(11):778–89. doi:10.1016/j.it.2016.08.009. PMID:27614799.
- Chaoul N, Fayolle C, Desrues B, Oberkampf M, Tang A, Ladant D, Leclerc C. Rapamycin Impairs Antitumor CD8+ T-cell Responses and Vaccine-Induced Tumor Eradication. Cancer Res. 2015;75(16):3279–91. doi:10.1158/0008-5472.CAN-15-0454. PMID:26122844.
- Moore EC, Cash HA, Caruso AM, Uppaluri R, Hodge JW, Van Waes C, Allen CT. Enhanced Tumor Control with Combination mTOR and PD-L1 Inhibition in Syngeneic Oral Cavity Cancers. Cancer Immunol Res. 2016;4(7):611–20. doi:10.1158/2326-6066.CIR-15-0252. PMID:27076449.
- Pollizzi KN, Patel CH, Sun IH, Oh MH, Waickman AT, Wen J, Delgoffe GM, Powell JD. mTORC1 and mTORC2 selectively regulate CD8(+) T cell differentiation. J Clin Invest. 2015;125(5):2090–108. doi:10.1172/JCI77746. PMID:25893604.
- Thoreen CC, Kang SA, Chang JW, Liu Q, Zhang J, Gao Y, Reichling LJ, Sim T, Sabatini DM, Gray NS. An ATP-competitive mammalian target of rapamycin inhibitor reveals rapamycin-resistant functions of mTORC1. J Biol Chem. 2009;284(12):8023–32. doi:10.1074/jbc.M900301200. PMID:19150980.
- Liu Q, Kirubakaran S, Hur W, Niepel M, Westover K, Thoreen CC, Wang J, Ni J, Patricelli MP, Vogel K, et al. Kinome-wide selectivity profiling of ATP-competitive mammalian target of rapamycin (mTOR) inhibitors and characterization of their binding kinetics. J Biol Chem. 2012;287(13):9742–52. doi:10.1074/jbc.M111.304485. PMID:22223645.
- Choo AY, Yoon SO, Kim SG, Roux PP, Blenis J. Rapamycin differentially inhibits S6Ks and 4E-BP1 to mediate cell-type-specific repression of mRNA translation. Proc Natl Acad Sci U S A. 2008;105(45):17414–9. doi:10.1073/pnas.0809136105. PMID:18955708.
- Mosely SI, Prime JE, Sainson RC, Koopmann JO, Wang DY, Greenawalt DM, Ahdesmaki MJ, Leyland R, Mullins S, Pacelli L, et al. Rational Selection of Syngeneic Preclinical Tumor Models for Immunotherapeutic Drug Discovery. Cancer Immunol Res. 2017;5(1):29–41. doi:10.1158/2326-6066.CIR-16-0114. PMID:27923825.
- Zhang B, Halder SK, Zhang S, Datta PK. Targeting transforming growth factor-beta signaling in liver metastasis of colon cancer. Cancer letters. 2009;277(1):114–20. doi:10.1016/j.canlet.2008.11.035. PMID:19147275.
- Ihle NT, Lemos R, Jr., Wipf P, Yacoub A, Mitchell C, Siwak D, Mills GB, Dent P, Kirkpatrick DL, Powis G, et al. Mutations in the phosphatidylinositol-3-kinase pathway predict for antitumor activity of the inhibitor PX-866 whereas oncogenic Ras is a dominant predictor for resistance. Cancer Res. 2009;69(1):143–50. doi:10.1158/0008-5472.CAN-07-6656. PMID:19117997.
- Di Nicolantonio F, Arena S, Tabernero J, Grosso S, Molinari F, Macarulla T, Russo M, Cancelliere C, Zecchin D, Mazzucchelli L, et al. Deregulation of the PI3K and KRAS signaling pathways in human cancer cells determines their response to everolimus. J Clin Invest. 2010;120(8):2858–66. doi:10.1172/JCI37539. PMID:20664172.
- Amir E, Freedman O, Carlsson L, Dranitsaris G, Tomlinson G, Laupacis A, Tannock IF, Clemons M. Randomized feasibility study of de-escalated (every 12 wk) versus standard (every 3 to 4 wk) intravenous pamidronate in women with low-risk bone metastases from breast cancer. Am J Clin Oncol. 2013;36(5):436–42. doi:10.1097/COC.0b013e3182568f7a. PMID:22781385.
- Wei SC, Levine JH, Cogdill AP, Zhao Y, Anang NAS, Andrews MC, Sharma P, Wang J, Wargo JA, Pe'er D, et al. Distinct Cellular Mechanisms Underlie Anti-CTLA-4 and Anti-PD-1 Checkpoint Blockade. Cell. 2017;170(6):1120−33 e17. doi:10.1016/j.cell.2017.07.024.
- Ikeda H, Old LJ, Schreiber RD. The roles of IFN gamma in protection against tumor development and cancer immunoediting. Cytokine & growth factor reviews. 2002;13(2):95–109. doi:10.1016/S1359-6101(01)00038-7.
- Fu T, He Q, Sharma P. The ICOS/ICOSL pathway is required for optimal antitumor responses mediated by anti-CTLA-4 therapy. Cancer Res. 2011;71(16):5445–54. doi:10.1158/0008-5472.CAN-11-1138. PMID:21708958.
- Amiel E, Everts B, Freitas TC, King IL, Curtis JD, Pearce EL, Pearce EJ. Inhibition of mechanistic target of rapamycin promotes dendritic cell activation and enhances therapeutic autologous vaccination in mice. J Immunol. 2012;189(5):2151–8. doi:10.4049/jimmunol.1103741. PMID:22826320.
- Ohtani M, Nagai S, Kondo S, Mizuno S, Nakamura K, Tanabe M, Takeuchi T, Matsuda S, Koyasu S. Mammalian target of rapamycin and glycogen synthase kinase 3 differentially regulate lipopolysaccharide-induced interleukin-12 production in dendritic cells. Blood. 2008;112(3):635–43. doi:10.1182/blood-2008-02-137430. PMID:18492954.
- Raich-Regue D, Fabian KP, Watson AR, Fecek RJ, Storkus WJ, Thomson AW. Intratumoral delivery of mTORC2-deficient dendritic cells inhibits B16 melanoma growth by promoting CD8(+) effector T cell responses. Oncoimmunology. 2016;5(6):e1146841. doi:10.1080/2162402X.2016.1146841. PMID:27471613.
- Sinclair C, Bommakanti G, Gardinassi L, Loebbermann J, Johnson MJ, Hakimpour P, Hagan T, Benitez L, Todor A, Machiah D, et al. mTOR regulates metabolic adaptation of APCs in the lung and controls the outcome of allergic inflammation. Science. 2017;357(6355):1014–21. doi:10.1126/science.aaj2155. PMID:28798047.
- Weichhart T, Costantino G, Poglitsch M, Rosner M, Zeyda M, Stuhlmeier KM, Kolbe T, Stulnig TM, Hörl WH, Hengstschläger M, et al. The TSC-mTOR signaling pathway regulates the innate inflammatory response. Immunity. 2008;29(4):565–77. doi:10.1016/j.immuni.2008.08.012. PMID:18848473.
- Carrabba MG, Castelli C, Maeurer MJ, Squarcina P, Cova A, Pilla L, Renkvist N, Parmiani G, Rivoltini L. Suboptimal activation of CD8(+) T cells by melanoma-derived altered peptide ligands: role of Melan-A/MART-1 optimized analogues. Cancer Res. 2003;63(7):1560–7. PMID:12670905.
- Auphan-Anezin N, Verdeil G, Schmitt-Verhulst AM. Distinct thresholds for CD8 T cell activation lead to functional heterogeneity: CD8 T cell priming can occur independently of cell division. J Immunol. 2003;170(5):2442–8. doi:10.4049/jimmunol.170.5.2442.
- Boyman O, Cho JH, Sprent J. The role of interleukin-2 in memory CD8 cell differentiation. Adv Exp Med Biol. 2010;684:28–41. doi:10.1007/978-1-4419-6451-9_3. PMID:20795538.
- Boyman O, Sprent J. The role of interleukin-2 during homeostasis and activation of the immune system. Nat Rev Immunol. 2012;12(3):180–90. doi:10.1038/nri3156. PMID:22343569.
- Smith K, Seddon B, Purbhoo MA, Zamoyska R, Fisher AG, Merkenschlager M. Sensory adaptation in naive peripheral CD4 T cells. J Exp Med. 2001;194(9):1253–61. doi:10.1084/jem.194.9.1253. PMID:11696591.
- Saini M, Sinclair C, Marshall D, Tolaini M, Sakaguchi S, Seddon B. Regulation of Zap70 expression during thymocyte development enables temporal separation of CD4 and CD8 repertoire selection at different signaling thresholds. Science signaling. 2010;3(114):ra23. doi:10.1126/scisignal.2000702. PMID:20332428.
- Araki K, Turner AP, Shaffer VO, Gangappa S, Keller SA, Bachmann MF, Larsen CP, Ahmed R. mTOR regulates memory CD8 T-cell differentiation. Nature. 2009;460(7251):108–12. doi:10.1038/nature08155. PMID:19543266.
- Sinclair C, Bains I, Yates AJ, Seddon B. Asymmetric thymocyte death underlies the CD4:CD8 T-cell ratio in the adaptive immune system. Proc Natl Acad Sci U S A. 2013;110(31):E2905−14. doi:10.1073/pnas.1304859110. PMID:23858460.
- Pearson C, Silva A, Saini M, Seddon B. IL-7 determines the homeostatic fitness of T cells by distinct mechanisms at different signalling thresholds in vivo. Eur J Immunol. 2011;41(12):3656–66. doi:10.1002/eji.201141514. PMID:21932447.
- Lode HN, Xiang R, Duncan SR, Theofilopoulos AN, Gillies SD, Reisfeld RA. Tumor-targeted IL-2 amplifies T cell-mediated immune response induced by gene therapy with single-chain IL-12. Proc Natl Acad Sci U S A. 1999;96(15):8591–6. doi:10.1073/pnas.96.15.8591. PMID:10411920.
- Rosenberg SA. IL-2: the first effective immunotherapy for human cancer. J Immunol. 2014;192(12):5451–8. doi:10.4049/jimmunol.1490019.
- Wang Y, Wang XY, Subjeck JR, Shrikant PA, Kim HL. Temsirolimus, an mTOR inhibitor, enhances anti-tumour effects of heat shock protein cancer vaccines. Br J Cancer. 2011;104(4):643–52. doi:10.1038/bjc.2011.15. PMID:21285988.
- Pedicord VA, Cross JR, Montalvo-Ortiz W, Miller ML, Allison JP. Friends not foes: CTLA-4 blockade and mTOR inhibition cooperate during CD8+ T cell priming to promote memory formation and metabolic readiness. J Immunol. 2015;194(5):2089–98. doi:10.4049/jimmunol.1402390.
- Ezell SA, Mayo M, Bihani T, Tepsuporn S, Wang S, Passino M, Grosskurth SE, Collins M, Parmentier J, Reimer C, et al. Synergistic induction of apoptosis by combination of BTK and dual mTORC1/2 inhibitors in diffuse large B cell lymphoma. Oncotarget. 2014;5(13):4990–5001. doi:10.18632/oncotarget.2071.
- Ruffell B, Chang-Strachan D, Chan V, Rosenbusch A, Ho CM, Pryer N, Daniel D, Hwang ES, Rugo HS, Coussens LM. Macrophage IL-10 blocks CD8+ T cell-dependent responses to chemotherapy by suppressing IL-12 expression in intratumoral dendritic cells. Cancer cell. 2014;26(5):623–37. doi:10.1016/j.ccell.2014.09.006. PMID:25446896.
- Jacobs N, Giannini SL, Doyen J, Baptista A, Moutschen M, Boniver J, Delvenne P. Inverse modulation of IL-10 and IL-12 in the blood of women with preneoplastic lesions of the uterine cervix. Clin Exp Immunol. 1998;111(1):219–24. doi:10.1046/j.1365-2249.1998.00437.x. PMID:9472685.
- Knutson KL, Disis ML. IL-12 enhances the generation of tumour antigen-specific Th1 CD4 T cells during ex vivo expansion. Clin Exp Immunol. 2004;135(2):322–9. doi:10.1111/j.1365-2249.2004.02360.x. PMID:14738463.
- Grayson JM, Zajac AJ, Altman JD, Ahmed R. Cutting edge: increased expression of Bcl-2 in antigen-specific memory CD8+ T cells. J Immunol. 2000;164(8):3950–4. doi:10.4049/jimmunol.164.8.3950.
- Mannick JB, Del Giudice G, Lattanzi M, Valiante NM, Praestgaard J, Huang B, Lonetto MA, Maecker HT, Kovarik J, Carson S, et al. mTOR inhibition improves immune function in the elderly. Sci Transl Med. 2014;6(268):268ra179. doi:10.1126/scitranslmed.3009892. PMID:25540326.
- Johnson SC, Rabinovitch PS, Kaeberlein M. mTOR is a key modulator of ageing and age-related disease. Nature. 2013;493(7432):338–45. doi:10.1038/nature11861. PMID:23325216.
- Jung CH, Ro SH, Cao J, Otto NM, Kim DH. mTOR regulation of autophagy. FEBS letters. 2010;584(7):1287–95. doi:10.1016/j.febslet.2010.01.017. PMID:20083114.
- Xu X, Araki K, Li S, Han JH, Ye L, Tan WG, Konieczny BT, Bruinsma MW, Martinez J, Pearce EL, et al. Autophagy is essential for effector CD8(+) T cell survival and memory formation. Nat immunol. 2014;15(12):1152–61. doi:10.1038/ni.3025. PMID:25362489.
- Gotwals P, Cameron S, Cipolletta D, Cremasco V, Crystal A, Hewes B, Mueller B, Quaratino S, Sabatos-Peyton C, Petruzzelli L, et al. Prospects for combining targeted and conventional cancer therapy with immunotherapy. Nat Rev Cancer. 2017;17(5):286–301. doi:10.1038/nrc.2017.17. PMID:28338065.
- Zeng, H. mTOR signaling in immune cells and its implications for cancer immunotherapy. Cancer letters. 2017;408:182–189.
- Kirchner GI, Meier-Wiedenbach I, Manns MP. Clinical pharmacokinetics of everolimus. Clinical pharmacokinetics. 2004;43(2):83–95. doi:10.2165/00003088-200443020-00002. PMID:14748618.
- Lyons AB, Parish CR. Determination of lymphocyte division by flow cytometry. J Immunol Methods. 1994;171(1):131–7. doi:10.1016/0022-1759(94)90236-4. PMID:8176234.
- Lyons AB. Analysing cell division in vivo and in vitro using flow cytometric measurement of CFSE dye dilution. J Immunol Methods. 2000;243(1-2):147–54. doi:10.1016/S0022-1759(00)00231-3. PMID:10986412.