
ABSTRACT
The immune system avoids oncogenesis and slows down tumor progression through a mechanism called immunosurveillance. Nevertheless, some malignant cells manage to escape from immune control and form clinically detectable tumors. Tetraploidy, which consists in the intrinsically unstable duplication of the genome, is considered as a (pre)-cancerous event that can result in aneuploidy and contribute to oncogenesis. We previously described the fact that tetraploid cells can be eliminated by the immune system. Here, we investigate the role of different innate and acquired immune effectors by inoculating hyperploid cancer cells into wild type or mice bearing different immunodeficient genotypes (Cd1d−/−, FcRn−/−, Flt3l−/−, Foxn1nu/nu, MyD88−/−, Nlrp3−/−, Ighmtm1Cgn, Rag2−/−), followed by the monitoring of tumor incidence, growth and final ploidy status. Our results suggest that multiple different immune effectors including B, NK, NKT and T cells, as well as innate immune responses involving the interleukine-1 receptor and the Toll-like receptor systems participate to the immunoselection against hyperploid cells. Hence, optimal anticancer immunosurveillance likely involves the contribution of multiple arms of the immune system.
Introduction
The immunosurveillance concept was defined by Sir Macfarlane Burnet in 1970Citation1 as a mechanism through which the immune system eliminates or inactivates potentially dangerous cells. Liver fibrosis, ischemic damage to various tissues (such in the brain, heart, liver or kidneys), as well as neurodegenerative disorders (Alzheimer, Parkinson and Huntington disease) are subjected to immunosurveillance. However, the role of the immune system is best studied in the context of the suppression of oncogenesis and the control of tumor progression.Citation2
Anticancer immunosurveillance can be didactically divided into three phases, namely (i) elimination, (ii) equilibrium and (iii) escape. During the elimination phase, potentially oncogenic, pre-malignant cells are destroyed and no tumors are detectable. During the equilibrium state, a smoldering inflammatory/immune response occurs in subclinical tumors, confronting malignant cells and leukocytes in a continuous battle. It is only upon escape of cancer cells from immune control that clinically detectable and potentially lethal cancers develop.Citation3
Both genomic instability and immune evasion are hallmarks of cancer.Citation4 One cause of genomic instability is tetraploidy (cells with a duplicated set of chromosomes), which favors aberrant mitoses leading to asymmetric cell divisions with the consequent generation of aneuploid cells (cells with abnormal numbers of chromosomes), as they are characteristic of malignant cancers.Citation5 An ever-expanding literature places tetraploidy at the early steps of carcinogenesis,Citation6-Citation14 coinciding with the elimination step of the cancer immunosurveillance process.Citation3,Citation15,Citation16 As a matter of fact, immunosurveillance failure leads to the accumulation of hyperploid cells in different murine carcinogenesis models as well as in patients with breast cancer that fail to respond to neoadjuvant chemotherapy.Citation17 The mechanism through which hyperploid cells are recognized by the immune system implies constitutive endoplasmic reticulum stress resulting in the exposure of the ‘eat-me’ signal calreticulin (CALR) at the cell surface. Thus, hyperploid cells fail to form tumors or form slowly-growing cancers in mice, unless such animals bear a severely immunocompromised phenotype. Immunoselected (but not unselected) tumors forming from initially hyperploid cells exhibit a reduced DNA content and a diminished CALR exposureCitation17-Citation19 thus losing their immunogenicity.Citation17 Along the same lines, it has been recently reported that aneuploidy correlates with immune evasion markers in melanoma patients treated with anti- cytotoxic T lymphocyte – associated protein 4 (CTLA-4) therapy.Citation20
It is known that CD4+ and CD8+ T lymphocytes, the interferon systemCitation17 and NK cellsCitation21 are involved in the control of hyperploidy and (pre-)malignant cells.Citation22-Citation25 Here, we investigated the role of a wide range of immunodeficiencies to shed light on the complete immune cell mechanism involved in the recognition and elimination of hyperploid cancer cells.
Materials and methods
Reagents
Unless otherwise indicated, media and supplements for cell culture were purchased from Gibco-Invitrogen (Carlsbad, CA, USA), plasticware from Corning B.V. Life Sciences (Schiphol-Rijk, The Netherlands), and chemicals from Sigma-Aldrich (St Louis, MO, USA).
Cell lines and culture conditions
All cell lines were cultured at 37ºC under 5% of CO2, in the appropriate medium containing 10% fetal bovine serum (FBS) and 100 U mL-1 penicillin sodium and 100 μg mL-1 streptomycin sulfate. Cell type-specific culture conditions include: RPMI 1640 medium supplemented as above plus 1 mM sodium pyruvate and 1 mM HEPES buffer for murine fibrosarcoma MCA205 cells; RPMI 1640 medium supplemented with 10% FBS, 100 U mL-1 penicillin sodium, 1 mM sodium pyruvate, 1 mM HEPES buffer and 1 mM non-essential amino acids for murine lymphoma EL4 cell line.
Generation of hyperploid clones
Parental MCA and EL4 cells were treated for 48 h with 100 nM nocodazole and then cultured for 2 weeks in drug-free culture medium, followed by cloning of cells characterized by an 8n DNA content, as previously described.Citation17,Citation26
Mice
Mice were maintained in specific pathogen-free conditions, and in specific pathogen-free conditions in a temperature-controlled environment with 12 h light, 12 h dark cycles and received food and water ad libitum. Experiments followed the Federation of European Laboratory Animal Science Association (FELASA) guidelines. Protocol nº APAFIS#5251-2016050409384642v2 for animal experimentation followed the EU Directive 63/2010 and was approved by the Ethical Committee of the Gustave Roussy Campus Cancer (GR, Villejuif, France) (CEEA IRCIV/IGR n° 26, registered at the French Ministry of Research) and the French Ministry of Research. Seven-week-old female wild-type (WT) C57BL/6 mice, or Rag2−/−, FcRn−/−, Foxn1nu/nu, MyD88−/−, CD1d−/−, Ighmtm1Cgn, and Nlrp3−/− mice were obtained from Charles River Laboratories (Saint- Germain sur l'Arbresle, France). Flt3l−/− mice were purchased to Taconic Europe (Silkeborg, Denmark).
Tumorigenicity assays
For tumorigenicity assays, 5 × 10⁵ parental and hyperploid cells (Supplementary ) were injected (in 0.2 mL of PBS) subcutaneously into the mice at day 0. To inhibit IL-1 effects, mice were treated with the recombinant form of human IL-1 receptor antagonist (IL-1Ra) Anakinra (brand name Kineret)Citation27 (0.5 mg mL−1 in 0.2 mL of PBS) by intraperitoneal injection once per week. Tumor growth was routinely assessed by means of a caliper. Animals bearing neoplastic lesions that exceeded 20–25% of their body mass were euthanatized.
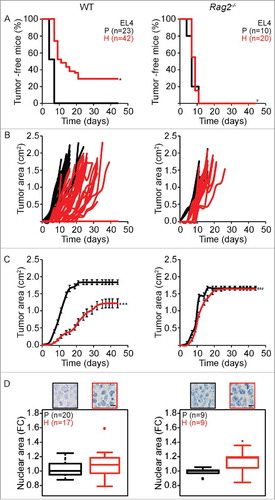
Figure 1. Tumor development characteristics of parental versus hyperploid MCA205 cells in WT and Rag2−/− mice. Parental and hyperploid MCA205 cells were inoculated into C57BL/6 or Rag2−/− mice. Tumor incidence (A) and tumor growth (B, independent mice, and C, average of all mice) were routinely monitored. Histological sections from parental and hyperploid tumors recovered from C57BL/6 mice, Rag2−/− mice were submitted to histochemical staining for the detection of nuclear area (D). Scale bar, 10 μm. Inserts in D show representative pictures. Box plots represent median values of nuclear areas (median applied to each mouse, normalized by the average of the parental median value). Tumor incidence was compared by one-tailed Barnard's test, tumor growth curves were analyzed with Wald test and nuclear area were compared by means of a linear mixed model (see Statistical Analysis in Materials and Methods). *p < 0.05 P vs H; ***p < 0.01 P vs H; ¥ p < 0.05 P vs WT; ## p < 0.01 H vs WT; ### p < 0.001 H vs WT. Error bars represent SEM over time.

Histology and immunohistochemistry
Samples from recovered tumors were fixed with 4% PFA for 4 h and then embedded into paraffin. Sections of 5 µm were stained with the Discovery Ultra automated IHC/ISH research slide staining system (Ventana Medical Systems – Roche Group, Tucson, AZ, USA). Heat-induced antigen retrieval in EDTA buffer (pH 8.0) for 32 min at 95°C and then a counterstain with Hematoxylin II for 12 min followed by Bluing Reagent for 8 min (Ventana Medical Systems – Roche Group, Tucson, AZ, USA). After staining, images were acquired with a Virtual Slides microscope VS120-SL (Olympus, Tokyo, Japan), 20X air objective (0.75 NA). VSI-code images were converted to the TIFF file format and analyzed by means of a morphometric analysis as previously described.Citation28
Statistical analysis
Tumor incidence was analyzed by one-tailed Barnard's test at the end point: parental vs hyperploid (P vs H) with “no lower tumor incidence in H” as H0; hyperploid into immunodeficient vs WT mice (H vs WT) with “no higher tumor incidence in immunodeficient mice” as H0. Tumor growth modeling was carried by linear mixed effect modeling on log pre-processed tumor surfaces and reported p values are obtained from Wald's test analysis for P vs H, parental into immunodeficient vs WT mice (P vs WT) and H vs WT. Statistical comparison of nuclear area was applied on the full set of distributions (Supplementary –5). Considering that the log10 of nuclear area depends on the DNA content of injected cells (parental / hyperploid cells), the mouse strain (WT, Rag2−/−, FcRn−/−, Foxn1nu/nu, MyD88−/−, CD1d−/−, Ighmtm1Cgn, Nlrp3−/− or Flt3l−/−) and the mouse replicate, we applied the following linear mixed model: (LogArea ∼ DNA content / Mouse, random = ∼ 1 | Mouse_Replicate), by using the ‘lme’ function of ‘nlme’ package in R (https://CRAN.R-project.org/package = nlme.); p-values are the ones associated with the mouse dependent ‘DNA content’ coefficients.
Figure 2. Tumor development characteristics of parental versus hyperploid EL4 cells in WT and Rag2−/− mice. Parental and hyperploid EL4 cells were inoculated into C57BL/6 or Rag2−/− mice. Tumor incidence (A) and tumor growth (B, independent mice, and C, average of all mice) were routinely monitored. Histological sections from parental and hyperploid tumors recovered from C57BL/6 mice, Rag2−/− mice were submitted to histochemical staining for the detection of nuclear area (D). Scale bar, 10 μm. Inserts in D show representative pictures. Box plots represent median values of nuclear areas (median applied to each mouse, normalized by the average of the parental median value). Tumor incidence was compared by one-tailed Barnard's test, tumor growth curves were analyzed with Wald test and normalized nuclear area were compared by means of a linear mixed model (see Statistical Analysis in Materials and Methods). *p < 0.05 P vs H; ***p < 0.001 P vs H; # p < 0.001 H vs WT; ### p < 0.001 H vs WT. Error bars represent SEM over time.
Results and discussion
Comparison of the growth of parental and hyperploid cancer cells in WT and Rag2−/− mice
Parental or hyperploid fibrosarcoma MCA205 cells were inoculated subcutaneously (s.c.) into adult female wild type (WT) C57BL/6 and Rag2−/− mice. As to be expected,Citation28 parental cells developed tumors in all mice 10 to 12 days after injection, irrespective of the genotype of the recipients. Hyperploid cells readily developed into tumors when inoculated into Rag2−/− mice, which lack mature B or T lymphocytes.Citation29 In Rag2−/− mice, no difference could be detected in the growth of parental and hyperploid MCA205 tumors. In sharp contrast, hyperploid MCA205 cells failed to form tumors in 3 out of 5 immunocompetent C57BL/6 mice (). In the two animals in which tumors developed from hyperploid MCA205 cells, tumors developed late, with a latency of more than 40 days and grew slowly (). All tumors that arose in WT or Rag2−/− mice were excised and embedded into paraffin to determine the nuclear area as a proxy of the ploidy status.Citation28 Tumors arising from hyperploid MCA205 cells in Rag2−/− mice had larger nuclei than cancers arising from parental MCA205 cells. This apparent difference in ploidy was not observed for tumors arising from parental and hyperploid MCA205 cells in immunocompetent C57BL/6 mice ().
We performed a similar analysis on EL4 lymphoma cells that were left in their normal state or rendered hyperploid and injected into immunocompetent WT or T and B lymphocyte-deficient Rag2−/− mice. Hyperploid EL4 cells led to the generation of s.c. tumors in all (20 out of 20) Rag2−/− mice, and these tumors formed at the same speed and proliferated at the same rate as parental EL4 cells. In contrast, hyperploid EL4 cells only formed tumors in 71% (30 out of 42) of WT mice, while parental EL4 cells generated tumors in 100% (23 out of 23) of WT mice (). Again, hyperploid EL4 cells formed delayed and slowly growing tumors in WT mice (). Histological examination of EL4 tumors arising in Rag2−/− mice revealed the persistence of the difference in ploidy for parental versus hyperploid EL4 cells. This difference in the normalized nuclear area was lost for EL4 tumors arising from parental and hyperploid EL4 cells in immunocompetent WT mice ().
Altogether, these results support the notion that hyperploid cells are recognized by the adaptive cellular immune system, thus reducing the probability that cancers can be formed by such cells. Moreover, when tumors formed under the selection pressure of the immune system, only cells that reduce their chromosomal content can survive and form tumors.
Immunoselection of hyperploid cancer cells in the context of different immunodeficiences
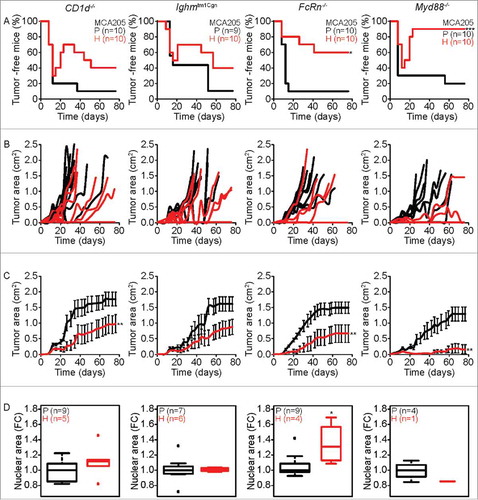
Prompted by the aforementioned results, we investigated the fate of hyperploid cancer cells in the context of different types of immunodeficiency affecting the innate or adaptive immune system. Parental and hyperploid MCA205 cells were inoculated into CD1d−/− mice lacking the glycoprotein CD1d expressed at the surface of NKT cellsCitation30; Ighmtm1Cgn mice missing the heavy chain of immunoglobulin (Ig) M antibody µ chain, causing the absence of B cellsCitation31; FcRn−/− mice deficient in the Fc receptor for IgG antibodiesCitation32; or Myd88−/− mice lacking the toll-like receptors (TLRs)-signaling adaptor MyD88.Citation33 Moreover, parental and hyperploid EL4 cells were injected into athymic Foxn1nu/nu (commonly known as nude) mice that lack mature T lymphocytesCitation34 and are characterized by an excessive NK cell functionCitation35; Flt3l−/− mice lacking the ligand for the receptor tyrosine kinase 3 (Flt3l) which show reduced numbers of hematopoietic myeloid and lymphoid progenitors, dendritic cells and NK cellsCitation36; WT mice treated with the IL1R antagonist Anakinra modulating interleukin 1 (IL-1), or Nlrp3−/− mice deficient for the NACHT, LRR and PYD domains-containing protein 3 (NLRP3), also called cryopyrin, which is part of the NLRP3 inflammasome complex and hence in the generation of mature IL-1β and IL-18.Citation37
Hyperploid MCA205 cells showed no significant difference in tumor incidence compared to their parental counterparts when inoculated into CD1d−/− and Ighmtm1Cgn mice, while in 60% and 90% of FcRn−/− and Myd88−/− mice, respectively, hyperploid MCA205 cells were not able to proliferate (). Intriguingly, no difference was found during the first 12 days between parental and hyperploid MCA205 tumor incidence in CD1d−/− , Ighmtm1Cgn and Myd88−/− . However, later a fraction of tumors spontaneously regressed in CD1d−/− , Ighmtm1Cgn and Myd88−/- mice (). With respect to tumor growth, hyperploid MCA205 cells appeared later and grew more slowly than their parental counterparts in CD1d−/−, FcRn−/− and Myd88−/− mice. There was also a tendency towards slower growth of hyperploid MCA205 cells in Ighmtm1Cgn mice (). Nonetheless, the immune systems of CD1d−/− , Ighmtm1Cgn and Myd88−/− mice was apparently able to eliminate hyperploid tumor cells because the difference in nuclear size between parental and hyperploid cells disappeared after passage of cancers in such mice. In contrast, this difference in ploidy persisted for tumors arising from parental and hyperploid cells in FcRn−/− ().
Figure 3. Characteristics of tumor development of parental versus hyperploid MCA205 cells in different immunodeficient mice. Parental and hyperploid MCA205 cells were inoculated into CD1d−/−, Ighmtm1Cgn , FcRn−/− or Myd88−/− mice. Tumor incidence (A) and tumor growth (B, independent mice, and C, average of all mice) were routinely monitored. Histological sections from parental and hyperploid tumors recovered from CD1d−/−, Ighmtm1Cgn , FcRn−/− and Myd88−/− mice were submitted to histochemical staining for the detection of nuclear area (D). Box plots represent median values of nuclear areas (median applied to each mouse, normalized by the average of the parental median value). Tumor incidence was compared by one-tailed Barnard's test, tumor growth curves were analyzed with Wald test and normalized nuclear area were compared by means of a linear mixed model (see Statistical Analysis in Materials and Methods). *p < 0.05 P vs H; **p < 0.01 P vs H; ***p < 0.001 P vs H. Error bars represent SEM over time.
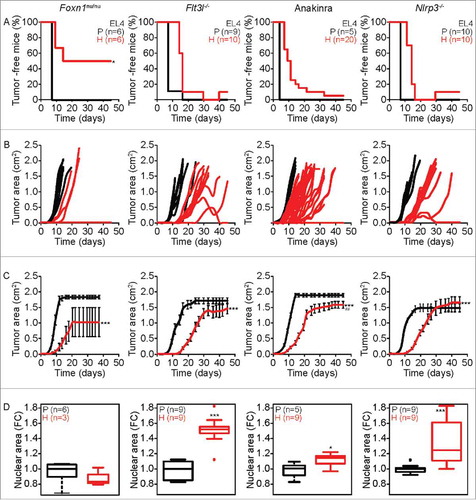
In nu/nu mice, hyperploid EL4 cells developed cancer only in 50% (3 out of 6) cases (), and such tumors developed with delayed and reduced growth kinetics as compared to wild type controls (). Moreover, the difference in ploidy between initially hyperploid and parental cells was lost after passage through Foxn1nu/nu mice (), pleading in favor of an intact immunosurveillance system. Hyperploid EL4 cells developed close-to-always tumors in Flt3l−/− mice, WT mice treated with Anakinra, as well as in Nlrp3−/− mice, contrasting with a delayed tumor manifestation and growth (compared to parental EL4 cells) in such mice (). Histological examination of parental and hyperploid EL4 tumors arising in Flt3l−/− mice, WT mice treated with Anakinra or Nlrp3−/− mice revealed the persistence of the difference in ploidy ().
Figure 4. Characteristics of tumor development of parental versus hyperploid EL4 cells in mice with different immunodeficiencies. Parental and hyperploid EL4 cells were inoculated into Foxn1nu/nu, Flt3l−/− , Nlrp3−/− mice or mice treated with the IL-1 receptor antagonist Anakinra. Tumor incidence (A) and tumor growth (B, independent mice, and C, average of all mice) were routinely monitored. Histological sections from parental and hyperploid tumors recovered from Foxn1nu/nu, Flt3l−/− , Nlrp3−/− mice or mice treated with Anakinra were submitted to histochemical staining for the detection of nuclear area (D). Box plots represent median values of nuclear areas (median applied to each mouse, normalized by the average of the parental median value). Tumor incidence was compared by one-tailed Barnard's test, tumor growth curves were analyzed with Wald test and normalized nuclear area were compared by means of a linear mixed model (see Statistical Analysis in Materials and Methods). *p < 0.05 P vs H; ***p < 0.001 P vs H; ## p < 0.01 H vs WT. Error bars represent SEM over time.
Concluding remarks
In this paper, we compared the effects of a complete absence of T/B-mediated immune response (induced by the Rag2−/− genotype) with other immunodeficiencies linked to other genotypes (Cd1d−/−, FcRn−/−, Flt3l−/−, Foxn1nu/nu, Ighmtm1Cgn MyD88−/−, Nlrp3−/− ) or long-term administration of the IL-1 antagonist anakinra on the immunoselection against hyperploid cancer cells. In Rag2−/− mice there were no signs of immunoselection against hyperploidy in the sense that hyperploid and parental cancer cells formed cancers at the same speed after inoculation, grew at the same rate and conserved their initial ploidy status. Similarly, in Flt3l−/−, Nlrp3−/− and Anakinra-treated WT mice, hyperploid cancers formed and remained hyperploid until large tumors were formed, although there was a delay in the growth of tumors arising from hyperploid compared to parental cells. Hence, the absence of Flt3l, Nlrp3 or the neutralization of IL-1 largely abolished the immunosurveillance against hyperploid cells, though not completely (because there was a still a delay in the growth of hyperploid tumors). The absence of Cd1d, Ighm, FcRn and Myd88 also partially compromised immunosurveillance against hyperploidy, either because tumors first developed and then regressed (a phenomenon not seen in fully immunocompetent mice, but seen in Cd1d−/−, Ighmtm1Cgn or Cd1d−/− mice) or because cancer cells maintained their hyperploid status (as this is the case for FcRn−/− mice). Nonetheless, the nuclear size of initially hyperploid cancer cells was reduced after passage through Cd1d−/−, Ighmtm1Cgn or Cd1d−/− mice and tumors formed less frequently in FcRn−/− mice, pleading in favor of some (though suboptimal) immunosurveillance against hyperploidy (). Interestingly, Foxn1nu/nu mice maintained characteristics of fully intact immunosurveillance suggesting that the NK system (or residual T cell functions) sufficed to assure the elimination of hyperploid cells.
Table 1 . Summary of results (p-values).
Considering tumor incidence as cell recognition and normalized nuclear area as cellular elimination and looking at the parameters characterizing tumor development after inoculation of parental and hyperploid MCA205 or EL4 cell lines (), we observed that Myd88−/− and Foxn1nu/nu mice behaved as WT mice meaning that their corresponding deficiencies were not involved in the recognition and elimination of hyperploid cells. Despite of their immunodeficiency, FcRn−/− mice seemed to recognize hyperploid cells but they failed to eliminate them all. Mice treated with Anakinra and, Flt3l−/− and Nlrp3−/− mice were not able to recognize nor to eliminate hyperploid cells similarly to Rag2−/− mice. Finally, CD1d−/− and Ighmtm1Cgn mice showed an intermediated behavior in the tumor incidence but eliminating the hyperploid cells.
In conclusion, the present results support the notion that multiple distinct innate and cognate immune effectors including myeloid cells, B, T, NK and NKT cells may contribute to the immunosurveillance against hyperploid cancer cells. Moreover, Toll- like receptors and/or interleukin-1 receptors (downstream of MyD88) and the interleukin-1 system (activated by NLRP3, neutralized by anakinra) apparently play some role in this immunosurveillance system, be it at the level of the configuration of a fully functional immune system, be it at the level of effector mechanisms that come into action when hyperploid cancer cells are inoculated into the organism. Altogether, these findings underscore the complexity of the immune system with respect to its functions in suppressing oncogenesis and controlling tumor progression.
Abbreviations
| CALR | = | calreticulin |
| CTLA-4 | = | cytotoxic T lymphocyte – associated protein 4 |
| DC | = | dendritic cell |
| FcRn | = | neonatal Fc receptor |
| FELASA | = | Federation of European Laboratory Animal Science Association |
| Flt3l | = | ligand for the receptor tyrosine kinase 3 |
| FBS | = | fetal bovine serum |
| Ig | = | immunoglobulin |
| IL-1 | = | interleukin 1 |
| IL-1Ra | = | interleukin 1 receptor antagonist |
| IL-18 | = | interleukin 18 |
| IL-2R | = | interleukin 2 receptor |
| IL-4 | = | interleukin 4 |
| IFN-γ | = | interferon gamma |
| MHC | = | major histocompatibility complex |
| NK | = | natural killer cell |
| NKT | = | natural killer T cell |
| NLRP3 | = | NACHT, LRR and PYD domains-containing protein 3 |
| RAG-2 | = | recombinase activating gene 2 |
| PBS | = | phosphate-buffered saline |
| PFA | = | paraformaldehyde |
| Th | = | T helper type |
| TH1 cells | = | CD4+ T helper cells expressing IFN-γ |
| TLR | = | toll-like receptors |
| WT | = | wild type. |
| γc | = | cytokine receptor γ chain |
Disclosure of potential conflicts of interest
No potential conflicts of interest were disclosed.
KONI_A_1463947_Suppl.zip
Download Zip (699.6 KB)Acknowledgments
GK is supported by the Comité de Charente-Maritime (équipe labelisée); Agence National de la Recherche (ANR) – Projets blancs; ANR under the frame of E-Rare-2, the ERA-Net for Research on Rare Diseases; Association pour la recherche sur le cancer (ARC); Cancéropôle Ile-de-France; Chancelerie des universités de Paris (Legs Poix), Fondation pour la Recherche Médicale (FRM); a donation by Elior; the European Commission (ArtForce); the European Research Council (ERC); Fondation Carrefour; Institut National du Cancer (INCa); Inserm (HTE); Institut Universitaire de France; LeDucq Foundation; the LabEx Immuno-Oncology; the RHU Torino Lumière; the Seerave Foundation; the SIRIC Stratified Oncology Cell DNA Repair and Tumor Immune Elimination (SOCRATE); the SIRIC Cancer Research and Personalized Medicine (CARPEM); and the Paris Alliance of Cancer Research Institutes (PACRI). LS is supported by the Institut national de la santé et de la recherche médicale (INSERM) and the Association pour la recherche sur le cancer (ARC) (PJA20151203519). We are indebted to Dr. Aitziber Buqué for her help in the analysis of tumor images. We appreciate the help from the Preclinical evaluation platform (PEP) in Gustave Roussy Campus Cancer, especially Dr. Patrick Gonin and Mrs. Olivia Bawa.
Additional information
Funding
References
- Burnet FM. The concept of immunological surveillance. Prog Exp Tumor Res. 1970;13:1–27. doi:10.1159/000386035. PMID:4921480.
- Senovilla L, Galluzzi L, Zitvogel L, Kroemer G. Immunosurveillance as a regulator of tissue homeostasis. Trends Immunol. 2013;34:471–81. doi:10.1016/j.it.2013.06.005. PMID:23891238.
- Dunn GP, Bruce AT, Ikeda H, Old LJ, Schreiber RD. Cancer immunoediting: From immunosurveillance to tumor escape. Nat Immunol. 2002;3:991–8. doi:10.1038/ni1102-991. PMID:12407406.
- Hanahan D, Weinberg RA. Hallmarks of cancer: The next generation. Cell. 2011;144:646–74. doi:10.1016/j.cell.2011.02.013. PMID:21376230.
- Vitale I, Galluzzi L, Castedo M, Kroemer G. Mitotic catastrophe: A mechanism for avoiding genomic instability. Nat Rev Mol Cell Biol. 2011;12:385–92. doi:10.1038/nrm3115. PMID:21527953.
- Olaharski AJ, Sotelo R, Solorza-Luna G, Gonsebatt ME, Guzman P, Mohar A, Eastmond DA. Tetraploidy and chromosomal instability are early events during cervical carcinogenesis. Carcinogenesis 2006;27:337–43. doi:10.1093/carcin/bgi218. PMID:16123119.
- Nguyen HG, Ravid K. Tetraploidy/aneuploidy and stem cells in cancer promotion: The role of chromosome passenger proteins. J Cell Physiol. 2006;208:12–22. doi:10.1002/jcp.20565. PMID:16331679.
- Fujiwara T, Bandi M, Nitta M, Ivanova EV, Bronson RT, Pellman D. Cytokinesis failure generating tetraploids promotes tumorigenesis in p53-null cells. Nature. 2005;437:1043–7. doi:10.1038/nature04217. PMID:16222300.
- Nguyen HG, Makitalo M, Yang D, Chinnappan D, St Hilaire C, Ravid K. Deregulated Aurora-B induced tetraploidy promotes tumorigenesis. FASEB J. 2009;23:2741–8. doi:10.1096/fj.09-130963. PMID:19332642.
- Pampalona J, Frias C, Genesca A, Tusell L. Progressive telomere dysfunction causes cytokinesis failure and leads to the accumulation of polyploid cells. PLoS Genet. 2012;8:e1002679. doi:10.1371/journal.pgen.1002679. PMID:22570622.
- Davoli T, de Lange T. Telomere-driven tetraploidization occurs in human cells undergoing crisis and promotes transformation of mouse cells. Cancer Cell. 2012;21:765–76. doi:10.1016/j.ccr.2012.03.044. PMID:22698402.
- Castedo M, Senovilla L, Vitale I, Kroemer G. Tetraploid cancer cell precursors in ovarian carcinoma. Cell Cycle. 2012;11:3157–8. doi:10.4161/cc.21722. PMID:22895170.
- Nicholson JM, Cimini D. Doubling the deck: Tetraploidy induces chromosome shuffling and cancer. Cell Cycle. 2012;11:3354–5. doi:10.4161/cc.21850. PMID:22918235.
- Davoli T, de Lange T. The causes and consequences of polyploidy in normal development and cancer. Annu Rev Cell Dev Biol. 2011;27:585–610. doi:10.1146/annurev-cellbio-092910-154234. PMID:21801013.
- Finn OJ. Immuno-oncology: Understanding the function and dysfunction of the immune system in cancer. Ann Oncol. 2012;23( Suppl 8): viii6–9. PMID:22100695.
- Zitvogel L, Galluzzi L, Smyth MJ, Kroemer G. Mechanism of action of conventional and targeted anticancer therapies: Reinstating immunosurveillance. Immunity. 2013;39:74–88. doi:10.1016/j.immuni.2013.06.014. PMID:23890065.
- Senovilla L, Vitale I, Martins I, Tailler M, Pailleret C, Michaud M, Galluzzi L, Adjemian S, Kepp O, Niso-Santano M, et al. An immunosurveillance mechanism controls cancer cell ploidy. Science. 2012;337:1678–84. doi:10.1126/science.1224922. PMID:23019653.
- Boileve A, Senovilla L, Vitale I, Lissa D, Martins I, Metivier D, van den Brink S, Clevers H, Galluzzi L, Castedo M, et al. Immunosurveillance against tetraploidization-induced colon tumorigenesis. Cell Cycle. 2013;12:473–9. doi:10.4161/cc.23369. PMID:23324343.
- Bloy N, Garcia P, Laumont CM, Pitt JM, Sistigu A, Stoll G, Yamazaki T, Bonneil E, Buqué A, Humeau J, et al. Immunogenic stress and death of cancer cells: Contribution of antigenicity vs adjuvanticity to immunosurveillance. Immunol Rev. 2017;280:165–74. doi:10.1111/imr.12582. PMID:29027230.
- Davoli T, Uno H, Wooten EC, Elledge SJ. Tumor aneuploidy correlates with markers of immune evasion and with reduced response to immunotherapy. Science. 2017:355. PMID:28126774.
- Acebes-Huerta A, Lorenzo-Herrero S, Folgueras AR, Huergo-Zapico L, Lopez-Larrea C, Lopez-Soto A, Gonzalez S. Drug-induced hyperploidy stimulates an antitumor NK cell response mediated by NKG2D and DNAM-1 receptors. Oncoimmunology. 2016;5:e1074378. doi:10.1080/2162402X.2015.1074378. PMID:27057443.
- Koebel CM, Vermi W, Swann JB, Zerafa N, Rodig SJ, Old LJ, Smyth MJ, Schreiber RD. Adaptive immunity maintains occult cancer in an equilibrium state. Nature. 2007;450:903–7. doi:10.1038/nature06309. PMID:18026089.
- Wakita D, Chamoto K, Ohkuri T, Narita Y, Ashino S, Sumida K, Nishikawa H, Shiku H, Togashi Y, Kitamura H, et al. IFN-gamma-dependent type 1 immunity is crucial for immunosurveillance against squamous cell carcinoma in a novel mouse carcinogenesis model. Carcinogenesis. 2009;30:1408–15. doi:10.1093/carcin/bgp144. PMID:19509217.
- Barrow AD, Edeling MA, Trifonov V, Luo J, Goyal P, Bohl B, Bando JK, Kim AH, Walker J, Andahazy M, et al. Natural killer cells control tumor growth by sensing a growth factor. Cell. 2018;172:534–48 e19. doi:10.1016/j.cell.2017.11.037. PMID:29275861.
- Lopez-Soto A, Gonzalez S, Lopez-Larrea C, Kroemer G. Immunosurveillance of malignant cells with complex karyotypes. Trends Cell Biol. 2017;27:880–4. doi:10.1016/j.tcb.2017.09.001. PMID:28939156.
- Castedo M, Coquelle A, Vivet S, Vitale I, Kauffmann A, Dessen P, Zitvogel L, Kroemer G. Apoptosis regulation in tetraploid cancer cells. EMBO J. 2006;25:2584–95. doi:10.1038/sj.emboj.7601127. PMID:16675948.
- Kalliolias GD, Liossis SN. The future of the IL-1 receptor antagonist anakinra: From rheumatoid arthritis to adult-onset Still's disease and systemic-onset juvenile idiopathic arthritis. Expert Opin Investig Drugs. 2008;17:349–59. doi:10.1517/13543784.17.3.349. PMID:18321234.
- Bloy N, Sauvat A, Chaba K, Buque A, Humeau J, Bravo-San Pedro JM, Bui J, Kepp O, Kroemer G, Senovilla L. Morphometric analysis of immunoselection against hyperploid cancer cells. Oncotarget. 2015;6:41204–15. doi:10.18632/oncotarget.5400. PMID:26517677.
- Shinkai Y, Rathbun G, Lam KP, Oltz EM, Stewart V, Mendelsohn M, Charron J, Datta M, Young F, Stall AM, et al. RAG-2-deficient mice lack mature lymphocytes owing to inability to initiate V(D)J rearrangement. Cell. 1992;68:855–67. doi:10.1016/0092-8674(92)90029-C. PMID:1547487.
- Exley MA, Bigley NJ, Cheng O, Shaulov A, Tahir SM, Carter QL, et al. Innate immune response to encephalomyocarditis virus infection mediated by CD1d. Immunology. 2003;110:519–26. doi:10.1111/j.1365-2567.2003.01779.x. PMID:14632651.
- Kitamura D, Roes J, Kuhn R, Rajewsky K. A B cell-deficient mouse by targeted disruption of the membrane exon of the immunoglobulin mu chain gene. Nature. 1991;350:423–6. doi:10.1038/350423a0. PMID:1901381.
- Roopenian DC, Christianson GJ, Sproule TJ, Brown AC, Akilesh S, Jung N, Petkova S, Avanessian L, Choi EY, Shaffer DJ, et al. The MHC class I-like IgG receptor controls perinatal IgG transport, IgG homeostasis, and fate of IgG-Fc-coupled drugs. J Immunol. 2003;170:3528–33. doi:10.4049/jimmunol.170.7.3528. PMID:12646614.
- Hou B, Reizis B, DeFranco AL. Toll-like receptors activate innate and adaptive immunity by using dendritic cell-intrinsic and -extrinsic mechanisms. Immunity. 2008;29:272–82. doi:10.1016/j.immuni.2008.05.016. PMID:18656388.
- Ikehara S, Pahwa RN, Fernandes G, Hansen CT, Good RA. Functional T cells in athymic nude mice. Proc Natl Acad Sci U S A. 1984;81:886–8. doi:10.1073/pnas.81.3.886. PMID:6608104.
- Budzynski W, Radzikowski C. Cytotoxic cells in immunodeficient athymic mice. Immunopharmacol Immunotoxicol. 1994;16:319–46. doi:10.3109/08923979409007097. PMID:7528237.
- McKenna HJ, Stocking KL, Miller RE, Brasel K, De Smedt T, Maraskovsky E, Maliszewski CR, Lynch DH, Smith J, Pulendran B, et al. Mice lacking flt3 ligand have deficient hematopoiesis affecting hematopoietic progenitor cells, dendritic cells, and natural killer cells. Blood. 2000;95:3489–97. PMID:10828034.
- Bonar SL, Brydges SD, Mueller JL, McGeough MD, Pena C, Chen D, Grimston SK, Hickman-Brecks CL, Ravindran S, McAlinden A, et al. Constitutively activated NLRP3 inflammasome causes inflammation and abnormal skeletal development in mice. PLoS One. 2012;7:e35979. doi:10.1371/journal.pone.0035979. PMID:22558291.