
 ?Mathematical formulae have been encoded as MathML and are displayed in this HTML version using MathJax in order to improve their display. Uncheck the box to turn MathJax off. This feature requires Javascript. Click on a formula to zoom.
ABSTRACT
Intricate relationships among cytokines (including chemokines) shape the tumor microenvironment (TME) and reflect cell-cell interactions between malignant cells and other cells from the TME. Although our previous study indicated the transcriptional landscape of cytokines in 19 cancer types, the global pattern somatic copy number (SCN) alterations and the clinical relevance of cytokines have not been systematically investigated. Here, we reported a significant negative selection on cytokine genes. We also linked the SCN losses of cytokine genes to the abundance of immune infiltrates which affects cancer progression and patient prognoses. We also demonstrated and validated the correlations between SCN alterations of cytokine-containing loci and drug sensitivity. The results indicated the genomic loss of cytokines in malignant cells as a crucial theme for interrogating cancer progression, malignant cell-TME interactions, and therapeutics.
Introduction
Somatic copy number (SCN) alterations of genes are widespread genetic events in cancers that may result in the activation of oncogenes and the inactivation of tumor-suppressor genes (TCGs).Citation1−Citation3 Exploration for the features of SCN alterations can lead to advances in cancer diagnoses and therapeutics. Previous studies focused on drivers of SCN alterations that were implicated in oncogenesis and cancer progression.Citation1,Citation3,Citation4 The identification of recurrent SCN events has provided insights into cancer cellular defects. Despite the understanding of genome-wide SCN events in those earlier attempts, alterations of the SCN landscape of cytokines (and chemokines) in compared to other protein-coding genes remain unclear.
Tumor microenvironment (TME) is thought to be crucial for tumor initiation, progression, angiogenesis, and metastasis.Citation5-Citation8 Cells that constitute the TME, including cancer-associated fibroblasts (CAFs), endothelial cells, and immune cells, may interact with malignant cells and contribute to the clinical outcomes, i.e., overall survivalCitation9 or therapeutic responsiveness.Citation10 Characterization of the TME, especially the immune components, has led to an understanding of tumor-TME interactions.Citation11 Although cytokines (and chemokines) play important roles in shaping the inflammatory TME,Citation12 only a few studies have focused on global patterns and functional implications of cytokines/chemokines in different cancer types.Citation13,Citation14 Our previous study characterized the transcript landscape of the cytokinome (including cytokines, chemokines, and several related genes) across human cancers.Citation14 In that study, we utilized expression data compiled from bulk tumor profiles to delineate expression patterns and prognostic correlations of cytokine genes in 19 cancer types. Despite those findings, the clinical relevance and functional correlations of SCNs of cytokine genes have not been systematically characterized.
Herein, we attempted to address these questions by conducting a systematic analysis of SCN events of cytokine genes using several publicly available data from The Cancer Genome Atlas (TCGA) project, Cancer Cell Line Encyclopedia (CCLE) projectCitation15 and caSNP project.Citation16 We identified SCN loss as a significant feature of cytokine-containing loci compared to the SCN genetic background, and it was associated with patients’ pathological stage, overall survival, and therapeutic efficacy.
Results
Comparison of SCNs between cytokine genes and other PCGs reveals subtle differences in SCN events
We used TCGA exome sequencing data to assess SCN alteration profiles of 250 cytokines in 8642 tumors of 19 cancer types (Table S1). We first characterized SCNs of cytokine-containing loci () and other protein-coding gene (PCG)-containing loci (Fig. S1). As shown for each cancer type, SCNs of cytokines were altered with different frequencies. In addition, frequencies of SCN gain and loss also differed across various cancer types (Fig. S2). Given similar SCN gain and loss patterns between cytokine-containing loci and other PCG-containing loci in different cancer types, we found that SCNs of cytokines were highly dependent on the nature of intrinsic SCN amplification and deletion. For example, in THCA, one cancer type that showed the least genetic alterations in other PCGs, also showed the fewest SCN alterations in cytokines.Citation17 In contrast, cytokine-containing loci were highly amplified in OV, which showed the most significant SCN in their genomic regions compared to other cancer types.Citation18
Figure 1. Cytokine copy numbers are somatically altered in human cancers. (A) Heatmap showing the fraction of somatic copy number (SCN) alterations of cytokine-containing loci (y axis) across 19 cancer types (x axis). Cytokines were ordered according to their genomic coordination. For each cancer type, red and blue colors respectively indicate percentages of SCN gain and loss events across specimens of corresponding genomic coordination. Numbers at the top are average percentages of SCN gain and loss values across cytokines. (B) Distributions of SCN gain (x axis) and loss (y axis) fractions of cytokines in each cancer type. Each dot represents the frequency of a cytokine gene in a specific cancer type. For each cancer type, cytokines with a fraction of SCN gain or loss of > 0.25 (high-frequency) are respectively denoted in red and blue. Cytokines with both fractions of SCN gain and loss of > 0.25 or < 0.25 are respectively denoted in black and gray. (C) Distribution of SCN gain and loss fractions of other protein-coding genes (PCGs) in each cancer type.
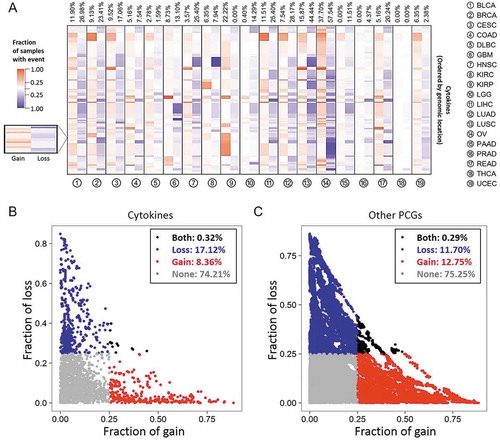
We next examined mean differences in SCNs between cytokine-containing loci and other PCG-containing loci (). A significant gain in cytokines (vs. other PCGs) in COAD, LIHC, LUSC, and READ (FDRs < 0.05) was found. In addition, significant loss of cytokines (vs. other PCGs) was identified in seven cancer types, including BRCA, HNSC, LGG, LIHC, LUAD, LUSC, and PAAD (FDRs < 0.05). These results indicated the presence of subtle differences in SCNs of cytokine genes compared to the genetic background (other PCGs) in different cancer types.
Table 1. Differences in SCNs between cytokine-containing loci and other PCG-containing loci.
SCN loss of cytokine genes as a critical genetic feature in human cancers
To further depict SCNs of the cytokinome in human cancers, the copy number (CN) gain (CN > 2.30, gene amplification) and loss (CN < 1.74, gene deletion) events in each specimen was defined. We calculated the frequencies of gain and loss events across samples and defined a CN event as “high-frequency” if this aberration occurred in > 25% of samples of a given cancer type. By comparing distributions of high-frequency gain and loss SCN alterations across all cancers, we discovered that the ratio of gain versus loss in cytokine-containing loci (gain: loss = 8.36%:17.12% ≈ 1:2, ) is lower than other PCG-containing loci (gain: loss = 12.75%:11.70% ≈ 1:1, p < 2.2 × 10⁻¹⁶, Fig. 1C), which indicates a negative selection of CN in cytokine containing loci. This is despite frequencies of cytokines that were never (74.21% and 75.25%) or both (0.32% and 0.29%) highly amplified and deleted in a given tumor type being the same. Notably, we found that only a few loci (14 in OV and one in READ) had concurrent high-frequency gain and loss (Fig. S3), indicating their context specific function in these types of cancer. These findings indicated that the loss of cytokine-containing regions is very likely to involve in tumorigenesis.
To account for the fact that the detection of somatic copy number cytokine genes may varies with gene size (gene length), we thus conducted permutation tests for the ratio of gain and loss SCN by randomizing the gene names in the genome across samples, and then repeated for 9999 times to obtain empirical p values. We found that the ratio of high-frequency gain of cytokine genes was significantly lower than (permuted) genome background, and the ratio of high-frequency loss of cytokine genes was significantly higher than (permuted) genome background (p values < 1 × 10⁻⁴, Fig. S4).
Detailed analyses define a cytokine subset which is commonly lost across human cancers
Given a large number of SCN gain and loss events being observed in tumor specimens, we raised the question of how common is the gain or loss events of these cytokine genes across different cancer types. We, therefore, profiled the number of shared tumor types of high-frequency SCN gain () and loss () cytokines. The amplification (gain) of cytokines tended to be tumor-specific, with very few high-frequency SCN gain events identified in more than two cancer types ( and ). In contrast, half of the cytokine genes (n = 125, 50.0%) were deleted (high-frequency loss) in ≥ 3 different tumor types ( and ). Notably, we found that BMP1 and seven TNFSF/TNFRSF genes were lost in 11 of 19 (57.9%) tumor types (Fig. S5).
Figure 2. Sharing patterns of high-frequency somatic copy number (SCN) alterations of cytokines across cancers. (A) Pie chart showing the distribution of sharing patterns of high-frequency SCN gain of cytokines. The number outside the parentheses indicates the number of shared cancer types. The number and percentage of cytokines are indicated inside the parentheses. (B) Pie charts showing distributions of shared patterns of high-frequency SCN loss of cytokines. (C) Distribution of number of (high-frequency) amplified cytokines (x axis) and the number of shared cancer types (y axis). noCytokines (high-frequency amplified in none of the cancer types), spCytokines (shared across one or two cancer types), and coCytokines (shared in ≥ 3 cancer types) are separated by two dotted lines. (D) Distribution of the number of (high-frequency) deleted cytokines and number of shared cancer types. (E) The number of high-frequency SCN loss events in each cytokine family. Bars are colored on the basis of cytokine categories (spCytokines, noCytokines, and coCytokines) (F) The percentage of high-frequency SCN loss events in each cytokine family.
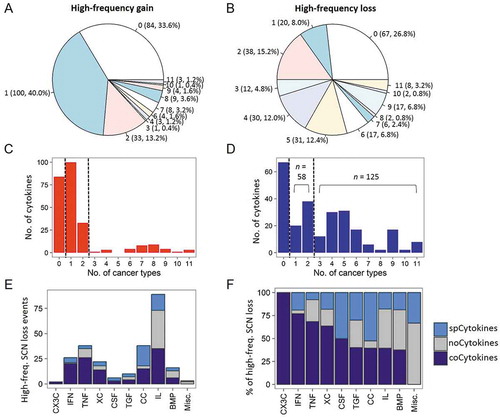
Based on the above results, we then grouped cytokine genes based on their prevalences of high-frequency deletions across cancer types: cytokine genes with a prevalence of high-frequency loss of ≥ 3 as “coCytokines” (common loss across different tumor types; n = 125); cytokine genes with a low prevalence of high-frequency deletions (one or two cancer types) as “spCytokines” (tumor-specific deletion pattern; n = 58), and the remaining as “noCytokines” (no high-frequency gene deletion events detected; n = 67).
As the cytokine category was defined using deletion profiles of cytokine genes, the frequency of gene amplification in each category was further assessed. We found that the frequency of SCN gain of coCytokines was significantly lower than those of spCytokines and noCytokines (FDRs < 2.2 × 10⁻¹⁶, Fig. S6). Importantly, we found a high proportion of coCytokines in the interferon (IFN), tumor necrosis factor (TNF) families, and XC chemokines (XC); and a high proportion of spCytokines in the CC chemokine (CC) group ( and ). Then, a gene ontology (GO) biological process (BP) enrichment analysis revealed significant enrichment of coCytokines (especially genes involved in the IFN family) in immune cell activation (FDRs < 0.1, Fig. S7) and spCytokines (especially CC cytokines) in immune cell chemotaxis (FDRs < 0.1, Fig. S8).
We next analyzed cytokines based on their biological functions (Table S2), and found that most immunosuppressive cytokines were noCytokines (IL10, IL19, IL20, IL22 and IL24) or spCytokine (TGFB1). In addition, most of the cytokines that may activate cytotoxic activity were coCytokine (IL2, IL4, IL5, IL12B, IL15, IFNA1 and IFNB1), while the remaining were noCytokine (IL7, IL12A, TNF and IFNG).
Enrichment of focal SCN amplified or deleted genes in cytokine category
We further assessed the enrichment of the significant focally amplified or deleted gene list in each cytokine category across 19 cancer types. For each cancer type, we assessed the over-representation of focal SCNAs in coCytokines, spCytokines, and noCytokines. We found that coCytokines showed significant over-representation in genes that focally lost (deletion) in 6 cancer types (GBM, KIRC, LIHC, LUAD, PRAD, and THCA) and genes that focally gained (amplification) in 1 cancer type (THCA). The spCytokines were enriched in focally amplified genes in BRCA, and enriched in focally deleted genes in DLBC and THCA. In addition, noCytokines were enriched in focally amplified genes in 4 cancer types (KIRC, LUSC, PAAD and THCA). Enrichment of noCytokines in focally deleted genes was not observed (Fig. S9).
Cytokine expression profiles are less correlated with SCN alterations compared to background genes
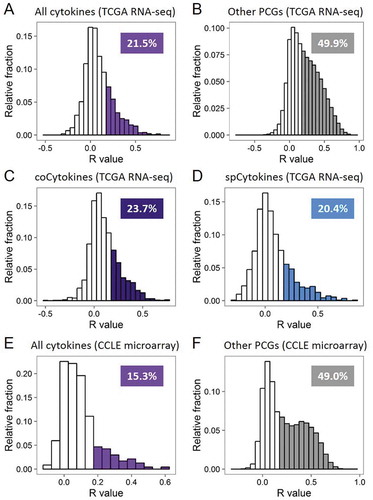
For each cancer type (Table S3), we estimated the contribution of SCNs to transcript abundances of cytokines by comparing SCNs and expression levels for all cytokines. We found that a positive correlation (Pearson’s product moment correlation coefficient (R) ≥ 0.2) between SCN and expression was detected for 21.5% of cytokines, compared to 49.9% for other PCGs (p < 2.2 × 10⁻¹⁶, and ). In addition, positive SCN-RNA correlations for 23.7% of coCytokines and 20.4% of spCytokines were detected. By calculating the frequency of positive SCN-RNA correlations for each cancer type ( and , Table S4), we found that cancer types with abundant SCN alterations (LUSC, OV, and READ) showed higher SCN-RNA correlations than cancer types with fewer SCNs (PRAD and THCA).
Figure 3. Transcript abundances of cytokines are less explained by somatic copy number (SCN) alterations. (A) Histogram showing frequency distributions of cytokines’ SCN-RNA correlation coefficients in all cancer types from TCGA. Percentages of cytokines with an SCN-RNA correlation coefficient of > 0.2 are shown and highlighted in color. (B) Histogram showing frequency distributions of other protein-coding genes (PCGs)’ SCN-RNA correlation coefficients in all cancer types from TCGA. (C) Histogram showing frequency distributions of coCytokines’ SCN-RNA correlation coefficients in all cancer types from TCGA. (D) Histogram showing frequency distributions of spCytokines’ SCN-RNA correlation coefficients in all cancer types from TCGA. (E) Histogram showing frequency distributions of cytokines’ SCN-RNA correlation coefficients in all cancer types from the CCLE. (F) Histogram showing frequency distributions of the other PCGs’ SCN-RNA correlation coefficients in all cancer types from the CCLE. The area of color in the histogram is approximate to the percentage of the number of genes with SCN-RNA correlation coefficients of > 0.2.
In considering that the observed SCN-RNA correlation may be due to uneven read mapping of cytokine genes in compared to other PCGs, we further investigated the TCGA microarray data in 10 available cancer types, including BRCA, COAD, KIRC, KIRP, LGG, LUAD, LUSC, OV, READ, UCEC. As microarray expression profiles were quantified in a probe-based manner, it is able to prevent the potential bias due to difficulty mapping of some genes. Hence, microarray data was considered as a good choice for cross-platform validation of SCN-RNA correlation pattern of cytokines and other PCGs. We observed similar results that the positive correlation (R ≥ 0.2) between SCN and expression was detected for 27.2% of cytokines, compared to 52.6% for other PCGs (Fig. S10).
We also noticed that while assessing the correlation between SCNA of cytokine genes and transcript abundances, an important confounder may be the tumor purity of specimens. As the calling ability of SCN may be low in specimens with high immune infiltration (and thus lower tumor purity), we further selected the samples with 80% tumor purity or above (based on immunohistochemistry (IHC) staining) to ensure the reliability of SCN calling. With using 80% as threshold, 3432 (~40%) samples across 17 cancer types (DLBC and PAAD were excluded) remained for further analyses. We found that the ratio of high-frequency gain and loss in cytokine-containing loci (gain: loss = 13.41%:20.35% ≈ 1:1.5) also differed from other PCG-containing loci (gain: loss = 16.32%:16.99% ≈ 1:1, permutation p values < 1 × 10⁻⁴, Fig. S11). We then conducted SCNA-RNA correlation analysis, and confirmed the pattern that the positive SCNA-RNA correlations (R ≥ 0.2) for cytokine genes (24.6%) were lower than that of other PCGs (52.7%, Fig. S12).
To further confirm the difference in SCN-RNA correlations between cytokines and other PCGs, we leveraged CN and mRNA expression data from the CCLE dataset. As expected, positive CN-RNA correlations were detected for 15.3% of cytokines and 49.0% for other PCGs (p < 2.2 × 10⁻¹⁶, and ).
We next calculated the Jensen-Shannon (JS) divergence-derived specificity score of each gene to quantify the specificity of expressions of genes across 19 types of primary cancer specimens (Fig. S13). Cytokines showed higher cancer-type specificities than other PCGs (p < 2.2 × 10⁻¹⁶), suggesting higher tissue- or cell-type specificities. Notably, we detected no discrepancy in specificity score distributions in the cytokine category (p > 0.05). We further validated the higher tissue- or cell-type specificity of cytokines (vs. other PCGs) in cell line data (CCLE database, p = 1.78 × 10⁻¹⁰) and human normal tissue data (GTEx database, p = 8.01 × 10⁻⁸, Fig. S14).
Correlations between SCNs of cytokines and immune infiltrates
To determine whether the SCNs of cytokines were associated with infiltrating immune cells, we resolved the composition of 24 immune cell types, including innate and adaptive immune cells, using a functional gene set from Gabriela et al.Citation19 For each primary tumor specimen, 24 immune metagenes were calculated. The highest median enrichment score of the B-cell metagene in DLBCs confirmed the reliability of the gene set (Fig. S15).
We hypothesized that the genetic loss of coCytokines in human cancers may imply its important role in immune reactions against cancers. To test this hypothesis, we correlated the SCNs of coCytokines, spCytokines, and noCytokines with 24 immune metagenes. On average, coCytokines showed higher SCN-immune correlations than spCytokines and noCytokines (coCytokines vs. spCytokines: p < 2.2 × 10⁻¹⁶, coCytokines vs. noCytokines: p < 2.2 × 10⁻¹⁶; and spCytokines vs. noCytokines: p = 2.28 × 10⁻⁶, ). Aided by a heat map, we found a discernible pattern regarding correlations between cytokine categories and intensities of immune metagenes (, Fig. S16), suggesting that cytokines that are commonly deleted in cancers may be associated with increased immune infiltrates.
Figure 4. Deconvolution of bulk cancer mRNA profiles suggests a positive correlation between the somatic copy number (SCN) of coCytokines and immune infiltrates. (A) The correlation coefficient (x axis) between SCNs of cytokines and immune metagenes (adopted from Bindea et al.) across cytokine categories (coCytokines vs. noCytokines vs. spCytokines). (B) Correlation coefficients of cytokine categories (x axis) and each immune metagene (y axis). Hierarchical clustering was performed on immune cell types to depict their similarity of correlations to cytokine categories. (C) Validation, correlation coefficient (x axis) between the SCNs of cytokines and immune metagenes (derived from single-cell profiles, I. Tirosh et al.) across cytokine categories.
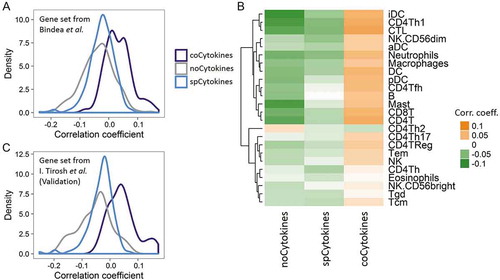
We further validated these results using another TME-related gene set derived from single-cell dataCitation20 and derived eight TME metagenes (including B cells, cancer-associated fibroblasts, CD8 positive T cells, Endothelial cells, Macrophages, NK cells, CD4 positive T helper cells and regulatory T cells). We identified in total 495 genes that highly expressed in single cell type (excluding genes that highly expressed in malignant cells (Fig. S17)). The expression values of the genes that specifically expressed in each cell type were averaged to give cell type-specific metagene (Fig. S17). We found significant differences in correlations between cytokine categories and TME/immune metagenes (coCytokines vs. spCytokines: p < 2.2 × 10⁻¹⁶, coCytokines vs. noCytokines: p < 2.2 × 10⁻¹⁶; and spCytokines vs. noCytokines: p = 2.45 × 10⁻⁴, , Fig. S18).
Cytokine categories are clinically valuable in cancer therapy
Given the categorized cytokine groups based on SCN alteration profiles and their correlations with expression and immune infiltrates, fundamental questions are whether and what proportion of SCN gain and loss events are clinically relevant. To address these questions, we correlated SCN alterations of cytokines with pathological stages and patients’ overall survival. For each specimen of 12 cancer types with available pathological data, we summarized SCNs of coCytokines and spCytokines and assessed differences in average SCN levels across pathological stages. SCNs of coCytokines were significantly correlated with tumor pathological stages ( and ). In particular, SCNs of coCytokines were significantly lost in stages II to IV compared to stage I, implying their crucial role in cancer progression. However, we detected no correlation between SCNs of spCytokines and pathological stages (, Fig. S19).
Figure 5. Clinical relevance of cytokine categories. (A) Distributions of mean somatic copy number (SCN) levels of coCytokines (y axis) across different pathological stages. (B) Comparison of the mean fraction of coCytokine and spCytokine SCN losses (y axis) and pathological stages (x axis). For each pathological stage, average fractions (across cancer types) of high-frequency (> 25% across specimens) SCN loss were calculated. The red star denotes a significant difference (p < 0.05). (C) The number of cytokines that are significantly associated with patients’ overall survival (FDR < 0.1) in each cancer type. Numbers of significant cytokines are shown. Bars are colored on the basis of the direction of the effect, i.e., orange for protection (hazard ratio (HR) < 1) and green for damaging (HR > 1). (D) Percentages of protection and damaging effects of cytokine categories. The percentages were calculated from cytokines that were significantly associated with overall survival (FDR < 0.1).
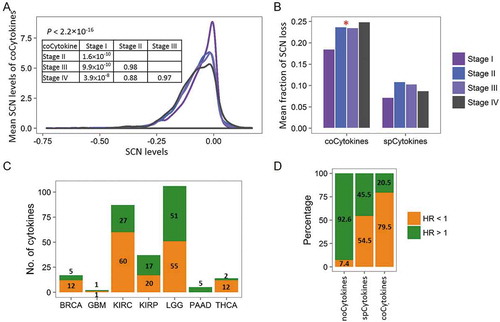
In addition, a Cox regression model was further applied to evaluate the association between SCNs of cytokines (or other PCGs) and patients’ overall survival (Table S5). By comparing the cytokine category to the other PCGs, we found significant differences in the percentage of damaging (hazard ratio (HR) > 1.0) or protective (HR < 1.0) genes in compared to other PCGs (Fig. S20). For instances, coCytokines showed higher percentage in protective group in compared to other PCGs (4.51% vs. 2.75%, binomial p = 0.045), and lower percentage in damaging group (1.31% vs. 2.54%, binomial p = 0.013). For spCytokines, the pattern of enrichment of significant genes in protective group (2.99% vs. 2.75%, binomial p = 0.03) and damaging group (2.00% vs. 2.54%, binomial p = 0.02) were similar to coCytokines. However, the differences of percentages were modest, suggesting weak correlation between spCytokines and patients’ prognoses across cancers. For noCytokines, the percentage of significant genes in protective group is lower than that of other PCGs (0.94% vs. 2.75%, binomial p = 0.0009), and the percentage of significant genes in damaging group is higher than that of other PCGs (2.75% vs. 2.54%, binomial p = 0.027).
Furthermore, SCNs of cytokines showed significant damaging and protective effects on overall survival in seven of 19 (36.8%) cancer types (). For all significance tests, 79.5% of SCNs of coCytokines and 54.5% of SCNs of spCytokines were protective, compared to 7.4% of noCytokines (). This indicated that coCytokines and some spCytokines may be crucial for protection against cancer cells, and the genetic loss of these cytokines may lead to poorer outcomes.
Therapeutic relevance of cytokines’ SCN gain and loss events
We finally sought to determine whether SCN alterations of cytokines could affect cancer therapeutic responsiveness. We utilized the half maximal inhibitory concentration (IC50) profiles of 24 drugs from the CCLE databaseCitation15 to examine the effects of CNs on therapeutic sensitivity. Agglomerative hierarchical clustering of correlation coefficients of CN-drug pairs revealed several meaningful clusters: topotecan and irinotecan (chemotherapeutic agents); tyrosine kinase inhibitors including lapatinib, ZD-6474 (vandetanib), AZD0530 (saracatinib), and erlotinib; RAF inhibitors including RAF265 and PLX4720; and MEK inhibitors including AZD6244 and PD-0325901. In addition, we found that TKI258 (dovitinib, a c-Kit inhibitor), PF2341066 (a c-Met inhibitor), and Sorafenib (a c-Raf inhibitor) were adjacent to each other (). Furthermore, for all significant correlations being detected, CNs of spCytokines and noCytokines were largely (~75%) positively correlated (r > 0) with IC50 values (). In contrast, 53.8% of detectable significant correlations regarding CNs of coCytokines were negatively correlated (r < 0) with IC50 values, suggesting that the genetic loss of coCytokines may lead to drug resistance (higher IC50 values).
Figure 6. Therapeutic liability of somatic copy number (SCN) alterations of cytokines in human cancers with using the Cancer Cell Line Encyclopedia (CCLE) database. (A) Heat map showing correlations of SCN levels of cytokines (including coCytokines, noCytokines and spCytokines, row) and 50% inhibitory concentration (IC50) values of 24 drugs (column). Each cell represents the Pearson’s product moment correlation coefficient. (B) Percentages of positive and negative correlations of cytokine categories to IC50 values of 24 drugs. Ratios were calculated from significant cytokines in each cancer type. Bars are colored on the basis of the direction of the effect, i.e., orange for positive correlations (r > 0) and green for negative correlations (r < 0). (C) Numbers of cytokines that were significantly correlated with drug sensitivity (false discovery rate [FDR]-adjusted). Bars are colored on the basis of cytokine categories. (D) Validation, average log multiple of change (FC) of 16 coCytokines (associated with the IC50 of lapatinib) in four conditions (y axis). (E) Validation, logFC of five (out of 18) coCytokines differentially expressed in dovitinib (TKI258)-treated LC-2/ad DR compared to dovitinib-treated LC2/ad cells. logFC, estimated logFC corresponding to dovitinib-treated LC-2/ad DR vs. dovitinib-treated LC2/ad cells; AveExpr, average expression across all samples; T, moderated t-statistic; PAdjusted, Benjamini and Hochberg (BH)-adjusted p value; B, log odds.
![Figure 6. Therapeutic liability of somatic copy number (SCN) alterations of cytokines in human cancers with using the Cancer Cell Line Encyclopedia (CCLE) database. (A) Heat map showing correlations of SCN levels of cytokines (including coCytokines, noCytokines and spCytokines, row) and 50% inhibitory concentration (IC50) values of 24 drugs (column). Each cell represents the Pearson’s product moment correlation coefficient. (B) Percentages of positive and negative correlations of cytokine categories to IC50 values of 24 drugs. Ratios were calculated from significant cytokines in each cancer type. Bars are colored on the basis of the direction of the effect, i.e., orange for positive correlations (r > 0) and green for negative correlations (r < 0). (C) Numbers of cytokines that were significantly correlated with drug sensitivity (false discovery rate [FDR]-adjusted). Bars are colored on the basis of cytokine categories. (D) Validation, average log multiple of change (FC) of 16 coCytokines (associated with the IC50 of lapatinib) in four conditions (y axis). (E) Validation, logFC of five (out of 18) coCytokines differentially expressed in dovitinib (TKI258)-treated LC-2/ad DR compared to dovitinib-treated LC2/ad cells. logFC, estimated logFC corresponding to dovitinib-treated LC-2/ad DR vs. dovitinib-treated LC2/ad cells; AveExpr, average expression across all samples; T, moderated t-statistic; PAdjusted, Benjamini and Hochberg (BH)-adjusted p value; B, log odds.](/cms/asset/78ec37c3-e554-47a2-a3a7-5292533eac78/koni_a_1468951_f0006_oc.jpg)
For all cytokines (CN-IC50 correlations) that reached a significant threshold, coCytokines accounted for the majority of the results (, Fig. S21). In particular, we found that CNs of coCytokines were positively correlated with the IC50 of Lapatinib (n of coCytokines = 16, hypergeometric p ≪ 0.001) and negatively correlated with the IC50 of TKI258 (n of coCytokines = 18, hypergeometric p ≪ 0.001, Fig. S22). As SCN alterations of cytokines may also provoke expression changes, we further validated these observations using two cell line expression datasets from the GEO. First, we leveraged a dataset (GSE16179)Citation21 to compare the mean multiples of change (FCs) of mRNA expressions of 16 coCytokines in BT474-J4 (a lapatinib-resistant breast cancer cell line) vs. BT474 (a HER2-positive and lapatinib-sensitive breast cancer cell line). As a result, a positive mean logFC in lapatinib-treated BT474-J4 vs. lapatinib-treated BT474 () was observed, indicating upregulation of 16 coCytokines in a lapatinib-resistant cell line, which was consistent with the direction of the correlation that we observed in . Notably, upregulation of 16 coCytokines in lapatinib-treated BT474-J4 vs. DMSO-treated BT474-J4 was also observed, implying a further enrichment of lapatinib-resistant cells or enhanced resistance mechanisms during exposure. We then utilized another dataset (GSE69226)Citation22 to analyze expression changes of cytokines in LC-2/ad DR (a dovitinib-resistant lung adenocarcinoma cell line) vs. LC-2/ad (a dovitinib-sensitive lung adenocarcinoma cell line). Five of 18 (27.8%) coCytokines showed significant differential expression across these two cell lines (). Among them, four coCytokines were downregulated (logFC < 0) in LC-2/ad DR compared to LC-2/ad, which was consistent with results in that CNs of coCytokines were negatively associated with the IC50 of dovitinib.
Discussion
The advent of comprehensive tumor profiling has drawn widespread attention to the characterization of complex interactions of malignant cells with their TMECitation9,Citation19,Citation23–Citation25 and the functional consequences.Citation26,Citation27 Cytokines (and chemokines) and related genes are implicated in this complex tumor-TME crosstalk and regulate the behaviors of malignant cells, CAFs, endothelial cells, and immune cells.Citation28,Citation29 In the present study, we reported a comprehensive characterization of global patterns and clinical relevances of SCN alterations in cytokine-containing loci across different human cancer types. We identified two distinct features regarding SCN alterations of cytokine genes compared to other PCGs across human cancers, including (1) the significant loss of cytokine-containing loci; (2) the correlations between SCN levels of coCytokines and pathological stages; and (3) the relevance of cytokine-containing loci and drug sensitivity.
We observed significant deviations of the gain-to-loss ratio in cytokine-containing loci compared to the genomic background (all other PCGs). As we assumed that patterns of SCN alterations that were observed across the genome may reflect selective pressures, the significant loss of cytokine genes (especially for cytokines that may activate cytotoxic activity) suggested negative selection in malignant cells. This pattern of selection is likely to be the consequence of intricate interactions between malignant cells and the TME. The negative selection force that shapes the genomic landscape of cytokines (and chemokines) which in turn, led to the observation that SCN-RNA correlations of cytokine genes were significantly lower than those of other PCGs.
In this study, we mainly focused on coCytokines (cytokines that are commonly lost across different tumor types) that are commonly deleted in multiple (≥ 3) cancer types. We revealed positive correlations between loss of coCytokines and pathological stages, suggesting that the negative selection of these cytokine genes was accompanied by disease progression. In other words, these cytokines may confer protective effects against a tumor. Indeed, we observed that expressions of coCytokines were most significantly associated with better patient prognoses. In addition, we also demonstrated an enrichment of IFN and TNF family genes that possessed tumor protective effectsCitation30,Citation31 in coCytokines. Type I IFNs play a pivotal role in anticancer immunity.Citation32,Citation33 Previous pieces of evidence also suggested that type I IFNs may promote cancer eradication through autocrine and paracrine effects.Citation34 Furthermore, TNF was also identified in our study, a multifunctional cytokine that possesses anticancer effects by regulating immunity and apoptosis of cancer cells.Citation35,Citation36 Taken together, our results provided information to identify novel cytokines that may be important for the treatment of cancers.
Previously, B. Mlecnik et al. reported the links between copy number amplification of 59 cytokines and cytokine receptors to the absence of lymph node metastasis (N0) and distant metastasis (M0) of clinical colorectal cancer (CRC) patients.Citation27 In addition, G. Bindea et al. also reported the clinical relevance of 53 chemokines and found that deletion of 2 chemokines (CXCL2 and CXCL13) confer a higher risk of CRC relapse.Citation19 In addition, J. A. Malek et al. has elucidated the deletion of CC chemokine subfamily genes in primary ovarian cancers. As exemplified, they observed the deletion of CCL2 in 70% of cancer specimens.Citation37 These findings are further consolidated by our results that SCN loss of coCytokines is associated with advanced pathological stages and the poorer patients’ prognoses across different cancer types. Several studies have revealed the prognostic impact of infiltrating immune cells.Citation38,Citation39 Arnold Han et al.Citation40, X. Liu et al.Citation41 and M. Jang et al.Citation42 have characterized the immune repertoire profiles of T cells in colorectal carcinoma, follicular lymphoma and ovarian cancer, respectively. Their studies suggested a profound enrichment of specific T-cell receptor clones in local cancer sites. Gentles AJ et al. have also reported the prognostic landscape of immune-related genes (22 immune subsets) across 39 cancer types.Citation9 In this study, we have reported positive correlations between SCN levels of coCytokines and immune metagenes, which enforce the hypothesis that the common loss coCytokines are due to their anticancer property and thus tend to be eliminated by malignancies during cancer progression.
The implications of cytokines in the drug resistance mechanisms have been investigated.Citation43,Citation44 Here, using lapatinib and dovitinib (TKI258) as examples, our data suggested that both SCN gain and loss may confer a drug-resistance ability. For lapatinib, SCN alterations and expression levels of coCytokines were positively correlated with its IC50 (conferring resistance); for dovitinib, decreases in SCN alterations and expression levels were associated with higher therapeutic resistance (against resistance).
By correlating SCN alterations to the transcript levels, we found a profoundly low SCN-RNA correlations among cytokine genes in compared to other PCGs. Given that RNA profiles of TCGA datasets were compiled from bulk tissues, the quantified mRNA levels may thus capture expressions of genes from an admixture of cell types. The low SCN-RNA correlations may thus reflect the fact that the cytokine (and chemokine) network in bulk tumors can be less attributed to malignant cells compared to other cell types. Furthermore, we also showed that coCytokines were positively correlated with immune infiltrates, and confirmed the contribution of the TME to cytokine (and chemokine) levels in bulk tumors.
To summarize, our findings highlight SCN loss of cytokine (and chemokine) genes as a crucial theme for investigating the mechanisms of cancer progression, clarifying tumor-TME interactions, and developing therapeutic strategies. Further efforts are required to characterize subtype-specific effects and impacts of SCN alterations of cytokine genes, to elucidate functional implications of each cytokine in interactions of malignant cells with the TME, and finally, shed light on cancer therapeutics.
Materials and methods
Pan-cancer SCN alteration data for cytokinome analyses
Nineteen cancer types (urothelial bladder cancer [BLCA], breast cancer [BRCA], cervical cancer [CESC], colon adenocarcinoma [COAD], diffuse large B-cell lymphoma [DLBC], glioblastoma multiforme [GBM], head and neck squamous cell carcinoma [HNSC], clear cell kidney sarcoma [KIRC], papillary kidney carcinoma [KIRP], lower-grade glioma [LGG], liver hepatocellular carcinoma [LIHC], lung adenocarcinoma [LUAD], lung squamous cell carcinoma [LUSC], ovarian serous cystadenocarcinoma [OV], pancreatic ductal adenocarcinoma [PAAD], prostate adenocarcinoma [PRAD], rectal adenocarcinoma [READ], papillary thyroid carcinoma [THCA], and uterine corpus endometrial carcinoma [UCEC]) were included in this study.
Gene-level GISTIC2 SCN profiles (without germline CN variations) were queried from The Cancer Genome Atlas (TCGA) GDAC Firehose with using TCGA-Assembler package. The CN events were detected using Affymetrix SNP Array 6.0 (probe-based) with reference genome of hg19. In addition, CN values were quantified as log2(CN/2) and zero-centered. The CN value of 0 means normal copy. For each cancer type, primary tumor data was selected for downstream analyses. The gene-level copy number value was calculated by taking mean CN value of the genomic region, which is implemented in the “ProcessCNAData” function from TCGA-Assembler package.
We investigated CNs of 261 cytokines (including chemokines and other miscellaneous genes) as previously defined.Citation14 After filtering genes based on GENCODE (vers. 24) annotations and further quality sanitization, 250 genes with available CN data were used in this study. We defined the remaining genes as “other PCGs”.
For the processed CN data, we defined a CN gain as a copy number of >+0.2 (CN value) and a CN loss as a copy number of <-0.2 (CN value). For each tumor type, the CN alteration that was found in >25% of tumor specimens was defined as a high-frequency CN gain or loss.
We also queried focal SCN data of each cancer type from TCGA database. The regions with focal amplification or deletion across a set of tumors were identified by GISTIC v2.0Citation45. The genes that were focally gained or lost were subjected to downstream analysis.
TCGA mRNA expression profiles
Level-3 mRNA transcriptomic profiles (RNA-sequencing vers. 2) of 19 TCGA cancers (restricted to primary tumors) were downloaded using the TCGA-Assembler package. We further processed mRNA data using the “ProcessRNASeqData” function implemented in the TCGA-Assembler package. Genes were further filtered according to GENECODE (vers. 24) annotations to include only protein-coding genes (PCGs). For the remaining genes, and for each cancer type, we performed sample-based quality filtering by removing outliers based on the deviation (standard deviation of > 5) from the mean connectivity (using signed, weighted bi-weight midcorrelations).
In addition, we further downloaded and processed the level-3 microarray profiles of 10 available TCGA cancers, including BRCA, COAD, KIRC, KIRP, LGG, LUAD, LUSC, OV, READ and UCEC. The data were further processed using TCGA-Assembler package. We also selected only primary tumor tissue specimens for cross-platform validation.
TCGA samples’ clinical information
For each cancer type, clinical data were acquired using the “DownloadClinicalData” function in the TCGA-Assembler package. Information about gender, age, and overall survival time of each patient was extracted for downstream analyses.
caSNP database
We downloaded GISTIC data from caSNP, a comprehensive cancer CN alteration (CNA) database using single-nucleotide polymorphism (SNP) array data (~11,500 SNP density across 34 cancer types). We extracted cytokines with GENECODE (vers. 24) annotations and available CN data (G score = (/N) for analysis.
Cancer cell-line encyclopedia (CCLE) database
Expression, CN, and drug sensitivity data from the CCLE project were queried from the CCLE portal (https://portals.broadinstitute.org/ccle). CN data were profiled using an Affymetrix SNP6.0 array and quantified as log2(CN/2). Expression data were profiled using the Affymetrix U133+2 array and normalized with the robust multi-array average (RMA) algorithm, followed by quantile normalization. In addition, pharmacological profiles contained IC50 information of 24 anticancer drugs across 504 cell lines.
Microarray data from the gene expression omnibus (GEO)
Microarray data were downloaded from a public repository (GEO) using the “getGEO” function implemented in GEOquery.Citation46 We directly adopted the normalized data. We further log2-transformed their expressions for downstream analyses. The queried datasets are summarized as follows:
Specificity score analysis
We adopted a specificity scoring method from Yan et al.Citation48 to quantify similarities of expression profiles across TCGA cancers (19 cancer types), CCLE cell lines, and 13 normal tissue types from the GTEx project. For each gene, we calculated the average expression value across samples of the same cancer types (TCGA and CCLE data) or tissue types (GTEx data). Then, fraction values were calculated by dividing each average value using the sum of these average values across all cancer or tissue types. These fraction metrics can be used to infer the propensity of a gene to be expressed in specific cancer or tissue type. We, therefore, calculated the Jensen-Shannon (JS) divergence of these fraction metrics with control metrics, which indicated perfect tissue-specific expression. The minimum value was finally selected to calculate the specificity score of each gene, i.e., 1-sqrt(JS divergence).
Immune metagene analysis
To infer the extent of infiltrating immune cells in primary tumor specimens, two gene sets of immune-specific markers were adopted. The first gene set included 24 cell type-specific sets containing 577 marker genes. These cell type-specific sets were adopted from Bindea et al.,Citation19 and contain specifically expressed genes of 24 immune cell types involved in innate immunity (natural killer [NK] cells, NK CD56dim cells [NK.CD56dim], NK CD56bright cells [NK.CD56bright], dendritic cells [DCs], immature [i]DCs, activated [a]DCs, plasmocytoid [p]DCs, eosinophils, macrophages, mast cells, and neutrophils) and adaptive immunity (B cells [B], CD4 T cells [CD4T], T helper cells [CD4Th], T central memory cells [Tcm], T effector memory cells [Tem], T helper 1 cells [CD4Th1], T helper 2 cells [CD4Th2], T follicular helper cells [Tfh], T helper 17 cells [CD4Th17], T regulatory cells [CD4Treg], CD8 T cells [CD8T], T gamma/delta cells [Tgd], and cytotoxic T cells [CTL]).
The other gene set was calculated from single-cell melanoma data (RNA-seq).Citation20 The queried RNA-seq data were already sanitized (removed low expressed genes and cells with poor quality) and the expression of transcripts (Eg,c) were quantified as log-transformed transcripts per million, i.e. log2(TPMg,c/10 + 1), where g refers to gene and c refers to the cell. Immune cells can be further separated into B cells, T cells, natural killer (NK) cells and macrophages based on annotations from downloaded data. We further distinguished T cells into CD8+ T cells (avg.[CD8A, CD8B] > 3.0), Treg cells (CD4 > 3 and avg.[FOXP3, CD25] > 3.5), and CD4+ Th cells (CD4 > 3 and avg.[FOXP3, CD25] < 2.5).
We then defined cell type-specific marker genes by using 3 criteria. For each gene, we first performed Kruskal-Wallis (KW) test to identify its significant differential expression across cell types. The genes with KW p-value less than 0.01 (criteria 1), the gene(s) that were expressed by greater than 50% of the cells in specific cell type (criteria 2), as well as with median expression above 2 (i.e. 4-fold higher than another cell types) in a specific cell type in compared to all other cell types (criteria 3) were defined as cell type-specific marker genes. Notably, malignant cells were also included for marker genes identification. For identified immune-related cell type-specific marker genes, we therefore averaged the expression values of these genes to construct 8 cell type-specific metagenes (cancer-associated fibroblasts, endothelial cells, CD8+ T cells, CD4+ Th cells, Treg cells, B cells, NK cells and macrophages). In total, we identified 24 B cell markers (bCells), 8 CD8+ T cell markers (cd8tCells), 133 macrophage markers (macroCells), 25 NK cell markers (nkCells), five CD4+ T helper cell markers (thCells), and 28 T regulatory cell markers (tregCells). In addition, 142 cancer-associated fibroblast markers (cafCells) and 130 endothelial cell markers (endoCells) were also included in this analysis.
The above marker genes were subjected to a single-sample gene set enrichment analysis (ssGSEA) algorithm.Citation49 The ssGSEA algorithm, as implemented in the GSVA package, can calculate separate enrichment scores (i.e. metagenes) of each sample for a given gene set. The enrichment scores underwent further Z-scoring across samples.
Gene ontology (GO) overrepresentation analysis (ORA)
We conducted a GO biological process (BP) enrichment analysis using the topGO and GO.db packages. The significance of enrichment was assessed using Fisher’s exact test. The parameter algorithm, ‘weight01’, was used to take the GO hierarchy into account. Benjamini and Hochberg (BH)-adjusted false discovery rate (FDR) values were calculated to reduce the likelihood of false positives.
Statistical analyses
To assess the enrichment of focal SCN amplification or deletion in cytokine genes, we used Fisher’s exact test. The significant enrichment (or over-representation) was defined as odds ratio (OR) greater than 1 and p value less than 0.05 (or 0.01). To correlate gene CN values with their expressions and immune metagenes with drug sensitivity indices (IC50 values), we adopted the Pearson’s product-moment correlation test, with a significant FDR threshold of 0.05. Exact binomial tests were conducted to assess the difference between proportions. To test differences between distributions of specificity scores, we adopted the Kolmogorov-Smirnov statistic and testing. When comparing expressions of cytokines across different tumor stages, we used the Kruskal-Wallis rank sum test followed by pairwise comparisons using the Tukey and Kramer (Nemenyi) test. BH-adjusted FDR values were further calculated. For each gene in each cancer type, we used a Cox-proportional hazard model (with age and gender adjustment), implemented in the rms package, to assess correlations between gene expressions and overall survival of cancer patients. We selected a BH-adjusted FDR value of 0.1 as the significance threshold for the survival analysis. We also included age and gender as covariates. In drug sensitivity analysis, we used Pearson’s product moment correlation coefficient to quantify the correlation between SCN of cytokine genes and drug sensitivity profiles. We further computed tests of the associations being zero based on t-distribution with (N-2) degree of freedoms. We defined a drug-CN pair as significance if BH-adjusted FDR < 0.05. To identify differentially expressed genes (DEGs) in the drug sensitivity analyses, we used a moderated t-test, implemented in the limma package, to calculate p values of gene expressions across resistant and sensitive cell lines. In addition, log-multiples of change were also inferred to represent up- or downregulation of each gene in resistant cell lines.
In this study, analyses were conducted using R (http://www.r-project.org/ and http://cran.r-project.org/) and Bioconductor (http://www.bioconductor.org/).
Abbreviations
TME: tumor microenvironment; SCN: somatic copy number; PCG: protein-coding gene; TCG: tumor suppressor gene; CAF: cancer-associated fibroblast; TCGA: The Cancer Genome Atlas; CCLE: Cancer Cell Line Encyclopedia; OV: ovarian serous cystadenocarcinoma; COAD: Colon adenocarcinoma; LIHC: Liver hepatocellular carcinoma; LUSC: Lung squamous cell carcinoma; READ: Rectal adenocarcinoma; BRCA: Breast cancer; HNSC: Heck and neck squamous cell carcinoma; LGG: Lower grade glioma; LUAD: Lung adenocarcinoma; PAAD: Pancreatic ductal adenocarcinoma; GO: gene ontology; BP biological process; GTEx: Genotype-Tissue Expression; DLBC: Diffuse large B-cell lymphoma; HR: hazard ratio; IC50: half maximal inhibitory concentration; GEO: Gene Expression Omnibus; FC: fold-change; IFN: interferon; TNF: tumor necrosis factor; BLCA: Urothelial bladder cancer; CESC: Cervical cancer; GBM: Glioblastoma multiforme; KIRC: Clear cell kidney sarcoma; KIRP: Papillary kidney carcinoma; PRAD: Prostate adenocarcinoma; THCA: Papillary thyroid carcinoma; UCEC: uterine corpus endometrial carcinoma; SNP: single-nucleotide polymorphism; JS: Jensen-Shannon; BH: Benjamini & Horchberg; FDR: false discovery rate; DEG: differentially expressed gene.
Disclosure of Potential Conflicts of Interest
No potential conflicts of interest were disclosed.
Supplemental Material
Download MS Word (3.7 MB)Acknowledgments
We are grateful to Willy Hugo (University of California Los Angeles, USA) for reading the manuscript and providing valuable comments.
Supplemental data for this article can be accessed here.
Additional information
Funding
Notes on contributors
Wei-Chiao Chang
H.S.C.W. and W.C.C designed the experiments H.S.C.W analyzed the data. H.S.C.W and W.C.C. wrote the manuscript. H.S.C.W. and W.C.C. contributed to the manuscript preparation. W.C.C. supervised the project.
References
- Beroukhim R, Mermel CH, Porter D, Wei G, Raychaudhuri S, Donovan J, Barretina J, Boehm JS, Dobson J, Urashima M, et al. The landscape of somatic copy-number alteration across human cancers. Nature. 2010;463:899–905. doi:10.1038/nature08822.
- Stratton MR, Campbell PJ, Futreal PA. The cancer genome. Nature. 2009;458:719–724. doi:10.1038/nature07943.
- Zack TI, Schumacher SE, Carter SL, Cherniack AD, Saksena G, Tabak B, Lawrence MS, Zhsng CZ, Wala J, Mermel CH, et al. Pan-cancer patterns of somatic copy number alteration. Nat Genet. 2013;45:1134–1140. doi:10.1038/ng.2760.
- Kim TM, Xi R, Luquette LJ, Park RW, Johnson MD, Park PJ. Functional genomic analysis of chromosomal aberrations in a compendium of 8000 cancer genomes. Genome Res. 2013;23:217–227. doi:10.1101/gr.140301.112.
- Mbeunkui F, Johann DJ Jr. Cancer and the tumor microenvironment: a review of an essential relationship. Cancer Chemother Pharmacol. 2009;63:571–582. doi:10.1007/s00280-008-0881-9.
- Morrison WB. Inflammation and cancer: a comparative view. J Vet Intern Med. 2012;26:18–31. doi:10.1111/jvim.2012.26.issue-1.
- Pein M, Oskarsson T. Microenvironment in metastasis: roadblocks and supportive niches. Am J Physiol Cell Physiol. 2015;309:C627–638. doi:10.1152/ajpcell.00145.2015.
- Quail DF, Joyce JA. Microenvironmental regulation of tumor progression and metastasis. Nat Med. 2013;19:1423–1437. doi:10.1038/nm.3394.
- Gentles AJ, Newman AM, Liu CL, Bratman SV, Feng W, Kim D, Nair VS, Xu Y, Khuong A, Hoang CD, et al. The prognostic landscape of genes and infiltrating immune cells across human cancers. Nat Med. 2015;21:938–945. doi:10.1038/nm.3909.
- Tredan O, Galmarini CM, Patel K, Tannock IF. Drug resistance and the solid tumor microenvironment. J Natl Cancer Inst. 2007;99:1441–1454. doi:10.1093/jnci/djm135.
- Restifo NP. A “big data” view of the tumor “immunome”. Immunity. 2013;39:631–632. doi:10.1016/j.immuni.2013.10.002.
- Atretkhany KN, Drutskaya MS, Nedospasov SA, Grivennikov SI, Kuprash DV. Chemokines, cytokines and exosomes help tumors to shape inflammatory microenvironment. Pharmacol Ther. 2016;168:98–112. doi:10.1016/j.pharmthera.2016.09.011.
- Lippitz BE. Cytokine patterns in patients with cancer: a systematic review. Lancet Oncol. 2013;14:e218–228. doi:10.1016/S1470-2045(12)70582-X.
- Wong HS, Chang CM, Liu X, Huang WC, Chang WC. Characterization of cytokinome landscape for clinical responses in human cancers. Oncoimmunology. 2016;5:e1214789. doi:10.1080/2162402X.2016.1214789.
- Barretina J, Caponigro G, Stransky N, Venkatesan K, Margolin AA, Kim S, Wilson CJ, Lehar J, Kryukov GV, Sonkin D, et al. The cancer cell line encyclopedia enables predictive modelling of anticancer drug sensitivity. Nature. 2012;483:603–607. doi:10.1038/nature11003.
- Cao Q, Zhou M, Wang X, Meyer CA, Zhang Y, Chen Z, Li C, Liu XS. CaSNP: a database for interrogating copy number alterations of cancer genome from SNP array data. Nucleic Acids Res. 2011;39:D968–974. doi:10.1093/nar/gkq997.
- Cancer Genome Atlas Research, N. Integrated genomic characterization of papillary thyroid carcinoma. Cell. 2014;159:676–690. doi:10.1016/j.cell.2014.09.050.
- Cancer Genome Atlas Research, N. Integrated genomic analyses of ovarian carcinoma. Nature. 2011;474:609–615. doi:10.1038/nature10166.
- Bindea G, Mlecnik B, Tosolini M, Kirilovsky A, Waldner M, Obenauf AC, Angell H, Fredriksen T, Lafontaine L, Berger A, et al. Spatiotemporal dynamics of intratumoral immune cells reveal the immune landscape in human cancer. Immunity. 2013;39:782–795. doi:10.1016/j.immuni.2013.10.003.
- Tirosh I, Izar B, Prakadan SM, Wadsworth MH 2nd, Treacy D, Trombetta JJ, Rotem A, Rodman C, Lian C, Murphy G, et al. Dissecting the multicellular ecosystem of metastatic melanoma by single-cell RNA-seq. Science. 2016;352:189–196. doi:10.1126/science.aad0501.
- Liu L, Greger J, Shi H, Liu Y, Greshock J, Annan R, Halsey W, Sathe GM, Martin AM, Gilmer TM. Novel mechanism of lapatinib resistance in HER2-positive breast tumor cells: activation of AXL. Cancer Res. 2009;69:6871–6878. doi:10.1158/0008-5472.CAN-08-4490.
- Kang CW, Jang KW, Sohn J, Kim SM, Pyo KH, Kim H, Yun MR, Kang HN, Kim HR, Lim SM, et al. Antitumor activity and acquired resistance mechanism of dovitinib (TKI258) in RET-rearranged lung adenocarcinoma. Mol Cancer Ther. 2015;14:2238–2248. doi:10.1158/1535-7163.MCT-15-0350.
- Angelova M, Charoentong P, Hackl H, Fischer ML, Snajder R, Krogsdam AM, Waldner MJ, Bindea G, Mlecnik B, Galon J, et al. Characterization of the immunophenotypes and antigenomes of colorectal cancers reveals distinct tumor escape mechanisms and novel targets for immunotherapy. Genome Biol. 2015;16:64. doi:10.1186/s13059-015-0620-6.
- Li B, Severson E, Pignon JC, Zhao H, Li T, Novak J, Jiang P, Shen H, Aster JC, Rodig S, et al. Comprehensive analyses of tumor immunity: implications for cancer immunotherapy. Genome Biol. 2016;17:174. doi:10.1186/s13059-016-1028-7.
- Varn FS, Andrews EH, Mullins DW, Cheng C. Integrative analysis of breast cancer reveals prognostic haematopoietic activity and patient-specific immune response profiles. Nat Commun. 2016;7:10248. doi:10.1038/ncomms10248.
- Mlecnik B, Bindea G, Kirilovsky A, Angell HK, Obenauf AC, Tosolini M, Church SE, Maby P, Vasaturo A, Angelova M, et al. The tumor microenvironment and immunoscore are critical determinants of dissemination to distant metastasis. Sci Transl Med. 2016;8:327ra326. doi:10.1126/scitranslmed.aad6352.
- Mlecnik B, Bindea G, Angell HK, Sasso MS, Obenauf AC, Fredriksen T, Lafontaine L, Bilocq AM, Kirilovsky A, Tosolini M, et al. Functional network pipeline reveals genetic determinants associated with in situ lymphocyte proliferation and survival of cancer patients. Sci Transl Med. 2014;6:228ra237. doi:10.1126/scitranslmed.3007240.
- Dranoff G. Cytokines in cancer pathogenesis and cancer therapy. Nat Rev Cancer. 2004;4:11–22. doi:10.1038/nrc1252.
- Finn OJ. Cancer immunology. N Engl J Med. 2008;358:2704–2715. doi:10.1056/NEJMra072739.
- Parker BS, Rautela J, Hertzog PJ. Antitumour actions of interferons: implications for cancer therapy. Nat Rev Cancer. 2016;16:131–144. doi:10.1038/nrc.2016.14.
- Bertazza L, Mocellin S. The dual role of tumor necrosis factor (TNF) in cancer biology. Curr Med Chem. 2010;17:3337–3352. doi:10.2174/092986710793176339.
- Snell LM, McGaha TL, Brooks DG. Type I interferon in chronic virus infection and cancer. Trends Immunol. 2017;38:542–557. doi:10.1038/nbt.2938.
- Di Franco S, Turdo A, Todaro M, Stassi G. Role of type I and II interferons in colorectal cancer and melanoma. Front Immunol. 2017;8:878. doi:10.3389/fimmu.2017.00878.
- Zitvogel L, Galluzzi L, Kepp O, Smyth MJ, Kroemer G. Type I interferons in anticancer immunity. Nat Rev Immunol. 2015;15:405–414. doi:10.1038/nri3845.
- Roberts NJ, Zhou S, Diaz LA Jr., Holdhoff M. Systemic use of tumor necrosis factor alpha as an anticancer agent. Oncotarget. 2011;2:739–751. doi:10.18632/oncotarget.v2i10.
- Van Horssen R, Ten Hagen TL, Eggermont AM. TNF-alpha in cancer treatment: molecular insights, antitumor effects, and clinical utility. Oncologist. 2006;11:397–408. doi:10.1634/theoncologist.11-4-397.
- Malek JA, Mery E, Mahmoud YA, Al-Azwani EK, Roger L, Huang R, Jouve E, Lis R, Thiery JP, Querleu D, et al. Copy number variation analysis of matched ovarian primary tumors and peritoneal metastasis. PLoS One. 2011;6:e28561. doi:10.1371/journal.pone.0028561.
- Pages F, Berger A, Camus M, Sanchez-Cabo F, Costes A, Molidor R, Mlecnik B, Kirilovsky A, Nilsson M, Damotte D, et al. Effector memory T cells, early metastasis, and survival in colorectal cancer. N Engl J Med. 2005;353:2654–2666. doi:10.1056/NEJMoa051424.
- Galon J, Costes A, Sanchez-Cabo F, Kirilovsky A, Mlecnik B, Lagorce-Pages C, Tosolini M, Camus M, Berger A, Wind P, et al. Type, density, and location of immune cells within human colorectal tumors predict clinical outcome. Science. 2006;313:1960–1964. doi:10.1126/science.1129139.
- Han A, Glanville J, Hansmann L, Davis MM. Linking T-cell receptor sequence to functional phenotype at the single-cell level. Nat Biotechnol. 2014;32:684–692. doi:10.1038/nbt.2938.
- Liu X, Venkataraman G, Lin J, Kiyotani K, Smith S, Montoya M, Nakamura Y, Kline J. Highly clonal regulatory T-cell population in follicular lymphoma - inverse correlation with the diversity of CD8+ T cells. Oncoimmunology. 2015;4:e1002728. doi:10.1080/2162402X.2014.1002728.
- Jang M, Yew PY, Hasegawa K, Ikeda Y, Fujiwara K, Fleming GF, Nakamura Y, Park JH. Characterization of T cell repertoire of blood, tumor, and ascites in ovarian cancer patients using next generation sequencing. Oncoimmunology. 2015;4:e1030561. doi:10.1080/2162402X.2015.1030561.
- Levina V, Su Y, Nolen B, Liu X, Gordin Y, Lee M, Lokshin A, Gorelik E. Chemotherapeutic drugs and human tumor cells cytokine network. Int J Cancer. 2008;123:2031–2040. doi:10.1002/ijc.v123:9.
- Jones VS, Huang RY, Chen LP, Chen ZS, Fu L, Huang RP. Cytokines in cancer drug resistance: cues to new therapeutic strategies. Biochim Biophys Acta. 2016;1865:255–265.
- Mermel CH, Schumacher SE, Hill B, Meyerson ML, Beroukhim R, Getz G. GISTIC2.0 facilitates sensitive and confident localization of the targets of focal somatic copy-number alteration in human cancers. Genome Biol. 2011;12:R41. doi:10.1186/gb-2011-12-4-r41.
- Davis S, Meltzer PS. GEOquery: a bridge between the gene expression omnibus (GEO) and bioconductor. Bioinformatics. 2007;23:1846–1847. doi:10.1093/bioinformatics/btm254.
- Consortium GT. The genotype-tissue expression (GTEx) project. Nat Genet. 2013;45:580–585. doi:10.1038/ng.2653.
- Yan X, Hu Z, Feng Y, Hu X, Yuan J, Zhao SD, Zhang Y, Yang L, Shan W, He Q, et al. Comprehensive genomic characterization of long non-coding RNAs across human cancers. Cancer Cell. 2015;28:529–540. doi:10.1016/j.ccell.2015.09.006.
- Barbie DA, Tamayo P, Boehm JS, Kim SY, Moody SE, Dunn IF, Schinzel AC, Sandy P, Meylan E, Scholl C, et al. Systematic RNA interference reveals that oncogenic KRAS-driven cancers require TBK1. Nature. 2009;462:108–112. doi:10.1038/nature08460.