
ABSTRACT
Tryptophan (Trp) metabolism is an important target in immuno-oncology as it represents a powerful immunosuppressive mechanism hijacked by tumors for protection against immune destruction. However, it remains unclear how tumor cells can proliferate while degrading the essential amino acid Trp. Trp is incorporated into proteins after it is attached to its tRNA by tryptophanyl-tRNA synthestases. As the tryptophanyl-tRNA synthestases compete for Trp with the Trp-catabolizing enzymes, the balance between these enzymes will determine whether Trp is used for protein synthesis or is degraded. In human cancers expression of the Trp-degrading enzymes indoleamine-2,3-dioxygenase-1 (IDO1) and tryptophan-2,3-dioxygenase (TDO2) was positively associated with the expression of the tryptophanyl-tRNA synthestase WARS. One mechanism underlying the association between IDO1 and WARS identified in this study is their joint induction by IFNγ released from tumor-infiltrating T cells. Moreover, we show here that IDO1- and TDO2-mediated Trp deprivation upregulates WARS expression by activating the general control non-derepressible-2 (GCN2) kinase, leading to phosphorylation of the eukaryotic translation initiation factor 2α (eIF2α) and induction of activating transcription factor 4 (ATF4). Trp deprivation induced cytoplasmic WARS expression but did not increase nuclear or extracellular WARS levels. GCN2 protected the cells against the effects of Trp starvation and enabled them to quickly make use of Trp for proliferation once it was replenished. Computational modeling of Trp metabolism revealed that Trp deficiency shifted Trp flux towards WARS and protein synthesis. Our data therefore suggest that the upregulation of WARS via IFNγ and/or GCN2-peIF2α-ATF4 signaling protects Trp-degrading cancer cells from excessive intracellular Trp depletion.
Introduction
Tryptophan (Trp) is the least abundant amino acid of the standard genetic code. As an essential amino acid it cannot be synthesized in humans but has to be taken up with the diet.Citation1 In addition to serving as a building block for proteins, Trp degradation to kynurenine (Kyn) and downstream metabolites has evolved as a powerful immunoregulatory mechanismCitation2,Citation3. In humans Trp degradation is catalyzed by three isoenzymes, indoleamine-2,3-dioxygenase-1 and −2 (IDO1, 2) and tryptophan-2,3-dioxygenase (TDO2). While IDO1 and TDO2 are recognized as major Trp degrading enzymes, the role of IDO2 is less clear as it rather inefficiently catalyzes the conversion of Trp to KynCitation4. IDO1 is highly induced almost ubiquitously by pro-inflammatory stimuli such as interferon gamma (IFNγ)Citation5, while TDO2 is constitutively expressed in the liver, where it regulates systemic Trp levelsCitation3.
Trp degradation is thought to suppress immune cells in two ways: Trp catabolites promote the differentiation of regulatory T cells (Treg)Citation6–Citation8 and induce apoptosis of T cellsCitation9. On the other hand, Trp depletion has been implicated in the proliferation arrest of CD8 + T cellsCitation10 by the accumulation of uncharged transfer RNA (tRNA) and subsequent activation of the general control non-derepressible-2 (GCN2) kinase pathwayCitation11,Citation12, while Gcn2 in T cells has recently been shown to be dispensable for the suppression of antitumor immune responses in experimental melanomasCitation13.
Trp degrading enzymes are expressed in many cancers. IDO1, for instance, is expressed in about 58% of human cancersCitation14, and also TDO2 is present in multiple cancer entities including melanoma, ovarian carcinoma, hepatic carcinoma, non-small cell lung cancer, renal cell carcinoma, bladder cancer, breast cancer and glioblastomaCitation15–Citation17. As the degradation of the essential amino acid Trp is a key mechanism for immune evasion in many tumors, the question arises how the tumor cells concomitantly sustain their capacity for protein synthesis and excessive proliferation. The cytoplasmic tryptophanyl-tRNA synthetase (TrpRS) WARS and the mitochondrial TrpRS WARS2 attach Trp to their tRNAs, which is required for the incorporation of Trp into proteins. We hypothesized that increased expression of TrpRS may enable the cancer cells to incorporate Trp into their proteins despite low Trp levels. We therefore investigated the regulation of the TrpRS WARS and WARS2 upon Trp degradation and their balance with the Trp catabolizing enzymes.
Results
IDO1 and WARS are jointly induced by IFNγ produced by tumor infiltrating T cells in breast cancer, colon cancer and B cell lymphoma
To investigate if a relationship exists between the expression of IDO1 and the two TrpRS WARS and WARS2 we analyzed gene expression data of breast cancer, colon carcinoma and B cell lymphoma, as these neoplasms have been reported to express IDO1Citation18. We observed a strong positive correlation between IDO1 and WARS but not WARS2 (). T cell-specific genes such as CD2 and CD3D also strongly correlated with WARS and IDO1, suggesting that their expression is induced by factors released by T cells (, Fig. S1A, and B). Furthermore, IDO1 and WARS positively correlated with the expression of IFNG as well as the IFNγ-induced genes STAT1 and IRF1Citation19, suggesting that IDO1 and WARS induction is mediated through IFNγ (, Fig. S1 C and D).
Figure 1. IDO1 and WARS correlate with each other and are both associated with the expression of T cell markers and with IFNγ signaling.
(A) Left: Correlation between IDO1 and WARS expression in breast cancer, colon cancer and B-cell lymphoma. Right: IDO1 and WARS2 expression in breast cancer, colon cancer and B-cell lymphoma do not correlate with each other (n = 124 for breast cancer, n = 355 for colon cancer, n = 215 for lymphoma, Spearman’s rank correlation). (B) WARS (red) and IDO1 (blue) expression are significantly correlated with the expression of the T cell markers CD3D and CD2, and (C) with the expression of IFNG, STAT1 and IRF1 in breast cancer (n = 124, Spearman’s rank correlation). (D) IDO1, WARS and WARS2 mRNA levels measured by qRT-PCR and IDO1 and WARS protein measured by Western blot after treatment of the human breast cancer cell lines MCF7, BT-474 and MDA-MB-231 with supernatants of activated CD4 + T cells in the absence and presence of an IFNγ blocking antibody. (E) IDO1, WARS and WARS2 mRNA levels measured by qRT-PCR and IDO1 and WARS protein measured by Western blot after treatment of MCF7 cells with 1000 U/ml recombinant IFNγ. All data are expressed as mean ± s.e.m. Statistical significance is assumed at P < 0.05 (*P < 0.05, **P < 0.01, ***P <0.001).
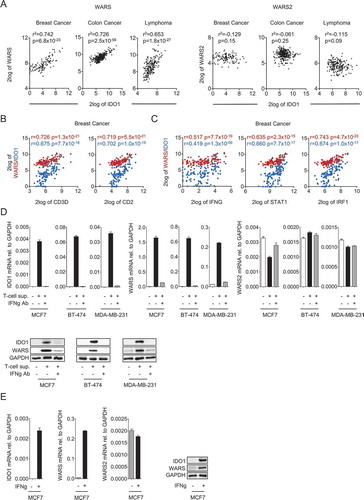
Indeed, supernatants of activated primary human T cells induced IDO1 and WARS mRNA and protein expression in breast cancer cells, while they did not increase WARS2 levels (). The induction of IDO1 and WARS by the supernatants of activated primary human T cells was abrogated by addition of an IFNγ blocking antibody (), confirming that IFNγ is the T cell factor inducing IDO1 and WARS. In keeping with this, also recombinant IFNγ induced IDO1 and WARS, but not WARS2 expression ().
TDO2 and IDO1 activity upregulate WARS expression
As TDO2 also degrades Trp in cancer cells, we next analyzed whether WARS or WARS2 gene expression correlated with TDO2. To explore if a relationship exists between the expression of TDO2 and the two TrpRS, we selected glioma, breast cancer, and ovarian carcinoma as cancer entities, which are known to express high TDO2 levelsCitation15-Citation17. Indeed TDO2 expression correlated with WARS but not WARS2 (), although the correlations were less strong than for IDO1 (). We next investigated whether the correlation between WARS and TDO2 is also mediated by joint induction through IFNγ. However, our data did not support this hypothesis, as recombinant IFNγ failed to induce TDO2 in two distinct glioblastoma cell lines (). We therefore tested whether WARS induction is mediated by TDO2 itself. TDO2 overexpression in LN229 glioblastoma cells lacking endogenous TDO2 () decreased Trp and increased Kyn levels (), confirming that the overexpressed TDO2 efficiently degraded Trp. In line with our hypothesis also WARS expression was induced by TDO2 overexpression (), suggesting a causal relationship between TDO2 expression and WARS induction. In contrast, WARS2 was reduced in TDO2 overexpressing cells ().
Figure 2. TDO2 and IDO1 activity upregulate WARS expression.
(A) Correlation between TDO2 and WARS expression in human glioma, breast cancer, and ovarian cancer. (B) TDO2 and WARS2 expression in glioma, breast cancer, and ovarian cancer do not correlate with each other (n = 50 for glioma, n = 124 for breast cancer, n = 90 for ovarian cancer, Spearman’s rank correlation). (C) Treatment of A172 and LN18 glioblastoma cells with 100 U/ml or 1000 U/ml IFNγ did not alter TDO2 mRNA expression measured by qRT-PCR. (D) TDO2 mRNA expression in LN229 glioblastoma cells after overexpression of TDO2. (E) HPLC chromatograms showing Trp (top) and Kyn (bottom) measured in the supernatants of control-transduced (blue) and TDO2-overexpressing (red) LN229 glioblastoma cells. (F) WARS mRNA expression measured by qRT-PCR in control-transduced and TDO2-overexpressing LN229 cells. (G) WARS2 mRNA expression measured by qRT-PCR in control-transduced and TDO2-overexpressing LN229 cells. (H) IDO1 mRNA expression in HEK 293 cells after overexpression of IDO1. (I) HPLC chromatograms showing Trp (top) and Kyn (bottom) measured in the supernatants of control-transfected (blue) and IDO1-overexpressing (red) HEK 293 cells. (J) WARS mRNA expression measured by qRT-PCR in control-transfected and IDO1-overexpressing HEK 293 cells. (K) WARS2 mRNA expression measured by qRT-PCR in control-transfected and IDO1-overexpressing HEK 293 cells. All data are expressed as mean ± s.e.m. Statistical significance is assumed at P < 0.05 (*P < 0.05, **P < 0.01, ***P <0.001).
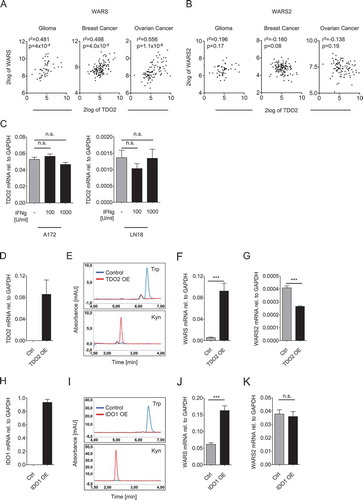
As TDO2 degrades Trp, it would be likely that Trp degradation is responsible for WARS induction. To corroborate this we overexpressed IDO1 (), the other enzyme that degrades Trp to Kyn (). Similarly to TDO2 also IDO1 overexpression induced WARS () but not WARS2 (). Taken together our data suggest that both IDO1 and TDO2 act upstream of WARS by inducing its expression.
Trp depletion upregulates WARS expression
IDO1 and TDO2 both degrade Trp to Kyn, leading to Trp deprivation and accumulation of Trp metabolitesCitation3. Therefore, the question arises whether the accumulation of Trp metabolites or the depletion of Trp induces WARS. To this end we cultured A172 glioblastoma cells, which exhibit constitutive TDO2 activityCitation16,Citation17, for 5 days in complete medium without or with additional Trp supplementation. Trp supplementation, a condition that promotes the accumulation of Trp metabolites, reduced WARS expression (), while not affecting WARS2 (). Conversely, Trp starvation induced WARS mRNA () in cell lines with high (A172) and medium (LN18) TDO2 expression, high IDO1 expression (SKOV3) as well as in cells that do not express any Trp-degrading enzymes (LN229)Citation16,Citation20. The increase in WARS mRNA upon Trp starvation also translated into increased WARS protein levels as assessed in LN229 glioblastoma cells. (). Similar to IDO1 overexpression (), also Trp starvation did not alter WARS2 levels (). Based on these results we conclude that the degradation of Trp induces WARS not through the accumulation of Trp metabolites but by depleting Trp.
Figure 3. Trp depletion upregulates WARS expression.
(A) WARS mRNA expression measured by qRT-PCR in A172 glioblastoma cells, which exhibit constitutive TDO2 activity, cultured for 120 h in normal DMEM or with additional supplementation of 78 µM Trp after 72 h. (B) WARS2 mRNA expression measured by qRT-PCR in A172 glioblastoma cells under the conditions described in (A). (C) WARS mRNA expression measured by qRT-PCR in glioblastoma (A172, LN18, LN229) and ovarian carcinoma cells (SKOV-3) after 24 h of cultivation in medium containing 78 µM versus no Trp. (D) WARS protein levels in LN229 glioblastoma cells detected by Western blot after 48 h or 72 h of cultivation in medium containing 78 µM or no Trp. GAPDH served as loading control (E) WARS2 mRNA expression measured by qRT-PCR was not altered by the conditions described in (C). (F) WARS protein levels in the cytoplasmic or nuclear fraction of LN229 glioblastoma cells detected by Western blot after 48 h of cultivation in medium containing 78 µM or no Trp. GAPDH served as loading control for the cytoplasmic fraction, lamin A/C as loading control for the nuclear fraction. (G) WARS protein concentrations measured by ELISA in the supernatants of LN229 and A172 glioblastoma cells cultured for 48 h in the presence or absence of Trp. All data are expressed as mean ± s.e.m. Statistical significance is assumed at P < 0.05 (*P < 0.05, **P < 0.01, ***P <0.001).
In addition to attaching Trp to its specific tRNA, which occurs mainly in the cytoplasm, WARS is involved in cellular signaling processes in the nucleus or in the extracellular spaceCitation21-Citation24. To investigate if Trp starvation affects WARS expression in specific cellular locations, we analyzed WARS protein expression in cytoplasmic and nuclear cell fractions () as well as in cell supernatants (). In the cytoplasmic fraction WARS protein expression was enhanced in response to Trp starvation (). In contrast, in the nuclear fraction WARS expression was not altered by Trp starvation (). In cell supernatants of LN229 and A172 glioblastoma cells WARS protein expression was reduced in response to 48 h of Trp starvation (). Taken together, our results suggest that Trp starvation increases cytoplasmic WARS protein levels but not nuclear or extracellular WARS expression.
GCN2-peIF2α-ATF4 signaling mediates the upregulation of WARS in response to trp depletion
As Trp depletion mediates WARS induction and is known to activate GCN2Citation10, we next asked whether GCN2 mediates the upregulation of WARS. For this purpose, GCN2 was knocked down in LN229 glioblastoma cells that were cultured with or without Trp (). GCN2 knockdown inhibited WARS induction by Trp deprivation on both mRNA () and protein () level. However, as expected it did not affect WARS2 (). Similar results were obtained in Gcn2 knockout mouse embryonic fibroblasts (MEFs) (). These results suggest that GCN2 mediates the induction of WARS in response to Trp deprivation.
Figure 4. GCN2-peIF2a-ATF4 signaling mediates the upregulation of WARS in response to Trp depletion.
(A) GCN2 mRNA expression measured by qRT-PCR in LN229 cells after knockdown of GCN2 by siRNA cultured in the absence and presence of 78 µM Trp for 24 h. (B) WARS mRNA expression measured by qRT-PCR and (C) WARS and GCN2 protein expression detected by Western blot under the conditions described in (A). GAPDH served as loading control. (D) WARS2 mRNA expression measured by qRT-PCR under the conditions described in (A). (E) Gcn2 mRNA expression in wildtype (wt) and Gcn2 −/- MEFs cultured in the absence and presence of 78 µM Trp for 24 h. (F) Wars mRNA expression measured by qRT-PCR and (G) WARS and GCN2 protein expression detected by Western blot under the conditions described in (E). Tubulin served as loading control. (H) Wars2 mRNA expression measured by qRT-PCR under the conditions described in (E). (I) WARS mRNA expression measured by qRT-PCR in full DMEM medium (DMEM), in amino acid-free DMEM supplemented with all amino acids (+ all AA) and in amino acid-free DMEM supplemented with all but each of the essential amino acids (EAA). (J) peIF2a and eIF2a detected by Western blot in LN229 cells cultured in the presence (+) or absence (-) of 78 µM Trp for 24 h. (K) Wars mRNA expression measured by qRT-PCR in MEFs that express wildtype Eif2a (SS) or an Eif2a version, in which serine 51 is mutated to an alanine and cannot be phosphorylated by Gcn2 (AA). MEFs were cultured for 24 h in the presence or absence of 78 µM Trp. (L) ATF4 protein detected by Western blot in LN229 cells cultured for 24 h in the presence or absence of 78 µM Trp. GAPDH served as loading control. (M) WARS mRNA expression measured by qRT-PCR in LN229 cells after knockdown of ATF4 by siRNA cultured in the absence and presence of 78 µM Trp for 24 h. (N) Correlation between ATF4 and WARS expression in human glioma (n = 50, Spearman’s rank correlation). All data are expressed as mean ± s.e.m. Statistical significance is assumed at P < 0.05 (*P < 0.05, **P < 0.01, ***P <0.001). (O) Lolli-plot showing the absolute fold changes of all the tRNA synthetases in a microarray of U87-MG cells upon 24 h of Trp starvation.
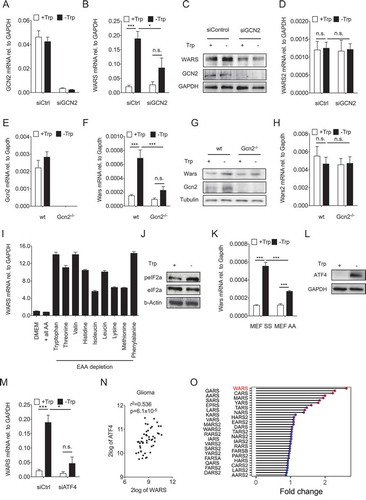
GCN2 is activated by sensing of uncharged tRNA and therefore should not be specific for Trp starvationCitation25,Citation26. In keeping with this, depletion of any essential amino acid resulted in an induction of WARS mRNA, albeit to different levels with depletion of Trp, valine and phenylalanine being the strongest inducers of WARS ().
To further elucidate the downstream effects of GCN2 activation we next set out to establish whether Trp starvation leads to phosphorylation of the translation initiation factor eIF2α as GCN2 is known to inhibit eIF2α by phosphorylationCitation27. Indeed, Trp starvation enhanced eIF2α phosphorylation at serine 51 (). To investigate whether eIF2α phosphorylation is required for WARS induction by Trp starvation, we used MEFs that express either wildtype eIF2α (SS) or a version in which serine 51 is mutated to an alanine (AA) and cannot be phosphorylated by Gcn2 (). Trp-starved AA-MEFs showed reduced Wars expression, as compared to SS-MEFs, indicating that eIF2α phosphorylation is required for the induction of WARS upon Trp starvation ().
eIF2α phosphorylation enhances translationCitation28 and transcription of ATF4Citation29. In line, ATF4 protein () and ATF4 mRNA (Fig. S2) levels increased upon Trp starvation. Importantly, knockdown of ATF4 in LN229 cells (Fig. S2) impaired WARS induction by Trp starvation (). Hence, ATF4 mediates enhanced WARS expression in Trp-deprived cells. In agreement, WARS and ATF4 levels positively correlated in human malignant gliomas ().
As ATF4 has been reported to regulate the transcription of many tRNA synthetases Citation25,Citation30–Citation32, we next compared the expression of WARS to that of all other tRNA synthetases in U87-MG glioblastoma cells that were Trp starved for 24 h. Trp starvation most strongly induced WARS mRNA expression (2,6 fold; ). In addition, 7 other tRNA synthetases (glycyl-tRNA synthetase, GARS; cysteinyl-tRNA synthetase, CARS; alanyl-tRNA synthetase, AARS; methionyl-tRNA synthetase, MARS; seryl-tRNA synthetase, SARS; tyrosyl-tRNA synthetase, YARS and glutamyl-prolyl-tRNA synthetase, EPRS) were upregulated more than 1.5 fold. All of these tRNA synthetases are expressed in the cytoplasm, suggesting that – as already observed for WARS and WARS2 – the cytoplasmic and not the mitochondrial tRNA synthetases are primarily regulated though amino acid limitation.
Taken together, our results indicate that Trp starvation upregulates WARS expression through the GCN2-peIF2a-ATF4 axis.
Gcn2 protects cells against the effects of Trp shortage and enables an optimal utilization of Trp when it is replenished
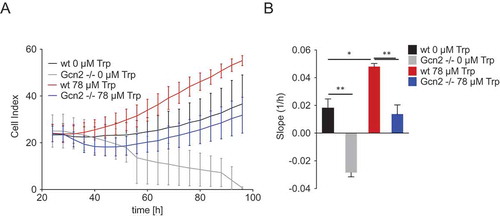
Next, we aimed to assess the effect of the observed WARS upregulation on the proliferation and survival of Trp-starved cancer cells. As we wanted to investigate the impact of the upregulation of WARS and not the general effect of WARS on cell proliferation and survival, we did not knockdown WARS, but analyzed how GCN2, which is required for WARS upregulation, modulates the cellular response to Trp starvation and replenishment. We reasoned that if the upregulation of WARS is protective against Trp depletion then GCN2 should also protect cells against Trp depletion. To test if GCN2 indeed confers an advantage on cells coping with Trp shortage, we analyzed the proliferation of wt and Gcn2 -/- MEFs under Trp-free conditions and in response to Trp replenishment after 24 h of Trp starvation. At 24 h of Trp starvation wt and Gcn2 -/- MEFs showed similar proliferation (). However, after that, the wt MEFs slowly proliferated further, whereas the Gcn2 -/- MEFs showed a strong decrease in proliferation (), indicated by a negative slope (1/h) (). Re-addition of Trp increased the proliferation of both wt and Gcn2 -/- MEFs, however, proliferation of Gcn2 -/- MEFs only recovered to levels similar to those of Trp-deprived wt cells (). Therefore, GCN2 seems to protect cells against the effects of Trp starvation and enables them to quickly make use of Trp when it is replenished.
Figure 5. Gcn2 protects cells against the effects of Trp shortage and enables them to optimally make use of Trp when it is replenished.
(A) MEFs were cultured in the presence or absence of 78 µM Trp following a 24 h period of Trp starvation. Cell proliferation of wt and Gcn2-/- MEFs was monitored by the xCELLigence RTCA system. Displayed are the values measured every 4 h over a 3-day period. (B) Slopes of the proliferation curves depicted in (A). Data are expressed as mean ± s.e.m. Statistical significance is assumed at P < 0.05 (*P < 0.05, **P < 0.01, ***P <0.001).
Trp shortage channels trp towards WARS and protein synthesis
Our results presented so far demonstrate that IDO1 and TDO2 act upstream of WARS (). As IDO1 and WARS are induced in parallel by IFNγ (), IFNγ and Trp deprivation might have additive effects on WARS expression. To test this, we stimulated LN18 glioblastoma cells with IFNγ, deprived them of Trp or used a combination of both (). In support of our hypothesis, the combination of IFNγ with Trp deprivation enhanced WARS mRNA expression more strongly than either treatment alone ().
Figure 6. Trp shortage channels Trp towards WARS and protein synthesis.
(A) Cartoon depicting the mechanisms underlying the regulation of WARS by Trp-degrading enzymes. (B) WARS mRNA expression measured by qRT-PCR of LN18 glioblastoma cells treated with 0, 100 and 1000 U/ml of IFNγ in the presence and absence of 78 µM Trp. (C) Scheme depicting the most prominent flux changes in Trp metabolism upon Trp depletion. Fluxes were calculated by integration of microarray data from U87-MG glioblastoma cells into a computational model of Trp metabolism. Bar heights represent relative change in percentage between cells growing in normal media and cells growing without Trp. All data are expressed as mean ± s.e.m.
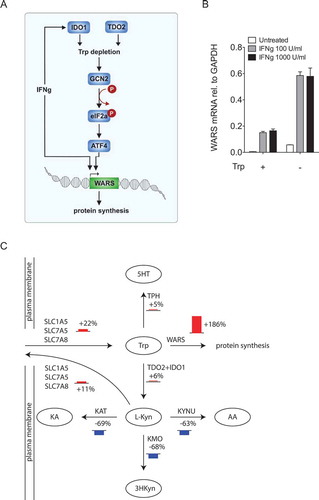
As WARS is necessary for the incorporation of Trp into proteins, we propose that WARS induction in response to Trp depletion channels Trp into protein synthesis (). In this scenario WARS and the Trp-metabolizing enzymes compete for Trp and the balance of these enzymes will determine whether Trp is used for protein synthesis or is converted to other metabolites. Computational modelling provides a means to quantitatively analyze metabolite usage by different pathways. To obtain an overview of the fate of Trp under conditions of Trp deficiency, we integrated gene expression data of U87-MG glioblastoma cells under Trp sufficiency or deprivation, into an extended version of a previously published mathematical model of Trp metabolism that is based on existing kinetic data for the enzymatic conversions and transportersCitation33. In line with the previously described upregulation of amino acid transporters in response to Trp deprivationCitation34,Citation35, the model predicted increased flux of Trp into the cells (). Kyn is transported by some of the same antiporters as Trp.Citation36 Therefore, the increase of these antiporters also enhanced flux of Kyn out of the cells resulting in reduced flux down the Kyn pathway (). Most prominently, Trp deficiency shifted Trp flux towards WARS and thus protein synthesis (), supporting our hypothesis, that WARS upregulation enables the cells to maintain protein synthesis despite low levels of Trp.
Discussion
We show here that in addition to being induced concomitantly with IDO1 through IFNγ signalingCitation5,Citation37,Citation38,(,WARS is directly upregulated in response to Trp shortage caused by IDO1 or TDO2 activity (). Trp shortage mediates WARS upregulation by signaling via the GCN2-peIF2a-ATF4 axis (), as low levels of Trp result in the accumulation of uncharged tRNAs, which activate the stress kinase GCN2Citation10. GCN2 then phosphorylates its substrate, eIF2a leading to reduced global protein synthesis, but increased translation of specific mRNAs such as ATF4Citation27,Citation28. Our results reveal that expression of GCN2 and ATF4 as well as phosphorylation of eIF2a are each required for the induction of WARS upon Trp degradation (). ATF4 upregulation then most likely induces WARS expression via direct promoter bindingCitation30.
In contrast to WARS, mitochondrial WARS2 did not correlate with IDO1 or TDO2 (; ) and was regulated neither by IFNγ ()Citation39 nor by GCN2-peIF2a-ATF4 signaling (). Both WARS and WARS2 belong to the class I aminoacyl-tRNA synthetases, which contain a characteristic Rossman fold catalytic domainCitation39. However, WARS2 only aligns to the carboxyl-terminal part of WARS and thus the two enzymes only share 11% sequence identityCitation39. The two TrpRS bind tRNAs with different anticodons. WARS2 binds mitochondrial tRNATrp with the anticodon UCA, which codes for Trp in the mitochondria of humansCitation40, while WARS binds cytoplasmic tRNATrp, which contains the standard anticodon CCA. Little is known about free Trp concentrations in mitochondria and it is therefore not clear how mitochondrial Trp concentrations are affected by Trp depletion. Our results reveal that Trp starvation, which most strongly induces WARS, generally appears to upregulate the expression of cytoplasmic rather than mitochondrial tRNA synthetases ().
In addition to its role in aminoacylation, WARS, like many other tRNA synthethasesCitation41-Citation43, has been implicated in cellular signaling. A truncated version of WARS is secreted in response to IFNγ and elicits angiostatic effectsCitation23 through inhibition of endothelial cell-cell junctionsCitation24. Upon infection, monocytes secrete full-length WARS, which induces phagocytosis and chemokine production in macrophagesCitation21. We therefore tested if the upregulation of WARS in response to Trp shortage also increases extracellular WARS protein levels. However, Trp starvation reduced WARS protein levels in the cell supernatants (), indicating that less WARS is secreted under Trp starvation conditions. Upon IFNγ stimulation, WARS has been shown to translocate into the nucleus, bridge DNA-dependent protein kinase (DNA-PKcs) to poly(ADP-ribose) polymerase 1 (PARP-1), which stimulates PARylation of DNA-PKcs, in turn enhancing the kinase activity of DNA-PKcs for p53 phosphorylation and activationCitation22. Interestingly, an empty Trp-AMP pocket is necessary for the nuclear function of WARSCitation22, which is likely to be present in conditions of Trp depletion. We therefore originally hypothesized that WARS induction through GCN2-peIF2a-ATF4 signaling may contribute to p53 activation observed under nutritional stressCitation44. However, we found that the upregulation of WARS expression under conditions of Trp shortage, primarily affected cytoplasmic WARS, while the expression of WARS in the nucleus did not change (). Hence, Trp starvation appears to primarily modulate WARS levels involved in protein synthesis.
As Trp is the least abundant of the standard proteinogenic amino acids, it is assumed to play a rate-limiting role during protein synthesis. Diverse mechanisms including the suppression of mTOR signalling and the induction of autophagy have been reported to adapt cells to Trp starvationCitation45,Citation46. Furthermore, activation of GCN2-peIF2α-ATF4 signaling by Trp starvation was shown to mediate the upregulation of Trp transportersCitation35, suggesting that the GCN2-peIF2α-ATF4 axis coordinates multiple adaptations to Trp starvation. Indeed, GCN2 enabled cells to slowly proliferate despite Trp depletion and to rapidly start proliferating upon Trp replenishment (). Most likely the regulation of both Trp transporters and WARS act downstream of GCN2 to adapt the cells to low Trp conditions and to enable them to optimally make use of Trp once it is available again.
Interestingly, also IFNγ has been reported to induce a Trp-selective transporterCitation47 and IFNγ-induced WARS was recently shown to augment intracellular Trp levelsCitation48. The redundancy of IFNγ (which leads to Trp degradation via IDO1 induction), and GCN2-peIF2α-ATF4 signaling (which is activated upon low Trp levels), in inducing WARS and Trp transporters may hint to the importance of securing sufficient intracellular Trp levels. Most likely, IFNγ will already induce WARS and Trp transporters before Trp levels low enough to activate GCN2 are reached. Of note, IFNγ-induced WARS mRNA was further increased in response to Trp starvation (), suggesting that a more pronounced upregulation of WARS is possible if Trp levels continue to decline.
Although several studies have shown that amino acid transporters are upregulated in response to Trp deprivation to increase Trp importCitation34,Citation35,Citation47,Citation49, it is unclear whether this intracellular increase in Trp leads to further degradation by Trp catabolizing enzymes or can be used for protein synthesis. By applying computational modelling of Trp usage in different pathways, we confirmed the upregulation of Trp transportersCitation35, which resulted in enhanced influx of Trp into the cells but also increased efflux of Kyn out of the cells (). However, most strikingly, Trp shortage channeled Trp towards WARS ().
In conclusion, we show here that in tumor cells, Trp depletion mediated by the expression of IDO1 and/or TDO2 upregulates WARS via GCN2-peIF2a-ATF4 signaling, which shifts Trp usage towards protein synthesis. The GCN2-dependent upregulation of WARS and Trp transporters enables cells to adapt to Trp shortage and to make optimal use of Trp once it is replenished. Hence, this study sheds light on an important compensatory mechanism allowing tumor cells to grow despite degrading an essential amino acid.
Methods
Analysis of expression data
For correlation analyses, data was downloaded from the R2:Genomic Analysis and Visualization Platform (http://hgserver1.amc.nl) and Gene Expression Omnibus (GEO). The following datasets were used: “Tumor Glioma Kawaguchi” (GSE43378), “Tumor Breast Chin” (GSE69031)Citation50, “Tumor Colon Sieber-Smith“ (GSE14333 + GSE17538 minus identical samples), “Tumor Lymphoma Hummel”Citation51, “Tumor Ovarian Anglesio”Citation52. Probes considered for analyses were: ATF4: 200779_at, CD2: 205831_at, CD3D: 213539_at, IDO1: 210029_at, IFNG: 210354_at, IRF1: 202531_at, TDO2: 205943_at, WARS: 200629_at. As for WARS2 the same probes were not available for all datasets, 222734_at was employed for “Tumor Ovarian Anglesio”, “Tumor Glioma Kawaguchi” and “Tumor Colon Sieber-Smith”, while 218766_s_at was used for “Tumor Breast Chin” and “Tumor Lymphoma Hummel”.
Cell culture
Human cancer cell lines were obtained from ATCC. MEFs eIF2αSCitation51A/SCitation51A (AA-MEFs) and the corresponding controls, MEFs eIF2αSCitation51/S (SS-MEFs)Citation53 were obtained from the R. Kaufman laboratory. Cells were cultivated in DMEM (Gibco) supplemented with 10% FCS (Gibco), 100 U/ml penicillin and 100 µg/ml streptomycin (Gibco).
For essential amino acid depletion, cells were cultured for 24 h in DMEM without amino acids (Thermo Fisher Scientific) supplemented with all amino acids at the concentrations of regular DMEM but lacking each essential amino acid. Regular DMEM (Gibco) and DMEM without amino acids (Thermo Fisher Scientific) supplemented with all amino acids at the concentrations of regular DMEM were used as controls. L-Arginine, L-Glutamine, L-Histidine, L-Serine, L-Threonine, L-Valine and L-Isoleucine were all from Genaxxon, L-Tryptophan, L-Cysteine, L-Leucine and L-Lysine were all from Sigma-Aldrich, L-Glycine, L-Phenylalanine and L-Tyrosine were from Carl Roth, and L-Methionine was from Usbiologicals. All media were supplemented with 10% dialyzed FCS (Gibco).
Drug and cytokine treatment
Cells were treated with recombinant human IFNγ (#14–8319-80, eBiosciences) at concentrations of 100 and 1000 U/ml for 8 and 24 h. For inhibition of IFNγ signaling an anti IFNγ antibody (#554,698, BD Bioscience) was applied at 5µg/ml.
Preparation of T cell supernatants
Peripheral blood mononuclear cells were prepared from heparinized venous blood of healthy donors by density-gradient centrifugation. T helper (Th) cells were separated using a CD4+ T cell isolation kit II (Miltenyi Biotec GmbH) according to the manufacturer’s instructions (purity ≥97% CD4+ cells). Th cells were cultured in RPMI 1640 medium (Thermo Fisher Scientific) containing 10% FCS in the presence of 5 μg/ml phytohemagglutinin (Sigma-Aldrich) and 20 ng/ml rhIL-2 (Novartis) for 4 days. Activated T cell supernatants were harvested, centrifuged and stored at −80°C.
RNA isolation and quantitative (q)RT-PCR
Total RNA was isolated using the Qiagen RNAeasy Mini Kit (Qiagen) following the manufacturer’s instructions. One microgram RNA was reversed transcribed to cDNA using the High Capacity cDNA reverse transcriptase kit (Applied Biosystems). (q)RT-PCR was carried out in quadruplicates with the SYBR Select Master Mix (Thermo Fisher Scientific) with a StepOnePlus real-time PCR system (Applied Biosystems). GAPDH was used for normalization. qRT-PCR primers were designed using Primer Blast (NCBI) and were separated by at least one intron on the genomic DNA.
Primers sequences:
Human
ATF4 forward : 5’- CCTATAAAGGCTTGCGGCCA -3’
reverse: 5’- CACTGCTGCTGGATTTCGTG -3’
GAPDH forward: 5’-CTCTCTGCTCCTCCTGTTCGAC-3’
reverse: 5’-TGAGCGATGTGGCTCGGCT-3’
GCN2 forward : 5’- CGACTTCAGACCTCCCTTGC -3’
reverse: 5’- GGTATCTTTGCTTTGGCAGGC -3’
IDO1 forward : 5’-GATGTCCGTAAGGTCTTGCC -3’
reverse: 5’-TCCAGTCTCCATCACGAAAT-3’
TDO2 forward: 5’- CAAATCCTCTGGGAGTTGGA - 3’
reverse: 5’- GTCCAAGGCTGTCATCGTCT - 3’
WARS forward: 5’- ATTCTCAAGAGGGTTTCATT - 3’
reverse: 5’- CCAGGTTGTGGAAGACACT - 3’
WARS2 forward: 5’- CTGCACTCAATGCGGAAA - 3’
reverse: 5’- GGATTCCTGTAGGTTGAATG - 3’
Murine
Gapdh forward: 5’- GCCTTCCGTGTTCCTACCC -3’
reverse: 5’- CAGTGGGCCCTCAGATGC -3’
Gcn2 forward: 5’- GCTGCGTTCTTCAGTGAGACAC - 3’
reverse: 5’- GCTTGTTTTGCACCTTGATGAC - 3’
Wars forward: 5’- ACCGGAAGTTATTCCAGCCG - 3’
reverse: 5’- TCACGAGCTCCCCTTGAGTA - 3’
Wars2 forward: 5’- GGCCAATTGCCTGTTTAGCTC - 3’
reverse: 5’- GAATGCACTGACCCTGTTCC - 3’
Protein isolation and western blotting
Cells were lysed in ice-cold RIPA lysis buffer (1% IGEPAL/NP40, 12 mM sodium-deoxycholate, 3.5 mM SDS) supplemented with a protease and phosphatase inhibitor (Roche/Sigma-Aldrich) to extract total protein. Nuclear and cytoplasmic fractions were prepared using the NE-PER Nuclear Cytoplasmic Extraction Reagent kit (Pierce) according to the manufacturer’s instruction. Protein concentrations were determined by Bradford Protein Assay (BioRad) according to the manufacturer’s recommendations. 10 to 20 µg of protein were separated by 10–12% SDS-PAGE. Proteins were transferred onto 0.2 µm nitrocellulose membranes, blocked with 5% BSA for 1 h, and stained with the corresponding primary antibodies overnight. Primary antibodies: rabbit anti-human IDO1 (#AG-25A-0029-C100, Adipogene AG), mouse anti-human GAPDH (#39–8600, Thermo Fisher Scientific), mouse anti-human ß-Actin (#MA5-15,739, Thermo Fisher Scientific), mouse anti-Lamin A/C (#MA3-1000, Thermo Fisher Scientific), rabbit anti-human WARS (#GTX62563, Gene Tex, Inc.), rabbit anti-human WARS (#PA5-29,849, Thermo Fisher Scientific) rabbit anti-human Tubulin (#ab108629, Abcam plc.), goat anti-human ATF4 (#sc7583, Santa Cruz Biotechnology, Inc.), rabbit anti-human GCN2 (#PA5-17523# Pierce Protein Biology), were diluted 1:1000 in blocking solution.
For detection, membranes were stained with HRP-conjugated secondary antibodies (α-rabbit:#GENA9340-1M, GE Healthcare Europe GmbH; α-goat: #SC-2020, Santa Cruz Biotechnology; α-mouse: #GENXA931, GE Healthcare) diluted 1:5000 for 1 h at room temperature (RT). Signals were detected using either Pierce® ECL Western Blotting Substrate or SuperSignal® West Femto Maximum Sensitivity Substrate (both Thermo Scientific). Images were captured on the BioRad ChemiDoc MP system with Image Lab 5.1 software.
ELISA of cell supernatants
WARS protein levels were measured in FCS-free cell supernatants of A172 and LN229 glioblastoma cells cultured in the presence or absence of Trp for 48 h using a commercially available ELISA kit (Elabscience) according to the manufacturer’s protocol.
Generation of TDO2 overexpression cell lines
A TDO2 cDNA clone flanked by Gateway compatible recombination sites was obtained from MyBiosource. The cDNA clone was recombined into the pLX301 vector (Addgene plasmid #25895), using the Gateway® LR Clonase Enzyme mix (Thermo Fisher Scientific) according to the manufacturer’s protocol. The pLX301-TDO2 expression vector or the empty control pLX301 vector was co-transfected into HEK293T cells using lentiviral packaging plasmids. The resulting lentiviral supernatants were used to infect LN229 cells. Cells with stable integration of the expression vectors were selected and maintained in complete DMEM containing 1µg/ml puromycin. The stable overexpression of TDO2 was confirmed by qRT-PCR, while the functional activity of the overexpressed protein was verified by enhanced Kyn and reduced Trp levels in the supernatants of the TDO2 overexpressing cells, as measured by HPLC.
Overexpression of IDO1 in HEK 293 cells
Starting from the pDEST26 vector (Invitrogen, Thermo Fisher Scientific), the 6xHis-tag was removed by site-directed mutagenesis PCR to derive pDEST. Subsequently, a single C-terminal Flag-tag (Flag-C) was introduced into pDEST. The full-length cDNA sequence of IDO1 was cloned into pDEST-Flag-C via Gateway® cloning resulting in pDEST-IDO1-FLAG-C. HEK293 cells were seeded into 6 well plates, cultured for 24 h and transfected with 2 µg of pDEST-IDO1-FLAG-C or empty control vector using FUGENE HD reagent (Roche).
Trp and kyn measurement by high performance liquid chromatography (HPLC)
Trichloroacetic acid was added to cell culture supernatants (162.8 µl, 72% to 1 ml of supernatant) for protein precipitation. Trp and Kyn concentrations were measured on a Dionex Ultimate® 3000 uHPLC (Thermo Fisher Scientific). Chromatographic separation was achieved on a reversed phase Accucore™ aQ column (2.6 µm, Thermo Scientific) with a gradient mobile phase (see Table S1) consisting of 0.1% trifluoroacetic acid (TFA) in water (A) and 0.1% TFA in acetonitrile (B). Trp and Kyn peaks were identified based on comparison to standards, their retention time and UV emission spectra at 280 nm (Trp) and 365 nm (Kyn). Results were analyzed using the Chromeleon™ 7.2 Chromatography Data System (Thermo Scientific).
Modulation of Trp levels
An overview of the modulation of Trp levels is provided in Fig. S3. For Trp starvation experiments, cells were cultured in custom-made medium without Trp (Thermo Fisher Scientific) supplemented with dialyzed FCS (Thermo Fisher Scientific). For the control medium, 78 µM Trp, which represents the Trp concentration present in regular DMEM, was added to the Trp-free medium. For Trp supplementation experiments, additional 78 µM of Trp were added to the control medium on day 3 of cultivation.
Generation of wt and Gcn2 -/- mefs
C57BL/6J wt mice were purchased from Charles River (Wilmington, MA, USA). Gcn2-/- (B6.129S6-Eif2ak4tm1.2Dron/J) mice were obtained from the Jackson Laboratory (Bar Harbor, ME, USA). Following uterus dissection, 14.5 days old embryos were isolated and washed in PBS. The embryos were mechanically minced, and subsequently digested enzymatically using 0.25% Trypsin/EDTA for 5 minutes at 37°C. Tissue suspensions were homogenized by serially passing them through 18G, 23G and 25G needles. Single cells were cultured in complete DMEM until passage 5.
Real-time analysis of cell proliferation
Cell proliferation was monitored in real-time using the xCelligence RTCA system (Acea Bioscience, Inc.). Wt and Gcn2 -/- MEFs were seeded in duplicates at a total of 3.000 cells per chamber. Proliferation was measured at 30 minutes intervals for 4 days as a relative change in electrical impedance. The dimensionless cell index was derived from the relative change in electrical impedance between the cell free medium containing well and the impedance measured at each monitoring time point thereafter. Growth curves are depicted in the RTCA software as changes in the cell index over time. Proliferation rates for each of the treatments were determined by comparison of the slopes of these growth curves using the RTCA software 1.2.
Modeling of Trp metabolism
To calculate flux changes between U87-MG cells under Trp sufficiency or deprivation, we extended the previously publishedCitation33 mathematical model of Trp metabolism to include the amino acid transporter SLC1A5. As kinetic constants for this transporter are not available, we used the constants previously integrated for SLC7A5. Microarray data of U87-MG cultivated in Trp-free or Trp-containing medium for 24 h were integrated into the model using SBMLmod as described previouslyCitation53. For the microarray U87-MG cells were cultivated in Trp-free or Trp-containing medium for 24 h, harvested and RNA was isolated using the RNeasy Mint Kit (Qiagen). The RNA was biotin-labeled and hybridized to an Illumina human whole genome Sentrix HumanRef-8 ExpressionBeadChip (Illumina) following the manufacturer’s protocol. Microarrays were scanned on a beadstation array scanner and the raw data extracted using the beadarray R package from bioconductor.org. Bead outliers were removed if their expression value dropped below a threshold defined by the imaging system background, non-specific binding and cross hybridization signal. Individual bead types were flagged based on bead replicate count. Data were globally normalized using the Bioconductor lumi packageCitation54.
A concentration of 5 µM free Trp corresponding to the medium blood concentration of free Trp was assumed for the calculation of steady state fluxes to resemble physiological conditions.
Statistical analyses
Statistical analyses were performed using GraphPad Prism version 5.00 (GraphPad Software Inc.) or SigmaPlot 13 (Systat Software GmbH). Correlation analyses were based on Spearman’s rank analysis. Two-tailed Student’s t-tests were used for single comparisons. Where applicable, rank sum analysis by Mann-Whitney U and one-way ANOVA were conducted. All data are expressed as mean ± s.e.m. Statistical significance is assumed at P < 0.05 (*P < 0.05, **P < 0.01, ***P <0.001).
Supplemental Material
Download Zip (1.4 MB)Acknowledgments
We thank Alexander Biehler for expert technical assistance. We thank Dr. Martina Ott for providing IDO1-overexpressing HEK cells and Dr. Lars Tykocinski for T cell supernatants. pLX301 was a gift from David Root (Addgene plasmid # 25895). We thank the Microarray Unit of the DKFZ Genomics and Proteomics Core Facility for excellent services.
Supplementary material
Supplemental data for this article can be accessed here.
Disclosure statement
No potential conflict of interest was reported by the authors.
Additional information
Funding
References
- Munn DH, Mellor AL. Indoleamine 2,3 dioxygenase and metabolic control of immune responses. Trends Immunol. 2013;34:137–143. doi: 10.1016/j.it.2012.10.001.
- Opitz CA, Wick W, Steinman L, Platten M. Tryptophan degradation in autoimmune diseases. Cell Mol Life Sci. 2007;64:2542–2563. doi: 10.1007/s00018-007-7140-9.
- Yuasa HJ, Mizuno K, Ball HJ. Low efficiency IDO2 enzymes are conserved in lower vertebrates, whereas higher efficiency IDO1 enzymes are dispensable. FEBS J. 2015;282:2735–2745. doi: 10.1111/febs.2015.282.issue-14.
- Chon SY, Hassanain HH, Gupta SL. Cooperative role of interferon regulatory factor 1 and p91 (STAT1) response elements in interferon-gamma-inducible expression of human indoleamine 2,3-dioxygenase gene. J Biol Chem. 1996;271:17247–17252. doi: 10.1074/jbc.271.29.17247.
- Chen W, Liang X, Peterson AJ, Munn DH, Blazar BR. The indoleamine 2,3-dioxygenase pathway is essential for human plasmacytoid dendritic cell-induced adaptive T regulatory cell generation. J Immunol. 2008;181:5396–5404. doi: 10.4049/jimmunol.181.8.5396.
- Mezrich, J.D., et al. An interaction between kynurenine and the aryl hydrocarbon receptor can generate regulatory T cells. J Immunol. 2010;185:3190–3198. doi: 10.4049/jimmunol.0903670.
- Baban, B., et al. IDO activates regulatory T cells and blocks their conversion into Th17-like T cells. J Immunol. 2009;183:2475–2483. doi: 10.4049/jimmunol.0900986.
- Fallarino, F., et al. T cell apoptosis by tryptophan catabolism. Cell Death Differ. 2002;9:1069–1077. doi: 10.1038/sj.cdd.4401073.
- Munn, D.H., et al. GCN2 kinase in T cells mediates proliferative arrest and anergy induction in response to indoleamine 2,3-dioxygenase. Immunity. 2005;22:633–642. doi: 10.1016/j.immuni.2005.03.013.
- Dong J, Qiu H, Garcia-Barrio M, Anderson J, Hinnebusch AG. Uncharged tRNA activates GCN2 by displacing the protein kinase moiety from a bipartite tRNA-binding domain. Mol Cell. 2000;6:269–279. doi: 10.1016/S1097-2765(00)00028-9.
- Wek SA, Zhu S, Wek RC. The histidyl-tRNA synthetase-related sequence in the eIF-2 alpha protein kinase GCN2 interacts with tRNA and is required for activation in response to starvation for different amino acids. Mol Cell Biol. 1995;15:4497–4506. doi: 10.1128/MCB.15.8.4497.
- Sonner, J.K., et al. The stress kinase GCN2 does not mediate suppression of antitumor T cell responses by tryptophan catabolism in experimental melanomas. Oncoimmunology. 2016;5:e1240858. doi: 10.1080/2162402X.2016.1240858.
- Theate, I., et al. Extensive profiling of the expression of the indoleamine 2,3-dioxygenase 1 protein in normal and tumoral human tissues. Cancer Immunology Research. 2015;3:161–172. doi: 10.1158/2326-6066.CIR-14-0137.
- D’Amato, N.C., et al. A TDO2-AhR signaling axis facilitates anoikis resistance and metastasis in triple-negative breast cancer. Cancer Res. 2015;75:4651–4664. doi: 10.1158/0008-5472.CAN-15-2011.
- Opitz, C.A., et al. An endogenous tumour-promoting ligand of the human aryl hydrocarbon receptor. Nature. 2011;478:197–203. doi: 10.1038/nature10491.
- Pilotte, L., et al. Reversal of tumoral immune resistance by inhibition of tryptophan 2,3-dioxygenase. Proc Natl Acad Sci U S A. 2012;109:2497–2502. doi: 10.1073/pnas.1113873109.
- Uyttenhove, C., et al. Evidence for a tumoral immune resistance mechanism based on tryptophan degradation by indoleamine 2,3-dioxygenase. Nat Med. 2003;9:1269–1274. doi: 10.1038/nm934.
- Andrianifahanana, M., et al. IFN-gamma-induced expression of MUC4 in pancreatic cancer cells is mediated by STAT-1 upregulation: a novel mechanism for IFN-gamma response. Oncogene. 2007;26:7251–7261. doi: 10.1038/sj.onc.1210532.
- Opitz, C.A., et al. The indoleamine-2,3-dioxygenase (IDO) inhibitor 1-methyl-D-tryptophan upregulates IDO1 in human cancer cells. PLoS One. 2011;6:e19823. doi: 10.1371/journal.pone.0019823.
- Ahn, Y.H., et al. Secreted tryptophanyl-tRNA synthetase as a primary defence system against infection. Nat Microbiology. 2016;2:16191. doi: 10.1038/nmicrobiol.2016.191.
- Sajish, M., et al. Trp-tRNA synthetase bridges DNA-PKcs to PARP-1 to link IFN-gamma and p53 signaling. Nat Chem Biol. 2012;8:547–554. doi: 10.1038/nchembio.937.
- Wakasugi, K., et al. A human aminoacyl-tRNA synthetase as a regulator of angiogenesis. Proc Natl Acad Sci U S A. 2002;99:173–177. doi: 10.1073/pnas.012602099.
- Zhou, Q., et al. Orthogonal use of a human tRNA synthetase active site to achieve multifunctionality. Nat Struct Mol Biol. 2010;17:57–61. doi: 10.1038/nsmb.1706.
- Tang, X., et al. Comprehensive profiling of amino acid response uncovers unique methionine-deprived response dependent on intact creatine biosynthesis. PLoS Genet. 2015;11:e1005158. doi: 10.1371/journal.pgen.1005158.
- Zhang, P., et al. The GCN2 eIF2alpha kinase is required for adaptation to amino acid deprivation in mice. Mol Cell Biol. 2002;22:6681–6688. doi: 10.1128/MCB.22.19.6681-6688.2002.
- Dever, T.E., et al. Phosphorylation of initiation factor 2 alpha by protein kinase GCN2 mediates gene-specific translational control of GCN4 in yeast. Cell. 1992;68:585–596. doi: 10.1016/0092-8674(92)90193-G.
- Harding, H.P., et al. Regulated translation initiation controls stress-induced gene expression in mammalian cells. Mol Cell. 2000;6:1099–1108. doi: 10.1016/S1097-2765(00)00108-8.
- Siu F, Bain PJ, LeBlanc-Chaffin R, Chen H, Kilberg MS. ATF4 is a mediator of the nutrient-sensing response pathway that activates the human asparagine synthetase gene. J Biol Chem. 2002;277:24120–24127. doi: 10.1074/jbc.M201959200.
- Han, J., et al. ER-stress-induced transcriptional regulation increases protein synthesis leading to cell death. Nat Cell Biol. 2013;15:481–490. doi: 10.1038/ncb2738.
- Kilberg MS, Balasubramanian M, Fu L, Shan J. The transcription factor network associated with the amino acid response in mammalian cells. Adv Nutrition. 2012;3:295–306. doi: 10.3945/an.112.001891.
- Lee, J.I., et al. HepG2/C3A cells respond to cysteine deprivation by induction of the amino acid deprivation/integrated stress response pathway. Physiol Genomics. 2008;33:218–229. doi: 10.1152/physiolgenomics.00263.2007.
- Stavrum AK, Heiland I, Schuster S, Puntervoll P, Ziegler M. Model of tryptophan metabolism, readily scalable using tissue-specific gene expression data. J Biol Chem. 2013;288:34555–34566. doi: 10.1074/jbc.M113.474908.
- Silk, J.D., et al. IDO induces expression of a novel tryptophan transporter in mouse and human tumor cells. J Immunol. 2011;187:1617–1625. doi: 10.4049/jimmunol.1000815.
- Timosenko, E., et al. Nutritional stress induced by tryptophan-degrading enzymes results in ATF4-dependent reprogramming of the amino acid transporter profile in tumor cells. Cancer Res. 2016;76:6193–6204. doi: 10.1158/0008-5472.CAN-15-3502.
- Speciale C, Hares K, Schwarcz R, Brookes N. High-affinity uptake of L-kynurenine by a Na+-independent transporter of neutral amino acids in astrocytes. J Neurosci. 1989;9:2066–2072. doi: 10.1523/JNEUROSCI.09-06-02066.1989.
- Bange FC, Flohr T, Buwitt U, Bottger EC. An interferon-induced protein with release factor activity is a tryptophanyl-tRNA synthetase. FEBS Lett. 1992;300:162–166. doi: 10.1016/0014-5793(92)80187-L.
- Boasso A, Herbeuval JP, Hardy AW, Winkler C, Shearer GM. Regulation of indoleamine 2,3-dioxygenase and tryptophanyl-tRNA-synthetase by CTLA-4-Fc in human CD4+ T cells. Blood. 2005;105:1574–1581. doi: 10.1182/blood-2004-06-2089.
- Jorgensen R, Sogaard TM, Rossing AB, Martensen PM, Justesen J. Identification and characterization of human mitochondrial tryptophanyl-tRNA synthetase. J Biol Chem. 2000;275:16820–16826. doi: 10.1074/jbc.275.22.16820.
- Barrell BG, Bankier AT, Drouin J. A different genetic code in human mitochondria. Nature. 1979;282:189–194. doi: 10.1038/282189a0.
- Guo M, Schimmel P. Essential nontranslational functions of tRNA synthetases. Nat Chem Biol. 2013;9:145–153. doi: 10.1038/nchembio.1158.
- Guo M, Yang XL, Schimmel P. New functions of aminoacyl-tRNA synthetases beyond translation. Nat Rev Mol Cell Biol. 2010;11:668–674. doi: 10.1038/nrm2956.
- Lo, W.S., et al. Human tRNA synthetase catalytic nulls with diverse functions. Science. 2014;345:328–332. doi: 10.1126/science.1252943.
- Eleftheriadis, T., et al. Indoleamine 2,3-dioxygenase increases p53 levels in alloreactive human T cells, and both indoleamine 2,3-dioxygenase and p53 suppress glucose uptake, glycolysis and proliferation. Int Immunol. 2014;26:673–684. doi: 10.1093/intimm/dxu077.
- Metz, R., et al. IDO inhibits a tryptophan sufficiency signal that stimulates mTOR: A novel IDO effector pathway targeted by D-1-methyl-tryptophan. Oncoimmunology. 2012;1:1460–1468. doi: 10.4161/onci.21716.
- Wang, H., et al. l-Tryptophan activates mammalian target of rapamycin and enhances expression of tight junction proteins in intestinal porcine epithelial cells. J Nutr. 2015;145:1156–1162. doi: 10.3945/jn.114.209817.
- Bhutia YD, Babu E, Ganapathy V. Interferon-gamma induces a tryptophan-selective amino acid transporter in human colonic epithelial cells and mouse dendritic cells. Biochim Biophys Acta. 2015;1848:453–462. doi: 10.1016/j.bbamem.2014.10.021.
- Miyanokoshi M, Yokosawa T, Wakasugi K. Tryptophanyl-tRNA synthetase mediates high-affinity tryptophan uptake into human cells. J Biol Chem. 2018;293:8428–8438. doi: 10.1074/jbc.RA117.001247.
- Seymour RL, Ganapathy V, Mellor AL, Munn DH. A high-affinity, tryptophan-selective amino acid transport system in human macrophages. J Leukoc Biol. 2006;80:1320–1327. doi: 10.1189/jlb.1205727.
- Chin, K., et al. Genomic and transcriptional aberrations linked to breast cancer pathophysiologies. Cancer Cell. 2006;10:529–541. doi: 10.1016/j.ccr.2006.10.009.
- Hummel, M., et al. A biologic definition of burkitt’s lymphoma from transcriptional and genomic profiling. N Engl J Med. 2006;354:2419–2430. doi: 10.1056/NEJMoa055351.
- Anglesio, M.S., et al. Mutation of ERBB2 provides a novel alternative mechanism for the ubiquitous activation of RAS-MAPK in ovarian serous low malignant potential tumors. Molecular Cancer Research: MCR. 2008;6:1678–1690. doi: 10.1158/1541-7786.MCR-08-0193.
- Scheuner, D., et al. Translational control is required for the unfolded protein response and in vivo glucose homeostasis. Mol Cell. 2001;7:1165–1176. doi: 10.1016/S1097-2765(01)00265-9.
- Schauble S, Stavrum AK, Bockwoldt M, Puntervoll P, Heiland I. SBMLmod: a python-based web application and web service for efficient data integration and model simulation. BMC Bioinformatics. 2017;18:314. doi: 10.1186/s12859-017-1722-9.
- Du P, Kibbe WA, Lin SM. lumi: a pipeline for processing Illumina microarray. Bioinformatics. 2008;24:1547–1548. doi: 10.1093/bioinformatics/btn224.