
ABSTRACT
Despite recent therapeutic progress, plasmablastic lymphoma (PBL), a distinct entity of high grade B cell lymphoma, is still an aggressive lymphoma with adverse prognosis. PBL commonly occurs in patients with HIV infection and PBL cells frequently express Epstein Barr virus (EBV) genome with type I latency. Occasionally however, PBL may develop in patients with an immunodepressed status without EBV and HIV infection. The aim of this study was to determine which PBL patients may benefit from the emerging strategies of immune checkpoint blockade. Here, we produced and analyzed the transcriptomic profiles of such tumors to address this question. Unsupervised hierarchical clustering analysis of PBL samples revealed they segregate according to their tumor EBV-status. Moreover, EBV+ PBL displays abundant leucocyte infiltrates and T-cell activation signatures, together with high expression levels of mRNA and protein markers of immune escape. This suggests that EBV infection induce an anti-viral cytotoxic immunity which progressively exhausts T lymphocytes and promotes the tolerogenic microenvironment of PBL. Hence, most EBV+ PBL patients presenting an early stage of cancer immune-editing process appear as the most eligible patients for immune checkpoint blockade therapies.
Introduction
First described in 1997,Citation1 plasmablastic lymphoma (PBL) is an aggressive variant of large B cell lymphomaCitation2 that commonly occurs in HIV-positive individuals or in association with other contexts of immunodeficiency.Citation3–Citation6 PBL tumor cells frequently express Epstein Barr virus (EBV) genome with type I latency, especially in HIV patients, but EBV-negative (EBV−) PBL have also been reported.Citation7–Citation9 Despite recent advances in lymphoma therapeutic strategies, EBV+ PBL and EBV− PBL still represent aggressive lymphomas with adverse prognosis.Citation8,Citation9
We recently reported that PBL evolves several patterns of immune escape involving the expression of immune checkpoints (ICP) such as the programmed cell death protein-1 (PD-1) and its PD-L1 ligand expressed on tumor cells or in their microenvironment (ME).Citation10–Citation13 More specifically, we observed that the PD-1/PD-L1 axis is more overexpressed in tumor and microenvironment cells of EBV+ PBL than of EBV− PBL, suggesting that EBV infection impacts the viral response signature of PBL.Citation10–Citation13
Besides the PD-1/PD-L1 axis however, different mechanisms leading to immune evasion have been identified. These encompass impairment of cytotoxic function of immune cell effectors, blockade of immune activation by metabolic depletion or secretion of suppressive mediators (indole-amine dioxygenaseCitation14–Citation16 or arginaseCitation17), TGFβ, IL10Citation18–Citation20 and finally the local recruitment of immunosuppressive cells such as Tregs, tumor-associated macrophages (TAMs) and myeloid-derived suppressor cells (MDSC),Citation17,Citation21–Citation25 to quote a few. In non-Hodgkin B cell lymphoma (B-NHL), we recently showed that DLBCL and FL tumors share the overexpression of 33 genes involved in tumor immune-escape mechanisms (called ‘Immune Escape Gene Set, IEGS33). This IEGS33 gene set includes genes encoding for CTLA4, PDCD1, LAG3, HAVCR2, CD274, PDCD1LG2 and LGALS9. Genes encoding for enzymes producing immunosuppressive metabolites (IDO1, ARG1, ENTPD1,…) and for immunosuppressive cytokines and chemokines (IL10, HGF, GDF15,…) are also included.Citation13 Recently, we were able to identify four stages of NHL immune-escape processes from 1446 transcriptomes of B-NHL, allowing for a classification according to their immunogenicity and their composition in terms of immune cell subtypes (Supplementary Figure 1). This finding suggested that patients most relevant for immune checkpoint blockade (ICB) therapies are those with an immunogenic tumor and with an immune escape signature defined by a high score of immune-escape gene set (IEGS33) and myeloid cell infiltrate genes (cancer immune-evasion stage 3 patients); and those with a fully immune-edited tumor defined by a high score of myeloid infiltrate genes with high level of proliferation and mutations (cancer immune-evasion stage 4 patients).Citation26
Hence altogether, the frequent association with oncogenic viruses and the high expression of several immune escape markers suggested that PBL patients and particularly those with EBV+ PBL tumor cells are relevant for immune checkpoint blockade-based therapy. We therefore investigated the immune cell cartography and immunogenicity by gene expression profiling to identify the immune status profile in EBV+ and EBV− PBL samples. We found that cancer immune-evasion stage 3 is the common hallmark of EBV+ PBL, rendering these patients eligible to immune checkpoint blockade therapy.
Results
Presence of EBV determines a distinct gene expression profile of PBL
To assess the impact of EBV status in tumor cells on the biology of PBL, we first compared the gene expression profile of EBV+ PBL and EBV− PBL. RNA extracted from PBL patients’ frozen tissues sections was converted into labeled cRNA and hybridized to Affymetrix Human Gene ST 2.0 gene Chips containing 53 618 probe sets. To determine the genes with significant differential expression between EBV+ PBL and EBV− PBL, Wilcoxon test with p value (<0.01) was used. This analysis unveiled that 1213 genes were significantly differentially expressed between these two groups (Supplementary Table 2). Of these 1213 genes, 555 were upregulated in EBV+ PBL as compared to EBV− PBL samples (Supplementary Table 2). The unsupervised hierarchical clustering of these 1213 differentially expressed genes is represented on the heatmap shown in .
Figure 1. Molecular profiling and pathways analysis in EBV+ and EBV− plasmablastic lymphomas.
Unsupervised hierarchical clustering of 1213 genes detected as differentially expressed in EBV− (n = 3, grey bar) and EBV+ (n = 6, blue bar) PBL. The color bar denotes z-score adjusted expression values, cyan used for lower expression and red for higher expression levels. Data are represented in a grid format in which each column represents a single patient, and each row a single gene. The dendrogram shows the degree to which the expression pattern of each gene is correlated with that of the other genes (A). Functional network of the differentially expressed genes between EBV− and EBV+ PBL, using the GO ‘Biological Process’ terms. The node circle size represents the number of genes in the pathway and the node circle colors (pink and purple) correspond to the genes clustering (genes up-regulated in EBV− or EBV+ PBL respectively) (B).
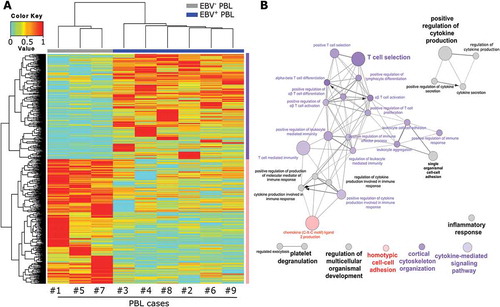
The functional significance of this gene expression profile was assessed by gene set enrichment analysis, using the Gene Ontology’s (GO) “Biological Process” (BP) compendium. We found that genes associated with T lymphocyte biology, listed in the GO biological process compendium, were enriched in EBV+ PBL as compared to EBV− PBL (). By focusing on the GO “Immune system Process” subclass genes (Supplementary Figure 2), most of the up-regulated genes were involved in T-cell activation and differentiation in EBV+ PBL as compared to EBV− PBL. For example, genes coding for CD74, FAS, IL15 and ZAP70, which are directly or indirectly involved in ‘T cell selection’, were all found upregulated in EBV+ PBL (p = 3.6.10–5). The GO immune system process ‘T cell mediated immunity’ function was also significantly enriched in EBV+ PBL (p = 6.0.10–5), as confirmed by upregulation of B2M encoding for β-2-microglobulin and of HLA-A and HLA-DR genes (Fold change 1.13, p = 0.047) being both important for the tumor cell antigen presentation and cytolytic elimination. However, when compared to reactive lymph node, HLA-DR gene (but not HLA-A) remains downregulated in all PBL cases (HLA-DR Fold change 0.71, p < 0.0001). Moreover, at a lower extent, EBV+ PBL displayed an enrichment of genes involved in ‘positive regulation of cytokine production’ (p = 3.4.10–5), together with genes related to the activation of NF-kB signaling pathway, notably illustrated by upregulation of the TANK and NLRP2 genes. Several transcriptional regulators such as SLAMF6 and EOMES involved in effector cells differentiation and lytic function and belonging to the ‘αβ T cell activation’ GO immune system process term were also upregulated in EBV+ PBL (p = 9.0.10–4). Finally, the gene set encoding for ‘positive regulation of T cell proliferation’ pathway was enriched in EBV+ PBL samples, as illustrated by the upregulated immune checkpoints genes encoding CD274 and PDCD1LG2 (p = 8.0.10–4). In contrast, genes down-regulated in EBV+ PBL were mainly implicated in the regulation of inflammatory processes through neutrophils and macrophages. These genes encompassed F2RL1, S100A8 and S100A9 genes, which are related to ‘chemokine ligand 2 production’ GO biological process term, implicated in the migration and infiltration of monocytes/macrophages and in Th-to-Th2 polarization Citation27 (p = 4.3.10–5) (). Comparison of gene expression levels for genes involved in other biological processes such as cell cycle, signal transduction and apoptosis did not show any significant difference between the EBV+ and EBV− PBL groups.
Altogether, these results demonstrate that expression of 1213 genes distinguishes EBV+ and EBV– PBL, and that chronic EBV infection contributes to the pathogenesis of PBL disease.
Distinct immune escape gene signatures are identified between EBV+ PBL and EBV− PBL
When compared to EBV− PBL, EBV+ PBL shows higher expression of PD-1 and PD-L1 proteins by both malignant and microenvironment cells.Citation9 Therefore, we questioned whether EBV+ PBL might evolve a more potent immune escape compared to EBV− PBL. To address this point at the molecular level, the enrichment of the IEGS33 gene set in gene expression microarrays was measured for EBV+ or EBV− PBL and for reactive lymph nodes, and compared as previously described.Citation26 The immune escape gene set (33 genes; IEGS33) was significantly up-regulated in all PBL samples regardless of EBV tumor status, as compared to control tissues. This was illustrated by the overexpression of VEGFA, LAG3, PDCD1, LGALS3, GDF15, MCL1, CD163 and FOXP3 genes, which encode for factors promoting a tolerogenic microenvironment or T cell exhaustion. By contrast, other IEGS33 genes such as TIGIT, IDO1, IDO2, ICOS and CTLA4 were less expressed by the malignant samples than by the reactive tissue controls. These differential gene expression patterns led to a clear-cut clustering between PBL samples and reactive lymph node samples based on IEGS33 gene set expression levels ().
Figure 2. Distinct immune escape gene signatures in reactive lymphoid tissues and in EBV− and EBV+ plasmablastic lymphomas.
Unsupervised hierarchical clustering of the IEGS33 genes rank-ordered by increasing expression level along the [0–1] segment (highest expression level = 1: red, lowest expression level = 0: cyan). The clustering was performed according to IEGS33’ genes expression in reactive lymph nodes, EBV+ and EBV− PBL. Genes in blue were significantly different between EBV− and EBV+ PBL (p < 0.05, unpaired Wilcoxon test) (A). Sample Enrichment Score (SES) of IEGS33 genes set (B) and EBV-IEGS5 genes set (C) in control, EBV− and EBV+ PBL. Each sample is shown by a dot, blue bars are the means of the specified group, red bars are the medians of the specified group. P-value from unpaired Wilcoxon test between EBV− and EBV+ PBL samples are indicated.
![Figure 2. Distinct immune escape gene signatures in reactive lymphoid tissues and in EBV− and EBV+ plasmablastic lymphomas.Unsupervised hierarchical clustering of the IEGS33 genes rank-ordered by increasing expression level along the [0–1] segment (highest expression level = 1: red, lowest expression level = 0: cyan). The clustering was performed according to IEGS33’ genes expression in reactive lymph nodes, EBV+ and EBV− PBL. Genes in blue were significantly different between EBV− and EBV+ PBL (p < 0.05, unpaired Wilcoxon test) (A). Sample Enrichment Score (SES) of IEGS33 genes set (B) and EBV-IEGS5 genes set (C) in control, EBV− and EBV+ PBL. Each sample is shown by a dot, blue bars are the means of the specified group, red bars are the medians of the specified group. P-value from unpaired Wilcoxon test between EBV− and EBV+ PBL samples are indicated.](/cms/asset/c905153b-7638-422d-96ba-f6aafd12997c/koni_a_1486950_f0002_oc.jpg)
PBL samples were then split into two groups based on EBV status in tumor cells, and compared for gene expression levels. This unveiled a significantly stronger expression level of PD-L1 (p = 0.04), PD-L2 (p = 0.02), and CD163 (p = 0.02) genes in EBV+ PBL samples ().
As shown in , the IEGS33 gene set was significantly enriched in EBV+ PBL, indicating the collective up-regulation of these 33 genes in EBV+ PBL as compared to EBV− PBL.
We then focused on a subset of 5 genes included in IEGS33, called EBV-IEGS5, coding for PD-1, TIM-3, PD-L1, PD-L2, and CD163, which mediate prominent immune escape mechanisms in lymphoma.Citation28–Citation32 The sample enrichment score (SES) for EBV-IEGS5 was significantly higher in EBV+ than EBV− PBL samples (p = 0.00019), meaning that these EBV+ samples significantly overexpress all 5 genes and therefore undergo immune escape ().
Since EBV+ PBL occurs most commonly in HIV infected patients, we wondered whether this immune escape signature could also reflect HIV infection. To address this question, the above immune escape SES (EBV-IEGS5 or IEGS33) were computed in PBL samples with and without HIV infection and compared between HIV+ and HIV – groups, regardless of the EBV tumor cell status. This did not reveal any significant difference between HIV+ PBL and HIV− PBL samples (Supplementary Figure 3), suggesting that beyond EBV expression in tumor cells, HIV status did not impact the immune escape hallmark that we observed in PBL samples.
A parallel meta–analysis of other EBV-related cancers was performed across 300 transcriptomes from nasopharynx carcinoma and gastric carcinoma.Citation33,Citation34 The analysis evidenced and confirmed higher immune escape scores of IEGS33 (p = 9.623.10–6) and EBV-IEGS5 (p = 2.36.10–3) in EBV+ undifferentiated nasopharynx carcinoma and EBV+ gastric adenocarcinoma compared to EBV− tumor biopsies (Supplementary Figure 4).
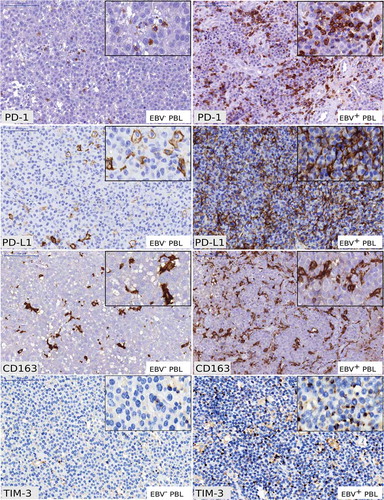
We aimed at validating the EBV-IEGS5 enrichment score observed in EBV+ PBL by immunohistochemistry (IHC). IHC analysis of expression of PD-1, PD-L1, TIM-3 and CD163 markers in PBL biopsies confirmed that these immune checkpoint proteins were effectively co-expressed in EBV+ and EBV− PBL tumors. However, PD-1/PD-L1 axis, TIM-3 and CD163 proteins were more abundantly present in EBV+ PBL than in EBV− PBL tumors () and showed a higher immune checkpoint score, as we previously described.Citation9
Figure 3. Immunohistochemical analysis of PD-1, PD-L1, CD163 and TIM-3 in EBV− and EBV+ plasmablastic lymphomas.
Examples of PD-1 staining in EBV− and EBV+ PBL showing scattered intra-tumoral lymphocytes PD-1+ (x200). Examples of PD-L1 staining showing distinct membranous staining in intra-tumoral macrophages PD-L1+ in EBV− PBL (x200) and tumor cells PD-L1+ in EBV+ PBL (x200). Examples of CD163 staining in EBV− and EBV+ PBL showing distinct membranous staining in intra-tumoral macrophages (x200). Examples of TIM-3 staining in EBV− and EBV+ PBL showing distinct membranous staining in intra-tumoral macrophages and intra-tumoral lymphocytes (x200). (Scale bars = 100µm for each panel) Typical IHC stainings of PBL cases #9 (EBV+ PBL) and PBL case #5 (EBV− PBL) are shown.
Altogether, these results highlight a molecular signature of immune escape in PBL, and suggest deeper immune cell exhaustion among EBV+ PBL than EBV− samples, independently of their HIV status.
EBV+ PBL exhibit higher immune cell infiltration than EBV− PBL
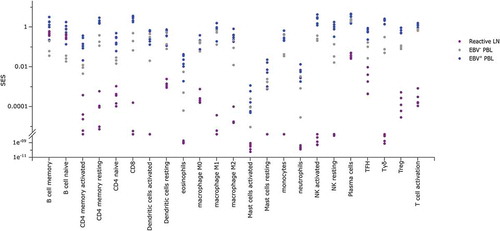
Since immune cell exhaustion characterizes EBV+ PBL samples, we wondered whether all PBL samples had similar patterns of leukocyte infiltrates. To address this question, we first used gene sets defining each of the 22 leucocyte subsets quantified by the CIBERSORT algorithm.Citation35 To assess the respective content in leukocytes for EBV+ and EBV− PBL and for reactive lymph nodes, the SES of these gene sets were then computed for these samples. All leucocyte cell types except B cells were more abundant in PBL samples than in reactive lymph nodes (). Furthermore, although EBV+ and EBV− PBL samples revealed a similar abundance of monocytes and M1 macrophages, EBV+ PBL displayed significantly more T cell (encompassing CD4, CD8 and γδ T cells), NK cell and M2 macrophage infiltrations than the EBV−PBL ( & Supplementary Table 3). These results showed that EBV+ PBL exhibits more abundant cytotoxic lymphocyte infiltrates than EBV− PBL, most probably reflecting responses to viral infection.
Figure 4. SES of immune populations gene sets in EBV− and EBV+ plasmablastic lymphomas.
Sample Enrichment Scores (SES) of immune populations gene sets (defined inCitation35,Citation49) in reactive lymph nodes (purple), EBV− PBL (grey) and EBV+ PBL (blue). Each sample is shown by a dot.
EBV+ PBL infiltrating leucocytes are characterized by multiple immune escape pathways
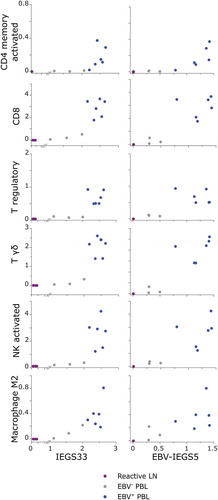
These findings raised the question whether the immune infiltrate of PBL samples was showing an immune activation status, or rather T cell exhaustion and immune escape. Therefore, we investigated the correlation between the immune profile and ‘IEGS33’ or ‘EBV-IEGS5’ scores across all PBL samples. Results showed that relatively to EBV− PBL, the EBV+ PBL with the highest immune cell infiltrates (mostly composed of T, NK and M2 cells), had also the highest scores for immune escape (independent on the assessment by IEGS33 or by EBV-IEGS5) (, Supplementary Table 4).
Figure 5. SES of immune populations versus immune escape gene sets in EBV− and EBV+ plasmablastic lymphomas.
Sample Enrichment Scores (SES) for IEGS33 (left panel) and EBV-IEGS5 (right panel) gene sets expressed by CD4+ memory activated T cells, CD8+ T cells, regulatory T cells, γδ-T cells, NK activated cells, and M2 Macrophages from reactive lymph nodes (purple), EBV− PBL (grey) and EBV+ PBL (blue). Each sample is shown by a dot.
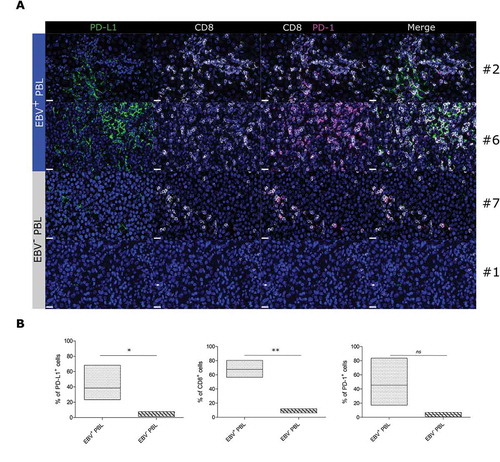
To confirm these findings at the protein level, we then performed multiplexed immunofluorescence analyses () and showed that CD8+ T cells were more abundant in EBV+ PBL than in EBV− PBL (p = 0.0039). Furthermore PD-1/PD-L1 axis was more over expressed in the microenvironment of EBV+ than of EBV− samples with significantly higher expression of PD-L1 (p = 0.0039) and a slightly increased of PD-1 expression (45,3% mean vs 4%, p = 0.05) (). Hence, PBL samples with most abundant immune infiltration also displayed the deepest immune escape that reflects a typical feature of EBV infection as confirmed in EBV+ PBL samples using multiplex IF staining.
Figure 6. Multiplex immunofluorescence of CD8+ lymphoid infiltrates and PD-1/PD-L1 proteins in EBV+ and EBV− plasmablastic lymphomas.
FFPE tissue sections of representative cases of EBV+ and EBV− PBL stained for PD-L1 (green), CD8 (white) and PD-1 (magenta). Figures represent 600x images of single PD-L1, single CD8, CD8/PD-1, and PD-1/PD-L1/CD8 staining. A typical image of PBL cases #2, #6 (EBV+ PBL) and PBL cases #7 and #1 (EBV− PBL) are shown. Hoechst nuclear counterstain (blue) (scale bar = 20 µm for all panels) (A). Floating bar graphs showing the quantification (%) of PD-L1, CD8 and PD-1 stainings in multiplex immunofluorescence. Unpaired Student’s t-test using the GraphPad Prism software (version 6; GraphPad) was used to determine the statistical significance of differences between the groups (p = 0.0466, p = 0.0039 and p = 0.05, respectively) (B).
Discussion
In this work, we characterized for the first time the immune escape and leucocyte infiltrate signatures of PBL. We previously demonstrated that DLBCL NOS evolve various immune evasion strategies.Citation13 Here, the enrichment of multiple immune escape genes, collectively analyzed as IEGS33 and EBV-IEGS5, unveils that PBL shares several immune escape mechanisms with DLBCL NOS, independently of their somatic mutations. Indeed, genetic and environmental factors such as viruses, drive tumor-associated cytolytic activity and select mutations allowing tumor immune-resistance.Citation36 In parallel, EBV is known to influence the transcriptional landscape of different EBV-associated lymphoma subtypes regardless to the expression of viral latent proteins program.Citation5,Citation37–Citation40 Our study shows that relative to control tissues, both EBV+ and EBV− PBL share and overexpress 15 immune escape genes. However in agreement with Rooney et al,Citation36 EBV+ PBL samples upregulate even further these immune escape genes than EBV− PBL tumors. Since EBER staining was exclusively seen in tumor cells, these results suggest that EBV status in tumor cells induces a microenvironment specific molecular signature of immune escape in both PBL and solid tumors such as nasopharynx and gastric carcinoma.
In addition, PBL tumor displayed a higher infiltration by immune cells including lymphoid (T and NK cells) and myeloid cells (dendritic cells, monocytes and M0/M1 or M2 macrophages) than control reactive tissue. However, EBV+ and EBV− PBL were segregated according to an anti-viral immune signature encompassing innate and tolerogenic immunity genes. Indeed, the highest immune infiltration observed in most EBV+ PBL strongly suggests that EBV confers immune surveillance and induces extensive leucocyte recruitment. Moreover, these immune infiltrates display molecular signatures of both T cell activation and immune escape as previously described in PBL and DLBCL.Citation9 Hence, EBV infection most probably induces an antiviral cytotoxic immunity that progressively becomes exhausted, thus favoring a tolerogenic microenvironment for tumor cells.
Accordingly, the transcriptomes of EBV+ PBL combining a high level of leucocyte infiltration and a high immune escape score correspond to the late equilibrium-early escape stage of cancer immune-editing process, as described before.Citation26,Citation36
Further biological studies based on larger cohorts of EBV+ PBL patients are needed to confirm our results. The enrichment of IEGS33 gene set was thus compared between microarrays of EBV+ (n = 8) or EBV− (n = 9) post-transplant lymphoproliferative disorders (PTLD) including both DLBCL and PBL, previously published by Morscio et al. (GSE38885) Citation5,Citation41,Citation42 (Supplementary Figure 5A & B). This analysis showed two main clusters containing EBV+ PTLD (light blue and dark blue) and EBV− PTLD (grey) based on IEGS33 gene set expression levels, excepted for one case of EBV− PTLD (GSM951420). Interestingly, among EBV+ PTLDs, 5 were actually EBV+ PBL subtype which clustered together.Citation5 Thus, our results extend those obtained by Morscio et al. by showing that a specific immune escape signature is found enriched in EBV+ PBL and EBV+ PT-DLBCL compared to EBV− ones. At protein levels, EBV+ PBL tumors also harbored higher expression of PD-1/PD-L1 and are mostly associated with higher CD8+ T cell infiltration suggesting that one of the PBL immune escape strategies may involve T cell dysfunction and exhaustion. By reinvigorating anti-tumor immune responses, immune-based therapy should provide clinical benefit for PBL patients. Indeed, blockade of immune checkpoint molecules such as PD-1 or PD-L1 has demonstrated clinical benefit in several solid cancer types, but also in some hematological malignancies (for review, see Citation43), especially in Hodgkin lymphoma with high PD-L1 score, according to Roemer & al. study.Citation44 Thus, the potential predictive value of PD-L1 expression on tumor cells should be evaluated in PBL patients enrolled in clinical trials using PD-1/PD-L1 inhibitors.
To conclude, our findings suggest that EBV+ PBL evolve immune-escape strategies, given that their tumor comprises antiviral and cytotoxic immune infiltrates expressing immune checkpoint inhibitors. In such patients, EBV-induced immune exhaustion could still be targeted by immune checkpoint blockade drugs.
Patients and methods
Patients
For gene expression analysis, 9 frozen PBL samples were collected from 42145 lymphoma samples registered by the Lymphopath network, a systematic expert review of all suspected lymphomas in France.Citation9,Citation45 All EBV+ PBL tumor cells (n = 6) were type I latency EBV (EBV encoded RNA EBER+, EBNA2−, LMP1−). PBL diagnosis was based on histological criteria described in the WHO classificationCitation6,Citation46 and on clinical parameters. Patients with a prior diagnosis of plasma cell myeloma or with multiple bone lesions or other laboratory criteria supporting the diagnosis of myeloma were excluded from the study. All patient clinical data (age, sex, biopsy site, LDH, HIV status and EBV DNA loads measured by quantitative polymerase chain reaction) are provided cases-wise in Supplementary Table 1. Tissue samples were collected and processed following standard ethical procedures (Helsinki Declaration of 1975), after obtaining written informed consent from each donor and approval for this study by the local ethical committee (Comité de Protection des Personnes Sud-Ouest et Outremer II).
Histology, immunohistochemistry and multiplexed immunofluorescence
Samples were fixed in 10% buffered formalin, embedded in paraffin and processed for routine histopathological examination. For IHC examination, 3 µm-thick sections were tested using Ventana Benchmark XT autostainer (Ventana, Tucson, AZ). After dewax and pretreatment, samples were incubated with PD-1 (clone NAT-105; Abcam), TIM-3 (goat polyclonal; R&D), PD-L1 (Clone E1L3N, Cell Signaling Technologies), CD8 (clone SP57, Ventana Medical Systems), CD3 (clone 2GV6, Ventana Medical Systems), LMP1 (clone CS.1–4, DAKO, Agilent) and CD163 (10D6; Novocastra) antibodies. Whole slides of PBL lymph nodes were scanned using Pannoramic digital slide scanners (3DHISTECH) as previously described.Citation47 For triple immunofluorescence (IF) staining, 4 µm-thick sections were loaded on the Ventana Discovery ULTRA (Ventana, Tucson, US). After dewax and pretreatment, slides were incubated with primary antibodies CD8 (Clone C8/144B, DAKO, Agilent), PD1 (Clone SP269, Spring Bioscience, Roche) and PD-L1. Primary antibodies were visualized using the OmniMap-HRP (Horse radish peroxidase conjugated anti-rabbit, anti-mouse) secondary system and tyramide-conjugated fluorophore kits FAM, Rhodamin6G and Cy5 (Ventana, Tucson, US). Counterstain was performed using Hoechst 33342 (Invitrogen Molecular Probes, US). Whole slides of multiplex IF stained PBL were scanned using Pannoramic digital slide scanner (3D HISTECH) equipped with appropriate filters sets.
PD-1 and PD-L1 IHC staining were quantified according to their immune checkpoint score as previously described.Citation9 Immunofluorescence image quantifications were performed using HALO Imaging Analysis software (PerkinElmer).
Datasets
RNA was extracted from PBL frozen tissue biopsies. cDNA was prepared from minimum 500 pg RNA per sample, and hybridized on GeneChip Human Gene ST 2.0 Affymetrix microarrays (Affymetrix UK Ltd.), by the Lyon University genomic facility ProfileXpert-LCMT (Lyon, France) according to the manufacturer’s protocol. Data are available on NCBI Gene Expression Omnibus website (http://www.ncbi.nlm.nih.gov/geo/): GEO dataset GSE102203.
Additional raw data files from micro-dissected reactive lymph nodes (n = 5, GSE25990)Citation48, nasopharyngeal carcinoma (n = 41, GSE12452)Citation33, gastric cancer (n = 300, GSE62254)Citation34, post-transplanted EBV+ and EBV− DLBCL (n = 12, GSE38885)Citation42, and post transplanted EBV+ PBL (n = 5, GSE38885)Citation5,Citation42 were downloaded from Gene Expression Omnibus (GEO) datasets.
Sample enrichment scores (SES)
The RMA (robust multi-array average)-normalized expression data were scored using the Autocompare_SES software (available at https://sites.google.com/site/fredsoftwares/products/autocompare_ses) using the “greater” (indicating an enriched gene set) Wilcoxon tests with frequency-corrected null hypotheses Citation26 (Supplementary methods). Gene Sets used were the IEGS33 Citation26 and LM22.Citation35,Citation49
R sessioninfo
R version 3.3.2 (2016–10-31)
Platform : x86 64-pc-linux-gnu (64-bit)
Running under : Ubuntu 16.04.4 LTS
Pathways enrichment analysis
Genes up- and down-regulated in EBV− versus EBV+ PBL were analyzed for functional enrichment using the Cytoscape (version 3.4.0) plugin ClueGO (version 2.2.5) Citation50 compared to the GO ‘biological process’ and ‘immune system process’ terms.
Statistical analysis
Differences between EBV+ and EBV− subgroups were analyzed using an unpaired two-tailed Wilcoxon signed rank test versus the specified controls. Unsupervised hierarchical clustering and heat-maps were realized using R software with expression data normalized between 0 and 1.
Authorship contributions
PG, SP, MT, NVA collected and analyzed data; PG, SP, NVA and CL performed experiments; BF, PC, ATG, PB and CL provided patients’ FFPE samples; NA provided clinical informations; PG, CL and JJF designed the research; PG, SP, CL and JJF wrote the paper.
Conflict-of-interest disclosure
The authors declare no conflict of interest.
Supplemental Material
Download MS Word (3.2 MB)Acknowledgments
We thank Laurence Jalabert, Audray Benest, Charley Lagarde, and Julien Granel for immunohistochemistry and François-Xavier Frenois for whole slide imaging (IUCT Toulouse, France). We thank Nathalie Van Acker for multiplex immunofluorescence staining and for proofreading the manuscript. We thank Lyon University genomic facility ProfileXpert-LCMT’ members for their contribution to this work.
Supplemental material
Supplemental data for this article can be accessed here.
Additional information
Funding
References
- Delecluse HJ, Anagnostopoulos I, Dallenbach F, Hummel M, Marafioti T, Schneider U, Huhn D, Schmidt-Westhausen A, Reichart PA, Gross U, et al. Plasmablastic lymphomas of the oral cavity: a new entity associated with the human immunodeficiency virus infection. Blood. 1997;89:1413–1420.
- Castillo JJ, Reagan JL. Plasmablastic lymphoma: a systematic review. ScientificWorldJournal. 2011;11:687–696. doi:10.1100/tsw.2011.59.
- Rafaniello Raviele P, Pruneri G, Maiorano E. Plasmablastic lymphoma: a review. Oral Dis. 2009;15:38–45. doi:10.1111/j.1601-0825.2008.01493.x.
- Colomo L, Loong F, Rives S, Pittaluga S, Martinez A, Lopez-Guillermo A, Ojanguren J, Romagosa V, Jaffe ES, Campo E. Diffuse large B-cell lymphomas with plasmablastic differentiation represent a heterogeneous group of disease entities. Am J Surg Pathol. 2004;28:736–747. doi:10.1097/01.pas.0000126781.87158.e3.
- Morscio J, Dierickx D, Nijs J, Verhoef G, Bittoun E, Vanoeteren X, Wlodarska I, Sagaert X, Tousseyn T. Clinicopathologic comparison of plasmablastic lymphoma in HIV-positive, immunocompetent, and posttransplant patients: single-center series of 25 cases and meta-analysis of 277 reported cases. Am J Surg Pathol. 2014;38:875–886. doi:10.1097/PAS.0000000000000234.
- Swerdlow SH, Campo E, Harris NL, Jaffe ES, Pileri SA, Stein H, Thiele J, Vardiman JW. WHO classification of tumours of haematopoietic and lymphoid tissues, 4th Edition. In: IARC Presse L, Lyon. 2008. p. 439.
- Lee OJ, Kim KW, Lee GK. Epstein-Barr virus and human immunodeficiency virus-negative oral plasmablastic lymphoma. J Oral Pathol Med. 2006;35:382–384. doi:10.1111/j.1600-0714.2006.00422.x.
- Loghavi S, Alayed K, Aladily TN, Zuo Z, Ng SB, Tang G, Hu S, Yin CC, Miranda RN, Medeiros LJ, et al. Stage, age, and EBV status impact outcomes of plasmablastic lymphoma patients: a clinicopathologic analysis of 61 patients. J Hematol Oncol. 2015;8:65. doi:10.1186/s13045-015-0163-z.
- Laurent C, Fabiani B, Do C, Tchernonog E, Cartron G, Gravelle P, Amara N, Malot S, Palisoc MM, Copie-Bergman C, et al. Immune-checkpoint expression in Epstein-Barr virus positive and negative plasmablastic lymphoma: a clinical and pathological study in 82 patients. Haematologica. 2016;101:976–984. doi:10.3324/haematol.2016.141978.
- Pardoll DM. The blockade of immune checkpoints in cancer immunotherapy. Nat Rev Cancer. 2012;12:252–264. doi:10.1038/nrc3239.
- Andorsky DJ, Yamada RE, Said J, Pinkus GS, Betting DJ, Timmerman JM. Programmed death ligand 1 is expressed by non-hodgkin lymphomas and inhibits the activity of tumor-associated T cells. Clin Cancer Res. 2011;17:4232–4244. doi:10.1158/1078-0432.CCR-10-2660.
- Armand P. Checkpoint blockade in lymphoma. Hematology/The Educ Program Am Soc Hematol Am Soc Hematol Educ Program. 2015;2015:69–73.
- Laurent C, Charmpi K, Gravelle P, Tosolini M, Franchet C, Ysebaert L, Brousset P, Bidaut A, Ycart B, Fournié JJ. Several immune escape patterns in non-Hodgkin’s lymphomas. Oncoimmunology. 2015;4:e1026530. doi:10.1080/2162402X.2015.1026530.
- Ninomiya S, Hara T, Tsurumi H, Hoshi M, Kanemura N, Goto N, Kasahara S, Shimizu M, Ito H, Saito K, et al. Indoleamine 2,3-dioxygenase in tumor tissue indicates prognosis in patients with diffuse large B-cell lymphoma treated with R-CHOP. Ann Hematol. 2011;90:409–416. doi:10.1007/s00277-010-1093-z.
- Löb S, Königsrainer A, Rammensee HG, Opelz G, Terness P. Inhibitors of indoleamine-2,3-dioxygenase for cancer therapy: can we see the wood for the trees? Nat Rev Cancer. 2009;9:445–452. doi:10.1038/nrc2639.
- Munn DH, Mellor AL. Indoleamine 2,3-dioxygenase and tumor-induced tolerance. J Clin Invest. 2007;117:1147–1154. doi:10.1172/JCI31178.
- Rodríguez PC, Ochoa AC. Arginine regulation by myeloid derived suppressor cells and tolerance in cancer: mechanisms and therapeutic perspectives. Immunol Rev. 2008;222:180–191. doi:10.1111/j.1600-065X.2008.00608.x.
- Sun Z, Fourcade J, Pagliano O, Chauvin JM, Sander C, Kirkwood JM, Zarour HM. IL10 and PD-1 cooperate to limit the activity of tumor-specific CD8+ T cells. Cancer Res. 2015;75(8):1635–1644. doi:10.1158/0008-5472.CAN-14-3016.
- Roberts AB, Thompson NL, Heine U, Flanders C, Sporn MB. Transforming growth factor-beta: possible roles in carcinogenesis. Br J Cancer. 1988;57:594–600. doi:10.1038/bjc.1988.135.
- Sharma S, Stolina M, Lin Y, Gardner B, Miller PW, Kronenberg M, Dubinett SM. T cell-derived IL-10 promotes lung cancer growth by suppressing both T cell and APC function. J Immunol. 1999;163:5020–5028.
- Curiel TJ, Coukos G, Zou L, Alvarez X, Cheng P, Mottram P, Evdemon-Hogan M, Conejo-Garcia JR, Zhang L, Burow M, et al. Specific recruitment of regulatory T cells in ovarian carcinoma fosters immune privilege and predicts reduced survival. Nat Med. 2004;10:942–949. doi:10.1038/nm1093.
- Yang ZZ, Novak AJ, Ziesmer SC, Witzig TE, Ansell SM. Attenuation of CD8(+) T-cell function by CD4(+)CD25(+) regulatory T cells in B-cell non-Hodgkin’s lymphoma. Cancer Res. 2006;66:10145–10152. doi:10.1158/0008-5472.CAN-06-1822.
- Alvaro T, Lejeune M, Camacho FI, Salvadó MT, Sánchez L, García JF, Lopez C, Jaén J, Bosch R, Pons LE, et al. The presence of STAT1-positive tumor-associated macrophages and their relation to outcome in patients with follicular lymphoma. Haematologica. 2006;91:1605–1612.
- al-Sarireh B, Eremin O. Tumour-associated macrophages (TAMS): disordered function, immune suppression and progressive tumour growth. J R Coll Surg Edinb. 2000;45:1–16.
- Azzaoui I, Uhel F, Rossille D, Pangault C, Dulong J, Le Priol J, Lamy T, Houot R, Le Gouill S, Cartron G, et al. T-cell defect in diffuse large B-cell lymphomas involves expansion of myeloid-derived suppressor cells. Blood. 2016;128:1081–1092. doi:10.1182/blood-2015-08-662783.
- Tosolini M, Algans C, Pont F, Ycart B, Fournié -J-J. Large scale microarray profiling reveals four stages of immune escape in non-Hodgkin lymphomas. Oncoimmunology. 2016;5. doi:10.1080/2162402X.2016.1188246.
- Gu L, Tseng S, Horner RM, Tam C, Loda M, Rollins BJ. Control of TH2 polarization by the chemokine monocyte chemoattractant protein-1. Nature. 2000;404:407–411. doi:10.1038/35006097.
- Yang ZZ, Grote DM, Ziesmer SC, Niki T, Hirashima M, Novak AJ, Witzig TE, Ansell SM. IL-12 upregulates TIM-3 expression and induces T cell exhaustion in patients with follicular B cell non-Hodgkin lymphoma. J Clin Invest. 2012;122:1271–1282. doi:10.1172/JCI59806.
- Kridel R, Xerri L, Gelas-Dore B, Tan K, Feugier P, Vawda A, Canioni D, Farinha P, Boussetta S, Moccia AA, et al. The prognostic impact of CD163-positive macrophages in follicular lymphoma: a study from the bc cancer agency and the lymphoma study association. Clin Cancer Res. 2015;21:3428–3435. doi:10.1158/1078-0432.CCR-14-3253.
- Yang ZZ, Grote DM, Ziesmer SC, Xiu B, Novak AJ, Ansell SM. PD-1 expression defines two distinct T-cell sub-populations in follicular lymphoma that differentially impact patient survival. Blood Cancer J. 2015;5:e281. doi:10.1038/bcj.2015.1.
- Muenst S, Hoeller S, Willi N, Dirnhofera S, Tzankov A. Diagnostic and prognostic utility of PD-1 in B cell lymphomas. Dis Markers. 2010;29:47–53. doi:10.1155/2010/404069.
- Gravelle P, Do C, Franchet C, Mueller S, Oberic L, Ysebaert L, Larocca LM, Hohaus S, Calmels MN, Frenois FX, et al. Impaired functional responses in follicular lymphoma CD8(+)TIM-3(+) T lymphocytes following TCR engagement. Oncoimmunology. 2016;5:e1224044. doi:10.1080/2162402X.2016.1224044.
- Dodd LE, Sengupta S, Chen IH, Den Boon JA, Cheng YJ, Westra W, Newton MA, Mittl BF, McShane L, Chen CJ, et al. Genes involved in DNA repair and nitrosamine metabolism and those located on chromosome 14q32 are dysregulated in nasopharyngeal carcinoma. Cancer Epidemiol Biomarkers Prev. 2006;15:2216–2225. doi:10.1158/1055-9965.EPI-06-0455.
- Cristescu R, Lee J, Nebozhyn M, Km K, Ting JC, Wong SS, Liu J, Yue YG, Wang J, Yu K, et al. Molecular analysis of gastric cancer identifies subtypes associated with distinct clinical outcomes. Nat Med. 2015;21:449–456. doi:10.1038/nm.3850.
- Newman AM, Liu CL, Green MR, Gentles AJ, Feng W, Xu Y, Hoang CD, Diehn M, Alizadeh AA. Robust enumeration of cell subsets from tissue expression profiles. Nat Methods. 2015;12:453–457. doi:10.1038/nmeth.3337.
- Rooney MS, Shukla SA, Wu CJ, Getz G, Hacohen N. Molecular and genetic properties of tumors associated with local immune cytolytic activity. Cell. 2015;160:48–61. doi:10.1016/j.cell.2014.12.033.
- Giulino-Roth L, Wang K, MacDonald TY, Mathew S, Tam Y, Cronin MT, Palmer G, Lucena-Silva N, Pedrosa F, Pedrosa M, et al. Targeted genomic sequencing of pediatric Burkitt lymphoma identifies recurrent alterations in antiapoptotic and chromatin-remodeling genes. Blood. 2012;120:5181–5184. doi:10.1182/blood-2012-06-437624.
- Onnis A, Navari M, Antonicelli G, Morettini F, Mannucci S, De Falco G, Vigorito E, Leoncini L. Epstein-Barr nuclear antigen 1 induces expression of the cellular microRNA hsa-miR-127 and impairing B-cell differentiation in EBV-infected memory B cells. New insights into the pathogenesis of Burkitt lymphoma. Blood Cancer J. 2012;2:e84. doi:10.1038/bcj.2012.29.
- Navari M, Fuligni F, Laginestra MA, Etebari M, Ambrosio MR, Sapienza MR, Rossi M, De Falco G, Gibellini D, Tripodo C, et al. Molecular signature of Epstein Barr virus-positive Burkitt lymphoma and post-transplant lymphoproliferative disorder suggest different roles for Epstein Barr virus. Front Microbiol. 2014;5:728. doi:10.3389/fmicb.2014.00728.
- Shi M, Gan YJ, Davis TO, Scott RS. Downregulation of the polyamine regulator spermidine/spermine N(1)-acetyltransferase by Epstein-Barr virus in a Burkitt’s lymphoma cell line. Virus Res. 2013;177:11–21. doi:10.1016/j.virusres.2013.07.004.
- Morscio J, Finalet Ferreiro J, Vander Borght S, Bittoun E, Gheysens O, Dierickx D, Verhoef G, Wlodarska I, Tousseyn T. Identification of distinct subgroups of EBV-positive post-transplant diffuse large B-cell lymphoma. Mod Pathol. 2017;30:370–381. doi:10.1038/modpathol.2016.199.
- Morscio J, Dierickx D, Ferreiro JF, Herreman A, Van Loo P, Bittoun E, Verhoef G, Matthys P, Cools J, Wlodarska I, et al. Gene expression profiling reveals clear differences between EBV-positive and EBV-negative posttransplant lymphoproliferative disorders. Am J Transplant. 2013;13:1305–1316. doi:10.1111/ajt.12196.
- Hude I, Sasse S, Engert A, Bröckelmann PJ. The emerging role of immune checkpoint inhibition in malignant lymphoma. Haematologica. 2017;102:30–42. doi:10.3324/haematol.2016.150656.
- Roemer MGM, Redd RA, Cader FZ, Pak CJ, Abdelrahman S, Ouyang J, Sasse S, Younes A, Fanale M, Santoro A, et al. Major histocompatibility complex class ii and programmed death ligand 1 expression predict outcome after programmed death 1 blockade in classic hodgkin lymphoma. J Clin Oncol. 2018;36:942–950. doi:10.1200/JCO.2017.77.3994.
- Laurent C, Baron M, Amara N, Haioun C, Dandoit M, Maynadié M, Parrens M, Vergier B, Copie-Bergman C, Fabiani B, et al. Impact of expert pathologic review of lymphoma diagnosis: study of patients from the french lymphopath network. J Clin Oncol. 2017;35:2008–2017. doi:10.1200/JCO.2016.71.2083.
- Swerdlow SH, Campo E, Pileri SA, Harris NL, Stein H, Siebert R, Advani R, Ghielmini M, Salles GA, Zelenetz AD, et al. The 2016 revision of the World Health Organization classification of lymphoid neoplasms. Blood. 2016;127:2375–2390. doi:10.1182/blood-2016-01-643569.
- Laurent C, Guérin M, Frenois FX, Thuries V, Jalabert L, Brousset P, Valmary-Degano S. Whole-slide imaging is a robust alternative to traditional fluorescent microscopy for fluorescence in situ hybridization imaging using break-apart DNA probes. Hum Pathol. 2013;44:1544–1555. doi:10.1016/j.humpath.2012.12.009.
- Steidl C, Shah SP, Woolcock BW, Rui L, Kawahara M, Farinha P, Johnson NA, Zhao Y, Telenius A, Neriah SB, et al. MHC class II transactivator CIITA is a recurrent gene fusion partner in lymphoid cancers. Nature. 2011;471:377–381. doi:10.1038/nature09754.
- Gentles AJ, Newman AM, Liu CL, Bratman SV, Feng W, Kim D, Nair VS, Xu Y, Khuong A, Hoang CD, et al. The prognostic landscape of genes and infiltrating immune cells across human cancers. Nat Med. 2015;21:938–945. doi:10.1038/nm.3909.
- Bindea G, Mlecnik B, Hackl H, Charoentong P, Tosolini M, Kirilovsky A, Fridman WH, Pagès F, Trajanoski Z, Galon J. ClueGO: a Cytoscape plug-in to decipher functionally grouped gene ontology and pathway annotation networks. Bioinformatics. 2009;25:1091–1093. doi:10.1093/bioinformatics/btp101.