
ABSTRACT
Adoptive T cell therapy has shown clinical potential for patients with cancer, though effective treatment is dependent on longevity and potency of the exploited tumor-reactive T cells. Previously, we showed that ex vivo inhibition of AKT using the research compound Akt-inhibitor VIII retained differentiation and improved functionality of minor histocompatibility antigen (MiHA)-specific CD8+ T cells. Here, we compared a panel of clinically applicable AKT-inhibitors with an allosteric or adenosine triphosphate-competitive mode of action. We analyzed phenotype, functionality, metabolism and transcriptome of AKT-inhibited CD8+ T cells using different T cell activation models. Most inhibitors facilitated T cell expansion while preserving an early memory phenotype, reflected by maintenance of CD62L, CCR7 and CXCR4 expression. Moreover, transcriptome profiling revealed that AKT-inhibited CD8+ T cells clustered closely to naturally occurring stem cell-memory CD8+ T cells, while control T cells resembled effector-memory T cells. Interestingly, AKT-inhibited CD8+ T cells showed enrichment of hypoxia-associated genes, which was consistent with enhanced glycolytic function. Notably, AKT-inhibition during MiHA-specific CD8+ T cell priming uncoupled preservation of early memory differentiation from ex vivo expansion. Furthermore, AKT-inhibited MiHA-specific CD8+ T cells showed increased polyfunctionality with co-secretion of IFN-γ and IL-2 upon antigen recall. Together, these data demonstrate that AKT-inhibitors with different modality of action promote the ex vivo generation of stem cell memory-like CD8+ T cells with a unique metabolic profile and retained polyfunctionality. Akt-inhibitor VIII and GDC-0068 outperformed other inhibitors, and are therefore promising candidates for ex vivo generation of superior tumor-reactive T cells for adoptive immunotherapy in cancer patients.
Introduction
Adoptive cell therapy exploiting tumor-reactive CD8+ T cells can be an effective strategy to treat advanced cancers.Citation1-Citation4 Different strategies are applied to generate T cells for infusion, including the expansion of tumor-infiltrating lymphocytes (TIL), genetic modification of T cells with a tumor-reactive T cell receptor (TCR) or chimeric antigen receptor (CAR), or expansion of tumor-reactive T cells from the naïve repertoire. Since the success of adoptive T cell therapy is associated with infusion of a high cell number,Citation5 all strategies include ex vivo activation and expansion. Additionally, in vivo proliferative capacity, persistence, homing to lymphoid organs, and presence of central memory T (TCM) and stem cell memory T (TSCM) cells have shown to be of critical importance for clinical efficacy.Citation1-Citation3,Citation5-Citation9
It has become evident that the differentiation status of an expanded T cell product is of crucial importance for clinical efficacy. However, T cell expansion and differentiation has been shown to be a tightly coupled processes initiated by signaling via the TCR, co-stimulatory molecules and cytokine receptors.Citation6,Citation10,Citation11 These joined signals activate the PI3K/AKT/mTOR-pathway that has been shown to play a pivotal role in regulating CD8+ T cell differentiation and memory formation.Citation12,Citation13 Interestingly however, interference of PI3K/AKT signaling does not severely impair the proliferation of murine CD8+ T cells.Citation14 Therefore, we and others exploited pharmacological AKT-inhibition to generate early memory TSCM/CM-like CD8+ T cells for ex vivo adoptive cell therapy.Citation15-Citation19 Previously, we demonstrated that minor histocompatability antigen (MiHA)-specific CD8+ T cells with early memory traits can be efficiently expanded ex vivo from the naïve repertoire in the presence of the allosteric Akt-inhibitor VIII (AktiVIII).Citation15 Importantly, these AKT-inhibited MiHA-specific CD8+ T cells displayed improved proliferation capacity upon antigen re-encounter after withdrawal of the AKT-inhibitor. Furthermore, they exerted a superior anti-tumor effect in multiple myeloma-bearing mice. Taken together, our results demonstrated that the effect of AKT-inhibition on ex vivo generation of tumor-reactive CD8+ T cells is highly promising for improving adoptive therapy. This uncoupling of T cell differentiation from expansion using AKT-inhibitors has been confirmed in other models, including melanoma-derived tumor-infiltrating lymphocytes and CD19 CAR T cells, as well as by modulation of up- and down-stream targets of the AKT-pathway, including mTORC2 and PI3K-δ.Citation16-Citation18,Citation20,Citation21
Here, we compared and mechanistically studied a panel of AKT-inhibitors that are in clinical development and have either an allosteric or an adenosine triphosphate (ATP)-competitive mode of action. The allosteric inhibitors bind the AKT protein in the pleckstrin-homology (PH) domain, thereby preventing localization of AKT to the plasma membrane and its subsequent phosphorylation.Citation22,Citation23 In contrast, ATP-competitive inhibitors bind the ATP-binding pocket directly, thereby preventing the catalytic effects of ATP during phosphorylation.Citation23 In order to select the most optimal AKT-inhibitor, we compared phenotype, expansion potential, metabolism, transcriptome and cytokine production of AKT-inhibited CD8+ T cells upon polyclonal or antigen-specific activation. Notably, most of the examined AKT-inhibitors preserved an early memory CD8+ T cell phenotype, facilitated superior T cell expansion potential upon re-challenge, and induced a transcriptome profile resembling the TSCM subset. Importantly, the allosteric AktiVIII and ATP-competitive GDC-0068 (GDC) outperformed other AKT-inhibitors and allowed robust expansion of CD62L-expressing MiHA-specific CD8+ T cells with superior polyfunctionality. Together, our findings demonstrate that pharmaceutical AKT inhibition by AktiVIII and GDC is a highly promising strategy for the ex vivo generation of superior early memory T cell products for adoptive immunotherapy in cancer patients.
Results
AKT-inhibition preserves early memory CD8+ T cells, while allowing proliferation and improving expansion capacity upon antigen recall
To develop superior AKT-inhibited T cells for adoptive T cell therapy, we evaluated various AKT-inhibitors that are in clinical development in comparison with the previously studied research-grade AktiVIII compound (). To exclude effects of the solvent DMSO, proliferation and differentiation were first evaluated following exposure to increasing dosages of DMSO. These assays revealed that DMSO levels ≤ 0.5% did not influence our read-out parameters (Supplemental Figure 1). Next, based on extensive pre-screening of different concentrations (data not shown), titrations were performed with increasing dosages of the different AKT-inhibitors during polyclonal stimulation of CD8+ TN cells. The concentration of AktiVIII was already optimized in our previous study,Citation15 and further pre-screenings (data not shown). Generally, AKT-inhibition had minimal effect on T cell viability, as only cells cultured with TCN or the highest dose of GSK2 showed reduced viability (). Proliferation, based on the dilution of cell proliferation dye, was only inhibited at the higher dosages of MK-, AZD- and GSK1 ( and Supplemental Figure 2).
Table 1. Characteristics of Akt-inhibitors.
Figure 1. AKT-inhibition preserves early memory CD8+ T cells with minimal effect on viability and proliferation. CD8+ TN cells were stimulated with CD3/CD28 Dynabeads® in presence of DMSO (Ctrl) or AktiVIII (12 µM), MK (10–5–2.5–1.25 µM), TCN (80–40–20–10 µM), AZD (40–20–10–5 µM), GDC (40–20–10–5 µM), GSK1 (20-10–5-2.5 µM) or GSK2 (40-20-10–5 µM). Viability, proliferation and phenotype were analyzed in 2 independent donors. (A) Percentage viable cells and (B) median fluorescence intensity (MFI) of cell proliferation dye. (C) Representative plots (donor 2) of CD62L expression and cell proliferation dye dilution of Ctrl, 12µM AktiVIII, 5 µM MK, 40 µM TCN, 20 µM AZD, 20 µM GDC, 10 µM GSK1 and 20 µM GSK2-treated T cells, gated on viable CD8+ T cells. Numbers indicate MFI of CD62L. (D) CD62L, CCR7 and CXCR4 expression of CD8+ T cells (Mean + SD, n = 2). Statistical analysis was performed using One-way ANOVA followed by Bonferroni’s Multiple Comparison Test of AKT-inhibited versus Ctrl T cells. ND = not determined, ǂp < 0.001, #p < 0.01, *p < 0.05.
Next, polyclonally expanded CD8+ T cells were analyzed for their differentiation status based on expression of CD62L, CCR7 and CXCR4. While CD62L expression was mostly lost on proliferated DMSO-treated control T cells, its expression was retained in AKT-inhibited conditions (). We observed higher CD62L, CCR7, and CXCR4 expression with increasing dosages of all inhibitors, independent of the action mode of the inhibitor (). This indicates an inverse correlation between T cell differentiation and AKT-inhibition. Notably, T cells exposed to the highest concentrations of AKT-inhibitor showed a less prominent, or even lacked inhibition of differentiation, possibly due to a toxic effect as proliferation and viability were also affected at these dosages ( and Supplemental Figure 2). Together, these data demonstrate that CD8+ T cells cultured in the presence of different AKT-inhibitors at optimal concentrations exhibit a less differentiated phenotype, with good viability and expansion. The AKT-inhibitor TCN was excluded from further evaluations because of its toxic effects and lack of inhibition on T cell differentiation at low dosages.
Subsequently, the different AKT-inhibitors were applied during allogeneic stimulation of CD8+ TN cells. AKT-inhibited T cells were evaluated for activation, differentiation and expansion profile. Here, T cell expansion was inhibited in a dose-dependent manner (), but lower dosing of all inhibitors allowed good T cell expansion. Corresponding phenotype analysis revealed that DMSO-treated control T cells lost CD62L and CCR7 expression upon proliferation, while high expression of these markers was retained on all AKT-inhibited CD8+ T cells, independent of the applied dosage (). Especially CD62L was 3–6 fold higher expressed by all AKT-inhibited CD8+ T cells compared to control T cells. Chemokine receptor CXCR4, normally expressed on naïve T cells and lost upon differentiation, was preserved at T cells treated with the higher dosages of AZD, GDC and GSK1. For MK and GSK2, which were evaluated in different donors, these effects were not found. Importantly, both IL7Rα and co-stimulatory receptor CD28 were higher in all Akt-inhibited conditions (). Moreover, as superior proliferative capacity is one of the major advantages of early memory CD8+ T cells,Citation15,Citation24 we investigated the secondary expansion capacity upon allogeneic restimulation in the absence of AKT-inhibition. Notably, all AKT-inhibited T cells expanded 2 to 10-fold better as compared to control T cells (, p < 0.05). Altogether, these data show that all evaluated AKT-inhibitors allow the generation of increased numbers of early memory CD8+ T cells with superior expansion capacity.
Figure 2. Allogeneic stimulated AKT-inhibited CD8+ T cells retain an early memory phenotype and superior expansion capacity. CD8+ TN cells were stimulated with allogeneic mDCs in presence of DMSO (Ctrl) or AktiVIII (12µM), AZD (12–8-4 µM), GDC (40–30–20 µM), GSK1 (7.5–5-2.5 µM), MK (10–5-2.5 µM) and GSK2 (30-20-10 µM). MK and GSK2 were evaluated in different donors. (A) Relative cell number of AKT-inhibited CD8+ T cells compared to Ctrl T cells. (B) Representative plots of CD62L and CCR7 expression during proliferation of Ctrl, 12 µM AktiVIII, 8 µM AZD, 20 µM GDC, 5 µM GSK1, 5 µM MK and 20 µM GSK2-treated T cells, gated on viable CD8+ T cells. (C) Relative expression of CD62L, CCR7, CXCR4, IL7Rα and CD28 within proliferated CD8+ T cells. (D) Relative expansion of AktiVIII (12 µM), AZD (12–8 µM), GDC (40–30 µM), GSK1 (7.5–5 µM), GSK2 (20-10 µM) or MK (10-5 µM) treated cells during re-stimulation with allo-mDCs for 7 days after removal of AKT-inhibitor. Mean + SD of one representative donor out of 2–5 donors, n = 3 per experiment. Statistical analysis was performed using One-way ANOVA followed by Bonferroni’s Multiple Comparison Test of AKT-inhibited versus Ctrl T cells within donors, ǂp < 0.001, #p < 0.01, *p < 0.05.
AKT-inhibited CD8+ T cells have a transcriptome profile resembling TSCM cells with unique metabolic attributes
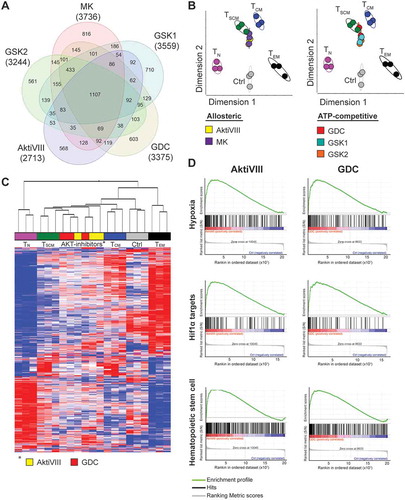
To compare AKT-inhibited allogeneic stimulated CD8+ TN cells with naturally occurring T cell subsets, transcriptome profiling was performed. First, AKT-inhibited T cells were compared to control T cells. We identified 2713, 3736, 3375, 3559, and 3244 differentially expressed genes in AktiVIII, MK, GDC, GSK1 and GSK2 respectively. Analysis in a Venn diagram shows that AKT-inhibited T cells share 1107 genes which were significantly up- or down-regulated compared to control cells (). Nevertheless, a unique transcriptome profile for each AKT-inhibitor was found, ranging from 561 to 816 unique transcripts. To determine whether both allosteric and ATP-competitive AKT-inhibitors show similarities with any of the natural T cell subsets, a principal component analysis was performed. This was based on a set of 900 transcripts which are differentially expressed in the T cell subsets TN, TSCM, TCM and effector memory T cells (TEM) as previously described by Gattinoni et al.Citation24 This analysis revealed that despite their unique transcriptome profiles, both allosteric AKT-inhibitors (left panel) as well as ATP-competitive AKT-inhibitors (right panel) resembled the naturally occurring TSCM subset (). In contrast, DMSO-treated control T cells clustered more closely with the natural occurring TEM cells. Accordingly, unsupervised hierarchical clustering of AktiVIII- and GDC-treated T cells showed a strong association with TSCM and TCM cells, while control T cells clustered with the more differentiated TEM cells (). Importantly, transcriptome profiling confirmed the retained expression of genes expressed by early memory T cells including BCL6, CD28, ICOS, and the FOXO1 targets IL7R, S1PR1 and SELL (Supplemental Figure 3). The effector associated genes EOMES, ID2, KLRG1 and the chemokine ligands XCL1 and XCL2 were found to be lower expressed in AKT-inhibited cells. Additionally, lower expression was observed of genes associated with acquisition of T cell effector functions, including FASLG, GZMA, GZMB, and apoptosis associated genes TRAIL and BAD in AKT-inhibited T cells. Interestingly, the effector associated TBX21 was solely down-regulated in GDC cultured cells. As reported previously,Citation15 the effector associated transcription factor PRDM1, encoding BLIMP1, was highly expressed in AKT-inhibited T cells. Furthermore, naïve and memory associated genes LEF1, SATB1 and TCF7 were surprisingly down-regulated in AKT-inhibited T cells, highlighting unique characteristics of these cells. Further analysis of AktiVIII- and GDC-treated T cells showed enrichment of hematopoietic stem cell associated genes (), emphasizing the existence of a conserved molecular network regulating self-renewal and differentiation in stem cells and early memory T lymphocytes.Citation25 Interestingly, AKT-inhibited T cells were also enriched with hypoxia pathway genes and Hif1α targets compared to control cells (). Together, the transcriptome analysis demonstrates unique profiles for all AKT-inhibited T cell products, which exhibit close resemblance with TSCM cells and enrichment of specific pathways and effector characteristics, independent of the mode of inhibition.
Figure 3. AKT-inhibited CD8+ T cells cluster with TSCM cells and are enriched for hypoxia related- and Hif1α target genes. CD8+ TN cells of 3 independent donors were stimulated with allo-mDCs in presence of DMSO (Ctrl) or AktiVIII (12 µM), MK (5 µM), GDC (10 µM), GSK1 (2.5 µM) or GSK2 (10 µM), followed by gene analysis. (A) Venn diagram with numbers of differentially regulated genes compared with Ctrl T cells. (B) Principle component analysis (PCA) of gene expression in Ctrl, AKT-inhibited and naturally occurring CD8+ T cell subsets. (C) Hierarchical clustering of AktiVIII- or GDC-cultured cells and naturally occuring T cell subsets. (D) Gene set enrichment analysis of AktiVIII- and GDC-treated cells compared to Ctrl cells for hypoxia associated-, Hif1α target, and hematopoietic stem cell associated genes.
Given the positive correlation between AKT-inhibition and hypoxia/HIF1a-induced transcripts, we next investigated whether AKT-inhibition modulated the metabolic characteristics of the expanded CD8+ T cells. For this, allogeneic expanded Akt-inhibited T cells were subjected to metabolic- and glycolytic stress tests. While CD62L expression was significantly higher for all AKT-inhibited T cell conditions compared to DMSO-treated control T cells, no significant finding along different donors in mitochondrial respiration was observed ( and Supplementary Figure 4A-B). Although reduced glycolytic metabolism is associated with CD8+ T cell memory,Citation26,Citation27 we observed a trend towards increased glycolytic function in AKT-inhibited T cells (). The increase in glycolysis was most prominent for AktiVIII-treated T cells (), while other inhibitors showed only moderate effects. No change in glycolytic capacity and glycolytic reserve were found for AKT-inhibited T cells (Supplemental Figure 4C). Interestingly, a positive association was found between CD62L expression and glycolysis upon combining data of all inhibitors (, p = 0.02). These observations were confirmed by enhanced expression of glycolysis-associated PFKM and lower expression oxidative phosphorylation-associated CPT1A (). Combined, these data indicate that inhibition of AKT-signaling preserves a TSCM-like gene expression profile but simultaneously favors enhanced glycolytic function.
Figure 4. AKT-inhibition is associated with increased glycolysis. CD8+ TN cells were stimulated with allo-mDCs in presence of DMSO (Ctrl) or AktiVIII (12 µM), MK (5 µM), GDC (10 µM), GSK1 (2.5 µM) or GSK2 (10 µM) and (A-C) challenged in different metabolic assays or (D) followed by gene analysis. (A) Mitochondrial respiration and glycolytic function of one representative out of 4 donors, n = 4–6. (B) Glycolysis in 4 independent donor, different symbols depict different donors. (C) Association between glycolysis and CD62L expression (Median Fluorescence Intensity, MFI). Data of all Ctrl and AKT-inhibited conditions included. (D) Fold change of PFKM and CPT1A expression compared to Ctrl cells. Statistical analysis was performed using (B) a two-tailed paired t-tests or (C) linear regression with 95% confidence interval, Median Fluorescence Intensity (MFI), ǂp < 0.001, #p < 0.01, *p < 0.05.
AKT-inhibition permits expansion of MiHA-specific CD8+ T cells with an early memory phenotype and superior polyfunctionality
Allogeneic stem cell transplantation (allo-SCT) is a potentially curative treatment for patients with hematological malignancies. Nevertheless, high relapse rates remain a problem. Here, adoptive T cell therapy could be given as adjunctive therapy to boost graft-versus-tumor responses. For that purpose, MiHA-specific CD8+ T cells can be ex vivo expanded from the naive repertoire using two rounds of stimulation with peptide-loaded mDCs. The MK compound was omitted based on the experimental variability observed in these experiments (data not shown). AKT-inhibition limited the expansion of total CD8+ T cells in all conditions, except for AktiVIII- and AZD-treated cells (). This effect occurred especially during the first week of culture, and was most pronounced in GDC- (p < 0.01), GSK1- (p < 0.001) and GSK2-treated cells (p < 0.01). Importantly, the expansion of MiHA-specific CD8+ T cells was not hampered by AKT-inhibition, and even resulted in higher percentages and increased expansion for AKT-inhibited compared with control MiHA-specific CD8+ T cells (). Consistent with our results using polyclonal and allo-MLR stimulations, AKT-inhibited MiHA-specific CD8+ T cells showed increased CD62L expression compared to controls (), with the most pronounced effect for the AktiVIII and GDC compounds (both p < 0.01).
Figure 5. AKT-inhibition preserves CD62L expression while promoting expansion of antigen-specific CD8+ T cells. CD8+ T cells were stimulated with peptide-loaded mDCs for 12 days in the absence (Ctrl) or presence of AktiVIII (12 µM), AZD (4 µM), GDC (10 µM), GSK1 (2.5 µM), or GSK2 (10 µM). (A) Expansion of total CD8+ T cells. (B) Representative tetramer staining and (C) percentages of MiHA-specific CD8+ T cells on day 12 of culture. (D) Expansion of MiHA-specific CD8+ T cells calculated from an estimated precursor frequency of 1:107. (E) Overlays of representative CD62L staining gated on Ctrl or AKT-inhibited MiHA-specific CD8+ T cells. Numbers represent Median Fluorescence Intensity of CD62L. (F) Relative CD62L expression of AKT-inhibited compared to Ctrl MiHA-specific CD8+ T cells on day 12 of culture. (C&F) Individual donors are depicted with unique symbols. Statistical analysis was performed using (A&D) Two-way ANOVA followed by a Bonferroni post-hoc test or a (C&F) one-tailed Wilcoxon matched-pairs signed rank test. ǂp < 0.001, #p < 0.01, *p < 0.05 compared to matched Ctrl cultures.
Since effector T (TEFF) cells can accelerate the differentiation of naïve T cellsCitation28 and the frequency of TEFF differs per donor, we aimed to increase the robustness of our culture protocol by starting the culture with CD8+ TN cells instead of total CD8+ T cells. Here, we selected the most effective AKT-inhibitors of the allosteric and ATP-competitive group: AktiVIII and GDC, respectively. Starting from TN cells, the effect of AKT-inhibition on total CD8+ T cell expansion was less prominent (), and frequencies and expansion of MiHA-specific CD8+ T cells were similar among conditions (). Notably, both AktiVIII and GDC effectively retained CD62L expression, though levels strongly varied (). In case of AktiVIII, this variation could be explained by the expansion of MiHA-specific CD8+ T cells (, p < 0.04), showing that enhanced expansion of MiHA-specific CD8+ T cells was associated with less effective inhibition of differentiation. This correlation was not found for DMSO-treated control or GDC-inhibited T cells (Supplementary Figure 5A).
Figure 6. AKT-inhibited MiHA-specific CD8+ T cells show co-secretion of IFN-γ and IL-2 upon antigen recall. CD8+ TN cells were stimulated with peptide-loaded mDCs in presence of DMSO (Ctrl) or AktiVIII (15 µM) or GDC (12.5 µM). (A) Expansion of total CD8+ T cells. (B) Percentage MiHA-specific CD8+ T cells on day 12 and (C) fold expansion of MiHA-specific CD8+ T cells, calculated from an estimated precursor frequency of 1:106. (D) Relative CD62L expression of AKT-inhibited MiHA-specific CD8+ T cells compared to Ctrl MiHA-specific CD8+ T cells at day 12. (E) Association between CD62L expression and expansion of AktiVIII-treated MiHA-specific CD8+ T cells. (F) Percentage IL-2 producing cells within IFN-γ+CD8+ T cells upon peptide stimulation of re-challenged T cells in the absence of AKT-inhibitor. Mean + SEM of 2 independent donors. (B,D&E) Individual donors are depicted with unique symbols. (E) Statistical analysis was performed using linear regression with 95% confidence interval or (F) Student’s t-test comparing AKT-inhibited T cells with Ctrl T cells, *p < 0.05.
For clinical efficacy and effective targeting of malignant cells, it is essential that in vivo progeny of infused AKT-inhibited T cells possess superior functionality. To investigate this, AKT-inhibited CD8+ T cells were expanded for another 7 days in the absence of inhibitors, followed by analyses of their antigen-specific cytokine profile. In both control and AKT-inhibited conditions, increased IFN-γ production was observed compared to non-stimulated T cells (Supplementary Figure 5B). Importantly, further characterization revealed that only within AktiVIII- and GDC-cultured T cells, these IFN-γ producing cells co-produced IL-2 (). These data demonstrate that AKT-inhibited early memory CD8+ T cells can differentiate into superior polyfunctional effector cells.
Discussion
Adoptive cell therapy is a promising strategy to treat advanced cancer, as demonstrated by the impressive anti-tumor responses in patients treated with CAR T cell or TIL therapy.Citation1-Citation4 However, long-term immune surveillance can be further improved, as sometimes only temporary responses and delayed progression is observed. Improved clinical efficacy of adoptive T cell therapy could be reached by generating tumor-specific T cell products with an early differentiation state, as they show superior longevity and proliferative capacity.Citation1-Citation3,Citation5-Citation9,Citation15-Citation21,Citation24,Citation25,Citation29-Citation35 This could be accomplished by inhibition of the AKT pathway, as was previously shown by us and others.Citation15-Citation21 In this study, we aimed to further optimize AKT-inhibited CD8+ T cells by exploring AKT-inhibitors with diverse modality of action, and further characterize these cells for their phenotype, transcriptome, metabolism and functionality. Here, we showed that both allosteric and ATP-competitive AKT-inhibitors retain T cells in an early memory state, do not hamper the expansion of MiHA-specific CD8+ T cells, and facilitate generation of polyfunctional T cells for adoptive cell therapy.
Although the PI3K-AKT-pathway is known to be involved in cell division and survival,Citation10 the inhibitors in the tested concentrations showed minimal effect on viability and proliferation. Only AKT-inhibitor TCN hampered viability, which may be attributed to its inhibition of DNA synthesis and subsequent cell cycle and apoptosis induction, as previously observed in T-ALL cell lines.Citation36 Importantly, proliferation was only modestly restrained upon exposure to high dosages of inhibitors. This is in agreement with findings of Klebanoff et al., who showed that AKT-inhibition (using low dose AktiVIII) uncouples T cell differentiation from expansion.Citation18 Interestingly, while expansion was not hampered by inhibiting AKT, generation of early memory cells by interference with GSK-3β clearly blocked proliferation of T cells.Citation15,Citation30,Citation33 This makes AKT a very potent candidate for the generation of effective adoptive T cell products.
While proliferation and viability were unaffected, T cells cultured with AKT-inhibitors retained an early memory phenotype. Though allosteric and ATP-competitive inhibitors have different modes of action to prevent AKT phosphorylation, inhibition via either route resulted in T cells with sustained expression of CD62L, CCR7 and CXCR4 compared to control T cells. This naïve associated phenotype indicate that our T cells are closely related to early memory T cells. Moreover, high expression of these homing receptors allows T cell migration to lymphoid organs where they can be activated by antigen-presenting cells.Citation37 Additionally, this enables effective migration to the bone marrow, which has been associated with improved clinical efficacy of donor lymphocyte infusion in leukemia patients.Citation38
In addition to the phenotypical resemblance to early memory T cells, transcriptome analysis revealed clustering of AKT-inhibited cells with the natural TSCM subset. Here, we observed upregulated naïve- and memory-associated genes, while expression of effector-associated genes was lower compared to control T cells. These data are in agreement with previously published data on AKT-inhibited T cells by us and others,Citation15-Citation19 and confirms the extensive down-stream analysis by Klebanoff et al., which highlights FOXO1 as the key player in this process.Citation18 With the increased expression of FOXO1 targets, increased expression of naïve-associated markers, and decreased expression of effector and apoptosis molecules, our AKT-inhibited cells possess unique and superior characteristics for adoptive cell therapy in cancer patients. However, AKT-inhibition did not preserve all naïve associated genes, and did elevated specific effector-related factors, including PRDM1, which could be involved in triggering effector cell functions. This may be attributed to feedback regulations due to close interaction of the transcription factors involved.Citation39
Our results on phenotype and transcriptome correspond to previous findings of AKT-inhibited T cells. However, the metabolic profiling of our AKT-inhibited T cells differed from previously reported Akt-inhibited and GSK-3β-inhibited TSCM-enriched cells.Citation18,Citation33 Instead of an increased oxidative phosphorylation, we observed enhanced glycolysis in AKT-inhibited T cells, especially with AktiVIII inhibition. This observation was confirmed by the higher expression of glycolysis-associated PFKM and decreased expression of OXPHOS-associated CPT1A in our transcriptome analysis. Moreover, the enhanced glycolytic function is in accordance with the observed increase in the highly entangled hypoxia and HIF1α-related pathways.Citation40 These differences may be related to differences in experimental T cell activation models and inhibitor dosing. Furthermore, as downstream targets of AKT, including mTORC1, can also be regulated via other pathways, this may have contributed to different effects on hypoxia, HIF1α targets, and glucose metabolism.Citation40 Moreover, our assays were performed using naïve CD8+ T cells only, whereas others mainly used total PBMCs. Nevertheless, though also in natural memory subsets, including TSCM cells, oxidative metabolism is described to be more dominant,Citation27 a recent publication on autoreactive TSCM cells also observed an increased glycolytic profile.Citation41 They showed that their IL-7 generated TSCM cells were glucose dependent, as a selective GLUT1-inhibitor diminished in vitro TSCM differentiation and cell division. Notably, the increased glycolysis observed in our AKT-inhibited CD8+ T cells may facilitate quicker immune responses and allow effective tumor targeting in low oxygen environments like the tumor mass and bone marrow. This has already been described for hematopoietic stem cells which, as compared to mature blood cells, rely more on glycolysis than on oxidative phosphorylation.Citation42,Citation43 As hematopoietic stem cells reside in stem cell niches with low oxygen levels, they are highly dependent on anaerobic metabolism. Interestingly, low oxygen levels stabilize and activate HIF,Citation44 which is important for the maintenance of hematopoietic stem cells and promotes self-renewal of embryonic stem cells.Citation45,Citation46 Therefore, the enrichment of hypoxia-, HIF1α-targets and hematopoietic stem cell-associated genes in our AKT-inhibited CD8+ T cells could indicate improved self-renewal capacity and good functionality in low oxygen environments.
Upon activation, early memory T cells differentiate into effector cells. Confirming previously published data,Citation15,Citation16,Citation18 AKT-inhibited T cells showed increased secondary expansion capacity after removal of the inhibitor. Moreover, we found that next to IFN-γ, AktiVIII and GDC-treated T cells also produced IL-2, which was not observed in control T cells. This observation is in line with data published by Abu Eid et al. who reported that mouse T cells treated with AKT-inhibitor MK produced higher levels of IL-2.Citation19 Normally, terminally differentiated CD8+ T cells show diminished secretion of IL-2.Citation47 As our Akt-inhibited T cell products effeciently co-produced IL-2 and IFN-γ, this reflects the superior polyfunctionality of our T cells.
For clinical implementation and reduction of variability between cultures, we developed a culture protocol starting with naïve CD8+ T cells. In this way, late memory and effector T cells can no longer stimulate the differentiation of antigen-specific T cells.Citation28 Starting with CD8+ TN cells resulted in an elevated CD62L expression in all cultures, though variation remained high. This variation between cultures might be explained by basal donor variation in AKT expression and phosphorylation,Citation48 showing that optimal dosing is important. As too high AKT-inhibition induces cell death and blocks proliferation, further research could focus on identification of biomarkers for optimal dosing of AKT-inhibitors.
Several adoptive T cell therapy studies have shown that persistence of T cells is essential for durable clinical responses, and that this is mainly dependent of the memory phenotype of the cell product.Citation1-Citation3,Citation5-Citation9,Citation25,Citation29,Citation32,Citation34 This perspective should promote further research and clinical translation of adoptive T cell therapy with interference of the PI3K/AKT/mTOR or Wnt-signalling pathway.Citation15-Citation19,Citation21,Citation33 Here we show that AKT-inhibition can be used for the generation of a unique TSCM-like CD8+ T cell product for adoptive transfer. Though this is irrespective of the mode of action of the inhibitor, the choice of inhibitor does influence the characteristics and, thereby, possibly the clinical potency of the therapeutic product. In conclusion, we show that AktiVIII and GDC are excellent candidates for the generation of a superior MiHA-specific CD8+ T cell therapy, with an early memory phenotype and excellent polyfunctionality. This reaffirms the great potential of AKT-inhibition as a powerful strategy for the generation of effective cell products for immunotherapy in the battle against cancer.
Material and methods
Cell material and isolation
All experiments were performed using peripheral blood mononuclear cells (PBMCs) isolated from buffy coats of healthy donors (Sanquin Blood Supply Foundation). For antigen-specific experiments, HLA-A2 and/or B7-positive donors were used who lack the expression of the MiHA of interest. PBMCs were isolated via Ficoll-paqueTM PLUS gradient (cat#17-1440-03, Sigma-Aldrich), followed by selection of CD14+ and/or CD8+ cells by magnetic bead isolation, on fresh and cryopreserved material respectively (cat#130-050-201 and cat#130-045-201, Miltenyi Biotec). Cryopreserved material was frozen using a Mr. FrostyTM (cat#5100-0001, ThermoFisher) in self made serum-supplemented medium with 10% DMSO. For polyclonal T cell stimulation or allogeneic mixed lymphocyte reactions (allo-MLR), further purification of CD8+ naive T (TN) cells was performed via FACS-sorting of CD3+CD8+CCR7+CD45RO− cells using the FACS Aria (BD Bioscience). The EasySep™ Human Naïve CD8+ T Cell Isolation Kit (cat#19258, Stemcell Technologies) was used to isolate CD8+ TN cells from fresh or cryopreserved material for T cell priming experiments. Cell numbers were based on trypan blue cell counting, and all isolations resulted in ≥90% purity.
Flow cytometry
Flowcytometry stainings were performed on cells resuspended in PBS (cat#3623130, Braun) containing 0.5% bovine serum albumin (BSA, cat#A9647, Sigma). MiHA-specificity of CD8+ T cells was detected via phycoerythrin (PE) and allophycocyanin (APC)-labeled tetramers containing the peptide of interest (HA-1.A2, VLHDDLLEA; HY.B7, SPSVDKARAEL; provided by Prof. JHF Falkenburg, Leiden University Medical Center, Leiden, the Netherlands). Cells were incubated with tetramers for 15 minutes at room temperature (RT) in the dark. Surface marker staining was performed for 30 minutes at 4°C in the dark, using the following antibodies: CD3 (UCHT1 or OKT3, Biolegend), CD8 (3B5, Invitrogen), CD28 (CD28.2, Biolegend), CD45RO (UCHL1, Beckman Coulter), CD62L (DREG56, Biolegend), IL7Rα (A019D5, Biolegend), CCR7 (G04H7, Biolegend), or CXCR4 (12G5, Biolegend). Viability was determined via staining with Fixable Viability Dye eFluor780 for 30 minutes at 4°C in the dark, or by adding SYTOX™ Blue dead cell stain (cat#65-0865-14 and cat#S34857, both ThermoFisher) for 5 minutes at RT prior to analysis. To evaluate T cell cytokine production, intracellular cytokine staining was performed on T cells after overnight peptide rechallenge (5 µM; HA1.A2 (VLHDDLLEA) or HY.B7 (SPSVDKARAEL)) in presence of Brefeldin A (cat#555029, GolgiPlug, BD biosciences). Cells were fixated with 4% paraformaldehyde (cat#P6148, BOOM) for 10 minutes at RT in the dark, followed by permeabilization with 0.1% saponin (cat#47036, Sigma) buffer containing 10% fetal calf serum (FCS, Integro B.V.) for 10 minutes at RT. Intracellular staining was performed using IFN-γ (B27, BD Bioscience) and IL-2 (5.344.111, BD Bioscience) for 30 min at 4°C in the dark. Cells were measured on the Gallios flowcytometer (Beckman Coulter) and analyzed with Kaluza software (Beckman Coulter, version 1.5a). In all analysis, gating was performed based on live and single cells using the dead/live staining and forward- and side scatter. Subsequently, analysis was performed within theCD3+CD8+ T cells. Tetramer-positive CD8+ T cells were defined as double tetramer positive, in combination with a not-gate to exclude aspecific staining and background fluorescence. MiHA-specific CD8+ T cells were further analyzed if a homogenous population was found.
In vitro activation and culture of CD8+ T cells
To generate mature monocyte-derived dendritic cells (mDCs) CD14+ cells were cultured in manufactory pre-tested X-VIVOTM 15 medium (cat#BE02-061Qor cat#BE02-060Q, Lonza), supplemented with 2% human serum (HS, cat#N0398000, Sanquin Blood Supply Foundation), 500 IU/ml IL-4, and 800 IU/ml GM-CSF (cat#11340045 and cat#11343125, ImmunoTools). On day 2 or 3, cells were harvested and re-plated at 0.5 × 10⁶/ml in X-VIVO15 containing 2% HS with 500 IU/ml IL-4 and 800 IU/ml GM-SCF for 3–4 days. To induce maturation, medium was supplemented with 5 ng/ml IL1-β, 15 ng/ml IL-6, 20 ng/ml TNF-α (cat#11340015, cat#11340064, cat#11343015, all ImmunoTools) and 1 µg/ml PGE2 (Prostin E2®, Pfizer) for 2 days.
CD8+ TN cells were stimulated with CD3/CD28 Dynabeads® (cat#11131D, Thermo Fisher) at a 1:1 ratio, or with allogeneic mDCs at a 1:10 DC:T cell ratio for 6–7 days. Prior to activation, CD8 TN cells were labeled with 10µM Cell Proliferation Dye eFluor450 (cat#65–0842-85, Thermo Fisher). For the expansion of MiHA-specific CD8+ T cells, CD8+ T or TN cells were stimulated with peptide-loaded mDCs (5 µM; HA1.A2 (VLHDDLLEA) or HY.B7 (SPSVDKARAEL)) at a DC:T cell ratio of 1:10. T cell cultures were performed in X-VIVO 15 medium containing 10% HS, supplemented with 50 IU/ml IL-2 (Proleukin®, Chiron), 5 ng/ml IL-7 and 5 ng/ml IL-15 (cat#11340075 and cat#11340155, both Immunotools). When indicated, DMSO (cat#102952, Merck millipore)-dissolved Akt-inhibitor VIII (cat#A6730, Sigma), MK-2206, Triciribine, AZD5363, GDC0068, GSK2141795 (cat#HY-10358, cat#HY-15457, cat#HY-15431, cat#HY-15186, cat#HY-15965, all MedChemExpress), GSK2110183 hydrochloride (cat#2460, Axon MedChem) or as control, DMSO alone was added (). For all conditions, not more than 0.5% DMSO was added to the media. Half of the medium, including cytokines and inhibitor or DMSO, was refreshed every 2–3 days. Furthermore, MiHA-specific CD8+ T cell cultures were restimulated with mDCs at day 7. Re-challenge was performed upon restimulation with allogeneic mDCs on day 7 of allo-MLR, or with peptide-loaded mDCs or irradiated peptide-loaded 293T.HLA-A2.CD80.ICAM1 cells on day 12 of the MiHA-specific CD8+ T cell cultures, all in the absence of inhibitor and DMSO.
Microarray analysis
CD8+ T cells were sorted based on Cell Proliferation Dye eFluor450 by FACS-sorting. Proliferated cells were isolated at day 7 of allo-MLR, and total RNA was isolated with the RNeasy Plus Mini Kit (cat#74134, Qiagen). Microarray analysis of control and AKT-inhibited CD8+ T cells was performed as previously described,Citation24 using the Whole Transcript Human Gene 1.0 ST arrays (cat#901085, Affymetrix). The raw data were imported into the Partek Genomincs Suite, normalized using the Robust Multi-array Average (RMA) method and log2 transformed. Principal component analysis (PCA) and hierarchical clustering are presented based on Partek visualization program, using a 900 gene list from Gattinoni et al.Citation24 Enrichment of up- or down-regulated genes was examined with the parametric gene set enrichment analysis (GSEA).Citation49 Enriched gene sets were identified using 1000 permutations of the phenotype labels.
Metabolic assays
CD8+ T cells were sorted based on Cell Proliferation Dye eFluor450 by FACS-sorting. Proliferated cells were isolated at day 7 of allo-MLR, and then rested overnight in medium containing 50 IU/ml IL-2, 5 ng/ml IL-7, 5 ng/ml IL-15 and the corresponding AKT-inhibitor. Then, extracellular acidification rates (ECAR) and oxygen consumption rates (OCR) were measured with the XF96 Extracellular Flux Analyzer (Seahorse, Agilent) in basal medium (DMEM (cat#D5030, Sigma), 143 mM NaCl (cat#3624–01, Baker), 3 ml/L Phenol Red (cat#P0290, Sigma) supplemented with 2 mM L-glutamine (cat#35050–061, Life Technologies) for glycolytic stress tests (GST) and additionally 25 mM d-glucose (cat#4912–12, VWR) and 1 mM sodium pyruvate (cat#360–070, Life Technologies) for mitochondrial stress tests (MST)). GST was measured in response to 80 mM D-glucose, 18 µM oligomycin (cat#75351, Sigma) and 1 M 2-deoxy-d-glucose (2DG, cat#D6134, Sigma). MST was measured in response to 16 µM oligomycin, 4.5 µM fluoro-carbonyl cyanide phenylhydrazone (FCCP, cat#C2920, Sigma), 10 µM rotenone (cat#R8875, Sigma) and 10 µM antimycin A (cat#A8674, Sigma).
Statistics
Statistical analyses were performed with Prism software (GraphPad Software Inc., version 5.03) using a Student’s t-test, Wilcoxon rank test or One- or Two-way ANOVA, followed by a Bonferroni post-hoc test as indicated in the figure legends. Linear regression was calculated with a 95% confidence interval. P values ≤ 0.05 were considered to be significant and were used as predefined response definition.
Additional information regarding minimal information about Tcell assays (MIATA)
This study was conducted in a laboratory that operates under exploratory research principles. Experiments are performed in general research investigative assays according to investigative protocols. Raw data can be provided per request.
Conflict of interest
The authors have no conflicting financial interests.
Supplemental Material
Download MS Word (159.8 MB)Supplemental Material
Supplemental data for this article can be accessed here.
Additional information
Funding
References
- Robbins PF, Dudley ME, Wunderlich J, El-Gamil M, Li YF, Zhou J, Huang J, Powell DJ Jr., Rosenberg SA. Cutting edge: persistence of transferred lymphocyte clonotypes correlates with cancer regression in patients receiving cell transfer therapy. J Immunol. 2004;173(12):7125–7130.
- Rosenberg SA, Yang JC, Sherry RM, Kammula US, Hughes MS, Phan GQ, Citrin DE, Restifo NP, Robbins PF, Wunderlich JR, et al. Durable complete responses in heavily pretreated patients with metastatic melanoma using T-cell transfer immunotherapy. Clin Cancer Res. 2011;17(13):4550–4557. doi:10.1158/1078-0432.ccr-11-0116.
- Louis CU, Savoldo B, Dotti G, Pule M, Yvon E, Myers GD, Rossig C, Russell HV, Diouf O, Liu E, et al. Antitumor activity and long-term fate of chimeric antigen receptor-positive T cells in patients with neuroblastoma. Blood. 2011;118(23):6050–6056. doi:10.1182/blood-2011-05-354449.
- Schuster SJ, Svoboda J, Chong EA, Nasta SD, Mato AR, Anak O, Brogdon JL, Pruteanu-Malinici I, Bhoj V, Landsburg D, et al. Chimeric antigen receptor T cells in refractory B-cell lymphomas. N Engl J Med. 2017;377(26):2545–2554. doi:10.1056/NEJMoa1708566.
- Klebanoff CA, Gattinoni L, Palmer DC, Muranski P, Ji Y, Hinrichs CS, Borman ZA, Kerkar SP, Scott CD, Finkelstein SE, et al. Determinants of successful CD8+ T-cell adoptive immunotherapy for large established tumors in mice. Clin Cancer Res. 2011;17(16):5343–5352. doi:10.1158/1078-0432.CCR-11-0503.
- Crompton JG, Sukumar M, Restifo NP. Uncoupling T-cell expansion from effector differentiation in cell-based immunotherapy. Immunol Rev. 2014. 257(1):264–276. doi:10.1111/imr.12135.
- Klebanoff CA. Gattinoni L and Restifo NP. Sorting through subsets: which T-cell populations mediate highly effective adoptive immunotherapy? J Immunother. 2012. 35(9):651–660. doi:10.1097/CJI.0b013e31827806e6.
- Klebanoff CA, Gattinoni L, Torabi-Parizi P, Kerstann K, Cardones AR, Finkelstein SE, Palmer DC, Antony PA, Hwang ST, Rosenberg SA, et al. Central memory self/tumor-reactive CD8+ T cells confer superior antitumor immunity compared with effector memory T cells. Proc Natl Acad Sci U S A. 2005;102(27):9571–9576. doi:10.1073/pnas.0503726102.
- Radvanyi LG, Bernatchez C, Zhang M, Fox PS, Miller P, Chacon J, Wu R, Lizee G, Mahoney S, Alvarado G, et al. Specific lymphocyte subsets predict response to adoptive cell therapy using expanded autologous tumor-infiltrating lymphocytes in metastatic melanoma patients. Clin Cancer Res. 2012;18(24):6758–6770. doi:10.1158/1078-0432.ccr-12-1177.
- Cantley LC. The phosphoinositide 3-kinase pathway. Science. 2002. 296(5573):1655–1657. doi:10.1126/science.296.5573.1655.
- Kinjyo I, Qin J, Tan SY, Wellard CJ, Mrass P, Ritchie W, Doi A, Cavanagh LL, Tomura M, Sakaue-Sawano A, et al. Real-time tracking of cell cycle progression during CD8+ effector and memory T-cell differentiation. Nat Commun. 2015;6(6301. doi:10.1038/ncomms7301.
- Kim EH, Suresh M. Role of PI3K/Akt signaling in memory CD8 T cell differentiation. Front Immunol. 2013;4(20. doi:10.3389/fimmu.2013.00020.
- Juntilla MM, Wofford JA, Birnbaum MJ. Rathmell JC and Koretzky GA. Akt1 and Akt2 are required for alphabeta thymocyte survival and differentiation. Proc Natl Acad Sci USA. 2007. 104(29):12105–12110. doi:10.1073/pnas.0705285104.
- Macintyre AN, Finlay D, Preston G, Sinclair LV, Waugh CM, Tamas P, Feijoo C. Okkenhaug K and Cantrell DA. Protein kinase B controls transcriptional programs that direct cytotoxic T cell fate but is dispensable for T cell metabolism. Immunity. 2011. 34(2):224–236. doi:10.1016/j.immuni.2011.01.012.
- van der Waart AB, van de Weem NM, Maas F, Kramer CS, Kester MG, Falkenburg JH, Schaap N, Jansen JH, van der Voort R, Gattinoni L, et al. Inhibition of Akt signaling promotes the generation of superior tumor-reactive T cells for adoptive immunotherapy. Blood. 2014;124(23):3490–3500. doi:10.1182/blood-2014-05-578583.
- Crompton JG, Sukumar M, Roychoudhuri R, Clever D, Gros A, Eil RL, Tran E, Hanada K, Yu Z, Palmer DC, et al. Akt inhibition enhances expansion of potent tumor-specific lymphocytes with memory cell characteristics. Cancer Res. 2015;75(2):296–305. doi:10.1158/0008-5472.can-14-2277.
- Urak R, Walter M, Lim L, Wong CW, Budde LE, Thomas S. Forman SJ and Wang X. Ex vivo Akt inhibition promotes the generation of potent CD19CAR T cells for adoptive immunotherapy. J Immunother Cancer. 2017;5(26. doi:10.1186/s40425-017-0227-4.
- Klebanoff CA, Crompton JG, Leonardi AJ, Yamamoto TN, Chandran SS, Eil RL, Sukumar M, Vodnala SK, Hu J, Ji Y, et al. Inhibition of AKT signaling uncouples T cell differentiation from expansion for receptor-engineered adoptive immunotherapy. JCI Insight. 2017;2(23). doi:10.1172/jci.insight.95103.
- Abu Eid R, Friedman KM, Mkrtichyan M, Walens A, King W, Janik J, Khleif SN. Akt1 and −2 inhibition diminishes terminal differentiation and enhances central memory CD8+ T-cell proliferation and survival. Oncoimmunology. 2015. 4(5):e1005448. doi:10.1080/2162402x.2015.1005448.
- Pollizzi KN, Patel CH, Sun IH, Oh MH, Waickman AT, Wen J. Delgoffe GM and Powell JD. mTORC1 and mTORC2 selectively regulate CD8(+) T cell differentiation. J Clin Invest. 2015. 125(5):2090–2108. doi:10.1172/jci77746.
- Abu Eid R, Ahmad S, Lin Y, Webb M, Berrong Z, Shrimali R, Kumai T, Ananth S, Rodriguez PC, Celis E, et al. Enhanced therapeutic efficacy and memory of tumor-specific CD8 T cells by ex vivo PI3K-delta inhibition. Cancer Res. 2017. doi:10.1158/0008-5472.can-16-1925.
- Meuillet EJ. Novel inhibitors of AKT: assessment of a different approach targeting the pleckstrin homology domain. Curr Med Chem. 2011;18(18):2727–2742.
- Lindsley CW, Barnett SF. Layton ME and Bilodeau MT. The PI3K/Akt pathway: recent progress in the development of ATP-competitive and allosteric Akt kinase inhibitors. Curr Cancer Drug Targets. 2008;8(1):7–18.
- Gattinoni L, Lugli E, Ji Y, Pos Z, Paulos CM, Quigley MF, Almeida JR, Gostick E, Yu Z, Carpenito C, et al. A human memory T cell subset with stem cell-like properties. Nat Med. 2011;17(10):1290–1297. doi:10.1038/nm.2446.
- Gattinoni L. Klebanoff CA and Restifo NP. Paths to stemness: building the ultimate antitumour T cell. Nat Rev Cancer. 2012. 12(10):671–684. doi:10.1038/nrc3322.
- Sukumar M, Liu J, Ji Y, Subramanian M, Crompton JG, Yu Z, Roychoudhuri R, Palmer DC, Muranski P, Karoly ED, et al. Inhibiting glycolytic metabolism enhances CD8+ T cell memory and antitumor function. J Clin Invest. 2013;123(10):4479–4488. doi:10.1172/jci69589.
- Pearce EL. Metabolism in T cell activation and differentiation. Curr Opin Immunol. 2010. 22(3):314–320. doi:10.1016/j.coi.2010.01.018.
- Klebanoff CA, Scott CD, Leonardi AJ, Yamamoto TN, Cruz AC, Ouyang C, Ramaswamy M, Roychoudhuri R, Ji Y, Eil RL, et al. Memory T cell-driven differentiation of naive cells impairs adoptive immunotherapy. J Clin Invest. 2016;126(1):318–334. doi:10.1172/jci81217.
- Hinrichs CS, Borman ZA, Gattinoni L, Yu Z, Burns WR, Huang J, Klebanoff CA, Johnson LA, Kerkar SP, Yang S, et al. Human effector CD8+ T cells derived from naive rather than memory subsets possess superior traits for adoptive immunotherapy. Blood. 2011;117(3):808–814. doi:10.1182/blood-2010-05-286286.
- Gattinoni L, Zhong XS, Palmer DC, Ji Y, Hinrichs CS, Yu Z, Wrzesinski C, Boni A, Cassard L, Garvin LM, et al. Wnt signaling arrests effector T cell differentiation and generates CD8+ memory stem cells. Nat Med. 2009;15(7):808–813. doi:10.1038/nm.1982.
- Stemberger C, Neuenhahn M, Gebhardt FE, Schiemann M. Buchholz VR and Busch DH. Stem cell-like plasticity of naive and distinct memory CD8+ T cell subsets. Semin Immunol. 2009. 21(2):62–68. doi:10.1016/j.smim.2009.02.004.
- Busch DH, Frassle SP, Sommermeyer D. Buchholz VR and Riddell SR. Role of memory T cell subsets for adoptive immunotherapy. Semin Immunol. 2016. 28(1):28–34. doi:10.1016/j.smim.2016.02.001.
- Sabatino M, Hu J, Sommariva M, Gautam S, Fellowes V, Hocker JD, Dougherty S, Qin H, Klebanoff CA, Fry TJ, et al. Generation of clinical-grade CD19-specific CAR-modified CD8+ memory stem cells for the treatment of human B-cell malignancies. Blood. 2016;128(4):519–528. doi:10.1182/blood-2015-11-683847.
- Gattinoni L, Klebanoff CA, Palmer DC, Wrzesinski C, Kerstann K, Yu Z, Finkelstein SE, Theoret MR. Rosenberg SA and Restifo NP. Acquisition of full effector function in vitro paradoxically impairs the in vivo antitumor efficacy of adoptively transferred CD8+ T cells. J Clin Invest. 2005. 115(6):1616–1626. doi:10.1172/jci24480.
- Gattinoni L, Speiser DE. Lichterfeld M and Bonini C. T memory stem cells in health and disease. Nat Med. 2017. 23(1):18–27. doi:10.1038/nm.4241.
- Evangelisti C, Ricci F, Tazzari P, Chiarini F, Battistelli M, Falcieri E, Ognibene A, Pagliaro P, Cocco L, McCubrey JA, et al. Preclinical testing of the Akt inhibitor triciribine in T-cell acute lymphoblastic leukemia. J Cell Physiol. 2011;226(3):822–831. doi:10.1002/jcp.22407.
- Brinkman CC. Peske JD and Engelhard VH. Peripheral tissue homing receptor control of naive, effector, and memory CD8 T cell localization in lymphoid and non-lymphoid tissues. Front Immunol. 2013;4(241. doi:10.3389/fimmu.2013.00241.
- Bachireddy P, Hainz U, Rooney M, Pozdnyakova O, Aldridge J, Zhang W, Liao X, Hodi FS, O’Connell K, Haining WN, et al. Reversal of in situ T-cell exhaustion during effective human antileukemia responses to donor lymphocyte infusion. Blood. 2014;123(9):1412–1421. doi:10.1182/blood-2013-08-523001.
- Hu G, Chen J. A genome-wide regulatory network identifies key transcription factors for memory CD8(+) T-cell development. Nat Commun. 2013;4(2830. doi:10.1038/ncomms3830.
- Finlay DK, Rosenzweig E, Sinclair LV, Feijoo-Carnero C, Hukelmann JL, Rolf J, Panteleyev AA. Okkenhaug K and Cantrell DA. PDK1 regulation of mTOR and hypoxia-inducible factor 1 integrate metabolism and migration of CD8+ T cells. J Exp Med. 2012. 209(13):2441–2453. doi:10.1084/jem.20112607.
- Vignali D, Cantarelli E, Bordignon C, Canu A, Citro A, Annoni A, Piemonti L, Monti P. Detection and Characterization of CD8+ Autoreactive Memory Stem T Cells in Patients with Type 1 Diabetes. Diabetes. 2018. doi:10.2337/db17-1390.
- Rogel A, Willoughby JE, Buchan SL, Leonard HJ, Thirdborough SM, Al-Shamkhani A. Akt signaling is critical for memory CD8+ T-cell development and tumor immune surveillance. Proc Natl Acad Sci USA. 2017. 114(7):E1178–e1187. doi:10.1073/pnas.1611299114.
- Simsek T, Kocabas F, Zheng J, Deberardinis RJ, Mahmoud AI, Olson EN, Schneider JW. Zhang CC and Sadek HA. The distinct metabolic profile of hematopoietic stem cells reflects their location in a hypoxic niche. Cell Stem Cell. 2010. 7(3):380–390. doi:10.1016/j.stem.2010.07.011.
- Rafalski VA. Mancini E and Brunet A. Energy metabolism and energy-sensing pathways in mammalian embryonic and adult stem cell fate. J Cell Sci. 2012. 125(Pt 23):5597–5608. doi:10.1242/jcs.114827.
- Miharada K, Karlsson G, Rehn M, Rorby E, Siva K. Cammenga J and Karlsson S. Cripto regulates hematopoietic stem cells as a hypoxic-niche-related factor through cell surface receptor GRP78. Cell Stem Cell. 2011. 9(4):330–344. doi:10.1016/j.stem.2011.07.016.
- Ezashi T. Das P and Roberts RM. Low O2 tensions and the prevention of differentiation of hES cells. Proc Natl Acad Sci U S A. 2005. 102(13):4783–4788. doi:10.1073/pnas.0501283102.
- Sallusto F, Lenig D, Forster R. Lipp M and Lanzavecchia A. Two subsets of memory T lymphocytes with distinct homing potentials and effector functions. Nature. 1999. 401(6754):708–712. doi:10.1038/44385.
- Hutz JE, Manning WA, Province MA, McLeod HL. Genomewide analysis of inherited variation associated with phosphorylation of PI3K/AKT/mTOR signaling proteins. PLoS One. 2011. 6(9):e24873. doi:10.1371/journal.pone.0024873.
- Subramanian A, Tamayo P, Mootha VK, Mukherjee S, Ebert BL, Gillette MA, Paulovich A, Pomeroy SL, Golub TR, Lander ES, et al. Gene set enrichment analysis: a knowledge-based approach for interpreting genome-wide expression profiles. Proc Natl Acad Sci USA. 2005;102(43):15545–15550. doi:10.1073/pnas.0506580102.