
ABSTRACT
Integrins α1β1 (CD49a), α2β1 (CD49b) and αEβ7 (CD103) mediate retention of lymphocytes in peripheral tissues, and their expression is upregulated on tumor infiltrating lymphocytes (TIL) compared to circulating lymphocytes. Little is known about what induces expression of these retention integrins (RI) nor whether RI define subsets in the tumor microenvironment (TME) with a specific phenotype. Human metastatic melanoma-derived CD8 TIL could be grouped into five subpopulations based on RI expression patterns: RIneg, CD49a+ only, CD49a+CD49b+, CD49a+CD103+, or positive for all three RI. A significantly larger fraction of the CD49a+ only subpopulation expressed multiple effector cytokines, whereas CD49a+CD103+ and CD49a+CD49b+ cells expressed IFNγ only. RIneg and CD49a+CD49b+CD103+ CD8 TIL subsets expressed significantly less effector cytokines overall. Interestingly, however, CD49a+CD49b+CD103+ CD8 expressed lowest CD127, and highest levels of perforin and exhaustion markers PD-1 and Tim3, suggesting selective exhaustion rather than conversion to memory. To gain insight into RI expression induction, normal donor PBMC were cultured with T cell receptor (TCR) stimulation and/or cytokines. TCR stimulation alone induced two RI+ cell populations: CD49a single positive and CD49a+CD49b+ cells. TNFα and IL-2 each were capable of inducing these populations. Addition of TGFβ to TCR stimulation generated two additional populations; CD49a+CD49bnegCD103+ and CD49a+CD49b+CD103+. Taken together, our findings identify opportunities to modulate RI expression in the TME by cytokine therapies and to generate subsets with a specific RI repertoire in the interest of augmenting immune therapies for cancer or for modulating other immune-related diseases such as autoimmune diseases.
Introduction
Integrins are transmembrane molecules that mediate intercellular interactions as well as interactions between cells and extracellular matrix. The integrins α1 (CD49a), α2 (CD49b) and αE (CD103) bind collagen IV, collagen I and E-cadherin respectively, and are thought to retain lymphocytes in peripheral non-lymphoid tissues.Citation1-Citation6 These retention integrins (RI) are also highly expressed on tumor infiltrating lymphocytes (TILs) compared to circulating lymphocytes.Citation7 CD49a+ and/or CD103+ T cells residing in healthy peripheral tissues have features of tissue resident memory T (TRM) cells. TRM cells remain in the tissue long term and can be rapidly induced to have effector function upon exposure to antigen.Citation8-Citation13 In addition, RI expression on effector T cells in inflammatory diseases, including arthritis and hypersensitivity responses, exacerbates inflammatory pathology.Citation14 This suggests that RI directly or indirectly support effector T cell function. The presence of CD103+ or CD49a+ TILs in the tumor microenvironment (TME) is associated with improved survival in several types of cancer, suggesting CD49a and CD103 may support retention, survival or effector function of T cells in the TME, or that they may mark a T cell subset more effective in anti-tumor immunity.Citation15-Citation21 Little is known about the contribution of CD49b to T cell persistence or efficacy in the TME.
RI are mainly expressed on T cells after they infiltrate peripheral tissues, suggesting that they are either lineage markers of a later differentiation stage or induced by molecules in the local tissue environment. Little is known about factors inducing RI expression. TGFβ has been shown to upregulate CD103 expression directly on activated CD8 T cells.Citation22-Citation25 While studies have shown a correlation with the presence of TNFα and TGFβ and CD49a+ T cells in mice,Citation26-Citation28 the direct cause of CD49a induction remains unknown. To our knowledge, factors that induce CD49b have not been identified. Understanding the factors that induce expression of RI is crucial for continued improvements of immune therapies, as it gives perspectives on the role of the TME in retention and dissemination of T cells subsets in the tumor.
In addition to the knowledge gap concerning the induction of RI expression, little is known about whether different RI-expression patterns characterize specific functional subsets. We hypothesized that a subset of T cells in the TME co-express CD103 and CD49a, representing memory–like cells. Additionally, we hypothesized that terminal or exhausted effectors can be defined based on RI marker expression pattern. We sought to characterize population dynamics based on the RI expression pattern and to compare in vitro-generated RI+ CD8 T cells to RI+ TIL. We have focused our studies on the effects of TCR stimulation and addition of cytokines associated with antitumor immunity (TNFα, IFNs), tumor-associated immune dysfunction (TGFβ, IL-10), and T cell subsets differentiation (IL-1β, IL-2, IL-4, IL-5, IL-17), as well as chemokines associated with immune cell migration. By defining T cell subsets based on the RI expression profile, generated under different conditions in vitro or patient-derived TIL, we provide insight in the induction of RI as well as a potential link between cytokine presence and RI expressing functional CD8 T cell subsets in the TME.
Materials and methods
Cell culture
All studies were conducted in a laboratory that operates under Good Laboratory Practice (GLP) principles. Peripheral blood mononuclear cells (PBMC) from seven healthy donors were obtained from a leukopak (BRT Laboratories Inc.), a buffy coat (Virginia Blood Services) or volunteers through a Ficoll gradient sedimentation. Purified PBMC were cryopreserved in 90% FCS, 10% DMSO until used. The PBMC were thawed in DNAse (100 U/ml; Worthington Biochemical Corp.) containing media (RPMI 1640 with 5% heat-inactivated (HI) fetal calf serum (FCS) (Gibco), washed and rested overnight in complete media (RPMI 1640 with 5% HI FCS, 1% penicillin/streptomycin (Gibco) and 20 Cetus units (CU)/ml IL-2). Prior to use, FCS was tested for supportive capacity of cell growth and proliferation, as well as screened for mitogenicity. For assays, PBMCs were seeded in 24-well plates at 5 × 10Citation5 cells per well in complete media as described above. PBMCs were stimulated with soluble 1μg/ml purified NA/LE (non-azide, low endotoxin) mouse anti-human CD3 (clone HIT3a, BD Biosciences) and 4μg/ml LEAF (low endotoxin, azide-free) purified anti-human CD28 (clone CD28.2, Biolegend) for 24 hours. In order to prevent overstimulation, medium was replaced after 24 hours and PBMCs were cultured with IFNα (5ng/ml), IFNβ (10 ng/ml), IFNγ (2 ng/ml), IL-1β (1ng/ml), IL-2 (1000 CU/ml), IL-4 (20 ng/ml), IL-5 (10 ng/ml), IL-10 (100 ng/ml), IL-15 (20 ng/ml), IL-17 (50 ng/ml), TGFβ (5 ng/ml), TNFα (50 ng/ml), CCL2 (100 ng/ml), CCL3 (10 ng/ml), CCL4 (20ng/ml), CCL5 (10 ng/ml), CXCL9 (100ng/ml), CXCL10 (50ng/ml), CXCL11 (all 10ng/ml), or CXCL12 (80ng/ml), for seven days in complete media unless indicated otherwise. All cytokines and chemokines were human recombinant proteins obtained from Peprotech. Throughout cell culture, cell numbers were determined by counting with a hemacytometer.
Patient samples
Metastatic melanoma lesions were obtained from surgical specimens with patient consent (IRB 10598). Patients ranged between age 28–87 with stage IIB-IV melanoma, and the cohort included 12 males and 7 females. Three normal donor PBMC samples were used as controls (obtained and processed as described above). Melanoma samples were made into single cell suspensions by mechanical separation and filtered through a 100 micron filter, within 4 hours of collection (median of approximately an hour). Single cells suspensions were cryopreserved in 90% FCS and 10% DMSO using a controlled rate cell freezing container. Cells were cryopreserved in liquid nitrogen ranging from 1 up to 12 years. Samples were thawed as described above for PBMC and counted on a Guava EasyCyte Plus benchtop flow cytometer (cell viability ranged between 33–78% with a median yield of 1.65E+ 07 viable cells). After thaw, cells were either directly stained for flow cytometry or sorted on an Influx Cell Sorter (BD Biosciences). Sorted cells were cultured in RPMI 1640 with 5% heat-inactivated FCS (Gibco), 1% penicillin/streptomycin (Gibco) and 20CU/ml IL-2, and stimulated with 50ng/ml PMA (Sigma-Aldrich) and 1μg/ml Ionomycin (Gibco ThermoFisher Scientific) for 6 hours in the presence of BD Golgiplug (1:1000, BD Biosciences) prior to flow cytometry staining. Experiments included either all 19 patients samples, or a subset selected based on sample availability or cell numbers. Selection was not intentionally made based on survival or stage.
Antibodies and flow cytometry analysis
For surface staining, the following antibodies were used: PE CD49a (TS2/7, Biolegend), APC CD49b (P1H1, eBioscience), Pe-Cy7 CD103 (B-Ly7, eBioscience), PerCP-Cy5.5 CD3 (OKT3, Biolegend), APC-H7 CD8 (Sk1, BD Biosciences), Fitc CD45RO (UCHL1, Biolegend), BV605 CD127 (A019D5, Biolegend), v450 CD69 (FN50, BD Biosciences), FITC IFNγ (B27, BD Biosciences), v450 TNFα (Mab11, BD Biosciences), PE/Dazzle 594 Perforin (dG9, Biolegend), BV605 IL-2 (MQ1-17H12, BD Biosciences), BV650 PD1 (EH12, BD Biosciences) and BV421 TIM3 (7D3, BD Biosciences). Cells were labeled with the LIVE/DEAD® Fixable Aqua dead cell stain (Life Technologies) according to manufacturer’s protocol prior to surface stain to visualize viable cells for analysis. Intracellular staining for PerCP-Cy5.5 Ki67 and BV421 Granzyme B (both BD biosciences) was performed according to instructions in the BD Cytofix/Cytoperm kit (BD Biosciences) for intracellular staining protocol. Flow cytometry data were collected on a Canto II in eight color mode (BD Biosciences) or on a Cytoflex in 14 color mode (Beckman Coulter) and analyzed using FlowJo software V10.1 (Tree Star). In FACS sorting experiments cells were stained similarly, though sorted on a BD Influx Cell Sorter (BD Biosciences). An example of the gating strategy used for these experiments is depicted in supplemental Figure 1A/B. Gating strategies for stains were set based on Fluorescence Minus One (FMO) (extracellular stains) or isotype controls (intracellular stains; Supplemental Figure 1C) with predefined background of < 1%. Raw data for all flow cytometry experiments can be provided per request.
Immunofluorescent staining
Three 4-μm thick sections were cut from each formalin fixed paraffin embedded (FFPE) specimen; a section from a small bowel melanoma metastasis previously shown to contain alpha1+ T cells by flow cytometric analysis was used as a positive control.Citation7
Multispectral Staining was performed according to the manufacturer’s protocol using the OPAL Multiplex Manual IHC kit, and antigen retrieval buffers (AR) 6 and 9 (PerkinElmer, Waltham, Massachusetts, USA). AR for the Sox10 stain was performed using Diva Decloaker (Biocare Medical, Concord, California, USA). Staining sequence, antibodies, and antigen retrieval buffers were as follows:
AR9, CD8 (dilution 1:500; Dako, Santa Clara, California, USA, cat#m710301-2 clone c8) Opal540; AR9, alpha1 (1:4000, Abcam, Cambridge, United Kingdom, cat#ab181434) Opal650; DIVA, Sox10 (1:100, Cell Marque, Rocklin, CA, cat#383A-77) Opal690; and spectral DAPI (PerkinElmer, Waltham, Massachusetts, USA).
Slides were mounted using prolong diamond antifade (Life Technologies, Carlsbad, California, USA) and scanned at 10x magnification using the PerkinElmer Vectra 3.0 system and Vectra software (PerkinElmer, Waltham, Massachusetts, USA). Regions of interest were then identified in Phenochart software, and a 20x magnification images were acquired with the Vectra 3.0 system. These images were spectrally unmixed using a single stain positive controls and analyzed using the InForm software (PerkinElmer, Waltham, Massachusetts, USA).
Image analysis
Images acquired and unmixed by InForm were further analyzed with ImageJ.Citation29 Per slide, the CD8 signal was translated into a Region Of Interest (ROI), within which alpha1 (CD49a) positive pixels were measured and depicted as a fraction of total CD8 positive pixels. Two thresholds were evaluated for both CD8 and CD49a.
Cell separation
CD45RO+ and CD45ROneg cells were isolated from PBMCs directly after thawing, using MACS Anti-Mouse IgG MicroBeads (Miltenyi Biotec) according to manufacturer’s protocol. Briefly, 10Citation7 PBMCs were labeled with Fitc CD45RO (Biolegend) for 1 hour followed by a blocking step with 2% mouse serum in PBS. Cells were washed, incubated with Anti-Mouse IgG MicroBeads and labeled cells were positively selected with a MS MACS separation column. Purity of CD45ROneg and CD45RO+ populations are shown in Supplemental Figure 1D. Both positive and negative populations were stimulated with CD3 and CD28 antibodies followed by 7 days of culture in the presence of the indicated cytokines.
Statistical analysis
RI expression data in different conditions were compared in 3–7 healthy donors or in 19 melanoma tumor samples. The significance of changing conditions as well as marker expression by different subsets was tested with a paired T-test with Graphpad Prism software (edition 7). For multiple group comparisons, a Kruskall-Wallis test was used.
Non-hierarchical clustering
FCS files consisting of CD8+ events were loaded into the R statistical programming environment using the flowCore package from Bioconductor.Citation30,Citation31 Data was compensated using the compensation matrix generated in FlowJo software V10.1 (Tree Star), and transformed using the inverse hyperbolic sin with a cofactor of 150, as described previously.Citation32 The bioconductor package flowSOM was used to build a self-organizing map (SOM) with 9 gridpoints or clusters using CD49a, CD49b, and CD103.Citation33 Data and code for this analysis is available at the UVA Flow Repository.
Results
Expression patterns of CD49a, CD49b and CD103 identify distinct populations of tumor infiltrating CD8 T cells
Tumor-infiltrating CD8 T cells can express CD103, CD49a or CD49b.Citation7 However, the co-expression and functional characteristics of RI+ subsets have not yet been addressed. We evaluated CD8 TIL from 19 melanoma samples from skin, small bowel and lymph node metastases. TIL from all samples contained both RIneg and RI+ populations. Among the RI+ cells we identified a CD49a+CD103neg population, a subpopulation of which also expressed CD49b. These two CD49a+ subsets were present in virtually all samples (). A fraction of tumors also contained a substantial CD103+ TIL population (). The large majority of these CD103+ cells co-expressed either CD49a only or both CD49a and CD49b. Based on these findings, the large majority of CD8 TIL from each patient could be grouped into five subpopulations based on RI expression patterns: RIneg, CD49a+ only, CD49a+CD49b+, CD49a+CD103+, or positive for all three RI (). Importantly, CD103+ subsets were found only in a fraction of tumors, which were mainly small bowel metastases (Supplemental Figure 2A/B). These data reveal variations in RI expression patterns among tumors and raise the possibility that tissue specific factors may contribute to the generation of CD103+ subsets. Interestingly, each RI+ subset expressed at least CD49a, made clear by the absence of CD49b single positive (SP), CD103 SP and CD49bCD103 double positive (DP) TIL in most tumors.
Figure 1. RI expression dynamics on human melanoma-derived CD8 TIL. A total of 19 metastatic tumors were analyzed: 7 small bowel, 5 skin and 7 tumor-involved lymph nodes. (A) Fraction of CD103, CD49a and/or CD49b expressing subsets of CD8 TIL (n = 19). (B) Example showing CD49b co-expression on CD103 and/or CD49a subsets, marking five main subpopulations. (C) Non-hierarchical clustering of CD8 T cells from same 19 patients, based on CD49a, CD49b and CD103 expression. (D) Intensity of RI, activation markers CD45RO and CD69 and memory marker CD127 on clusters as defined in Figure 1C.
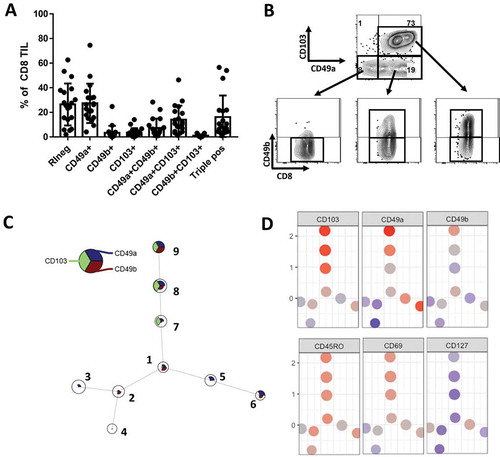
When CD8 TIL from these 19 melanoma metastases were distributed in nine clusters through nonhierarchical clustering based on the frequency of RI expression, we find each of these same subsets (/D). However, they fall into 3 main subcategories: RIneg, CD103+ and CD49a+CD103neg subpopulations. Interestingly, these may also be correlated with expression of activation and memory markers CD45RO, CD69 and CD127 () indicating they may be functionally distinct subpopulations ().
CD49a SP cells express the largest levels of effector activity, while triple positive (TP) cells express the least
To determine whether these five subsets are functionally distinct, they were evaluated by Fluorescence-activated Cell Sorting (FACS) (n = 5, selected from 19 patients stained above) and restimulated with PMA/Ionomycin. After restimulation, IFNγ, TNFα and IL-2 expression were measured by intracellular flow cytometry. Each cytokine was expressed by a significantly larger fraction of the CD49a SP population, whereas a high fraction of the CD49a+CD49b+ and CD49a+CD103+ subsets expressed IFNγ only (). Fractions of RIneg, and CD49a+CD49b+CD103+ CD8 TIL subsets expressing any of the three effector cytokines were substantially lower (). These data indicated that significantly more CD49a SP cells are polyfunctional effectors, whereas CD49a+CD103+ and CD49a+CD49b+ CD8 TIL are primarily monofunctional IFNγ+ effectors and the remaining two subsets are more quiescent. In contrast, cytotoxicity marker perforin was significantly more highly expressed on the subsets expressing multiple RI, compared to CD49a SP cells ().
Figure 2. Functional and phenotypical characteristics of distinct RI+ CD8 TIL subsets. (A) A subset of samples (n = 5, 2 skin metastases, 2 small bowel mets and 1 TIN), selected from the earlier analyzed 19 samples based on T cell numbers and sample availability. Displayed is the fraction of CD8 TIL in each subset expressing IFNγHI (left), TNFα (middle) or IL-2 (right) after 6hr in vitro incubation with PMA/Ionomycin and Brefeldin A. (B) Fraction and geometric mean fluorescent intensity (gMFI) of perforin (n = 5, 1 skin metastases, 2 small bowel metastases and 2 TIN). (C) Proportion of each subset expressing CD127 (n = 19). (D/E) Fraction and intensity of PD1 (D) and TIM3 (E) expression by each RI+ CD8 TIL subpopulation (n = 4, 2 small bowel metastases and 2 TIN, selected based on sample availability). * P < 0.05, ** P ≤ 0.01, *** P ≤ 0.001, **** P < 0.0001.
Quiescence of CD 49a±CD 49b± and CD 49a±CD 49b±CD 103± CD8 TIL may be explained by high expression of exhaustion markers
At this point lower effector cytokine expression by CD49a+CD49b+, CD49a+CD103+ and CD49a+CD49b+CD103+ CD8 TIL subsets could be explained by the gain of either a memory phenotype or an exhausted phenotype. To distinguish between these possibilities, we stained tumors for memory cell marker CD127 and exhaustion markers PD1 and TIM3. Interestingly, CD127 expression was significantly lower in all three subsets, compared to CD49a SP cells (). PD1 and TIM3 expression, however, were significantly higher, both measured as fraction of total subset and geometric MFI (/E). These results suggest that either: CD8 TIL that express multiple retention integrins and thus remain in peripheral tissues may become quiescent/exhausted, or CD8 TIL that become exhausted in the TME also upregulate multiple RI.
CD49a expressing cells are trending to be more prominent in tumors with perivascular T cells, compared to diffusely infiltrated tumors
The phenotype of integrin-expressing cells is distinct among subsets; however, it is unknown whether these integrins also determine the localization of these TIL. To test this we stained FFPE sections from tumors previously characterized as either uninfiltrated (immunotype A), perivascularly infiltrated (immunotype B) or diffusely infiltrated (immunotype C) for CD49a and CD8Citation34. The mean values were 32% (A), 62% (B) and 33% (C) when cells were evaluated with a low threshold (Supplemental Fig. 3A) and 14% (A), 36% (B) and 19% (C) with a high threshold (Supplemental Fig. 3B). These findings provide preliminary data to suggest there may be a difference in CD49a expression depending on T cell location, in particular, associating CD49a-expressing T cells with perivascular locations.
IL-2 increased expression of both CD49a and CD49b on unstimulated T cells
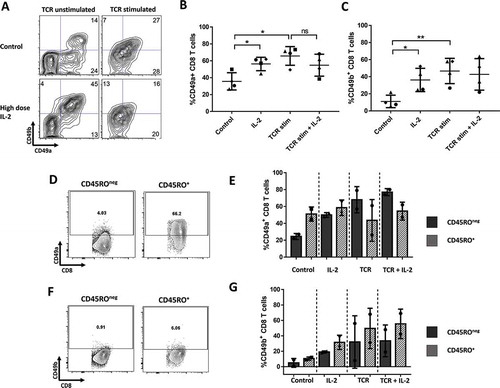
Our in vivo data showed that certain populations always develop, whereas others only develop in a fraction of the tumors. This raises the possibility that immune activation or soluble immune mediators in the tumor environment may be responsible for the development of these RI+ subpopulations, which is known to vary among tumors. We thus hypothesized that TCR stimulation and/or common immune stimulatory or immunosuppressive cytokines would initiate the development of CD49a+ and CD49a+CD49b+ subpopulations. To test this hypothesis, we initially cultured total peripheral blood CD8 T cells with CD3/CD28 antibodies (TCR stimulation) in presence or absence of IL-2. After TCR stimulation alone there were two main RI+ cell populations, one that co-expressed CD49a and CD49b, and another that expressed CD49a alone (, top panels, /C). Interestingly, IL-2 by itself, increased both CD49a+ and CD49b+ CD8 T cell subsets in unstimulated condition resulting in a large population of CD49a+CD49b+ CD8 T cells (, bottom panels, /C). This population expanded after longer periods of culture and was absent when the culture media was not supplemented with IL-2 (data not shown). In TCR stimulated conditions, IL-2 did not further enhance CD49a or CD49b expression (-C). The increase of CD49a and CD49b expression on unstimulated T cells by IL-2 might be explained by selective proliferation of RI+ memory T cells, present among PBMCs. To test this, we separated memory and naïve T cells from PBMC, based on CD45RO expression, before adding IL-2. As expected, most CD49a+ or CD49b+ CD8 T cells at baseline are found among the CD45RO+ subset (/F). However, when stimulated with IL-2 alone, only CD45ROneg CD8 T cells were induced to express CD49a compared to control (). Thus, the increase in CD49a was caused by induction on CD45ROneg, naïve T cells only, rather than selective proliferation or survival of CD49a+ memory cell subsets. CD49b was induced at similar rate in both CD45RO+ and CD45ROneg populations, suggesting that only part of the increase in CD49b+ CD8 T cells with IL-2 may be due to induced expression ().
Figure 3. CD49a and CD49b expression on normal donor CD8 T cells after TCR stim and 7 days of culture with IL-2. (A) Plots for one example. (B and C) Percentage of CD8 T cells expressing CD49a or CD49b. Accumulated data for 4 different donors. (D/F). Baseline CD49a and CD49b expression on CD45ROneg and CD45RO+ ND CD8 T cells. (E/G). CD49a and CD49b expression for either CD45ROneg or CD45RO+ ND CD8 T cells, after TCR stim and 7 days of culture with/without IL-2. * P < 0.05, ** P ≤ 0.01, *** P ≤ 0.001, **** P < 0.0001.
After characterizing the effects of TCR stimulation and IL-2 on RI expression, we tested the impact of adding cytokines and chemokines (IFNα, IFNβ, IFNγ, IL-4, IL-5, IL-10, IL-15, IL-17, CCL2-5 and CXCL9-12), commonly found in the TME. Interestingly, most of these molecules had no discernible effect on RI expression by CD8 T cells in PBMC after 8 day culture with or without TCR stimulation (, supplemental Fig. 5, and data not shown). Data in Table 1 represent geometric MFI values for each condition. IL-10 minimally increased CD49a expression, in the absence of TCR stimulation (Supplemental Fig. 6C). On the other hand, IL-4 decreased CD49a expression when combined with TCR stimulation (Supplemental Fig. 6D).
Table 1. Expression intensity of each retention integrin by CD8 T cells from PBMC cultured 7d with TCR stimulation (TCR) or without TCR stimulation (TCRneg), for selected cytokines and chemokines.
Adding TGFβ after T cell activation further induced CD103 expression on both CD49a± CD8 populations
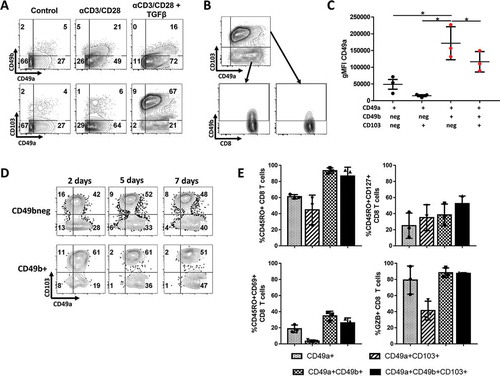
While TCR stimulation and IL-2 were identified as potential factors generating CD49a+ and CD49a+CD49b+ subpopulations, factors responsible for the generation of CD103+ subpopulation in a fraction of the tumors have yet to be identified. Previous studies have shown that CD103 and CD49a can be upregulated by TGFβ when combined with T cell receptor (TCR) stimulation.Citation22-Citation24,Citation28 We thus hypothesized that TGFβ could be responsible for the generation of both CD103+ subsets (CD49a+CD103+ and CD49a+CD49b+ CD103+). When TGFβ was added to TCR stimulation CD49b expression decreased overall (Supplemental Fig. 4B). Importantly, a significant proportion of T cells remained CD49b+, which largely co-expressed CD49a and CD103 (, lower right panel, ), a population we also observed among CD8 TIL. CD49a intensity was also increased by the addition of TGFβ to TCR stimulation. However, in contrast to the in vivo findings, both CD49a+CD49b+ and CD49a+CD49b+CD103+ populations showed a significant increase in CD49a expression intensity (). Importantly, the CD49a intensity increased over time (), indicating that CD49a is upregulated as CD8 T cells differentiate further. CD103 was upregulated by day 2 and did not significantly change over the course of 7 days. These data indicate that, despite all receiving TCR stimulation + TGFβ, CD8 T cells did not uniformly upregulate or downregulate RI. Instead, CD49a, CD49b and/or CD103 expression profiles marked subpopulations from the beginning, indicating the combination of activation followed by TGFβ could play a role in the existence of these subsets on melanoma TIL. For most of the in vitro activated RI subsets, levels of activation, effector or memory cell markers did not change as dramatically as the patient TIL, suggesting that tissue microenvironment and time may play a role in the further differentiation and specification of these subsets ().
Figure 4. Normal donor PBMC were cultured with CD3 and CD28 activating antibodies (TCR stim) for 24h, after which they were grown for 2–7 days with or without TGFβ. (A) CD103, CD49a and CD49b expression percentage on CD8 T cells, with/without 24 hours of TCR stim and/or TGFβ, after 7 days of culture. (B) Visualization of CD49b co-expression on the most dominant CD49a and/or CD103 expressing CD8 T cell populations after TGFβ + TCR stimulation in vitro. (C) Intensity of CD49a expression on a per-cell basis, after TCR stim and 7 days of culture with TGFβ on each CD49a+ subpopulation. *P < 0.05. (D) Induction of CD49a, CD49b and CD103 over time when culture with TGFβ, 2, 5 and 7 days after TCR stimulation. (E) Percentage of RI+ CD8 T cell subsets expressing functional markers CD45RO, CD69, Granzyme B and CD127 expression in most dominant populations, after TCR stim and 7 days of culture with TGFβ. Normal donor PBMC from three different donors were used in this experiment. * P < 0.05, ** P ≤ 0.01, *** P ≤ 0.001, **** P < 0.0001.
TNFα induces CD49a expression on CD8 T cells, though at low intensity
TCR stimulation in conjunction with TGFβ induced very similar RI+ populations as the subsets found among approximately 50% of CD8 melanoma TIL (). However, other patients had very few CD103+ TIL populations (), suggesting low levels of TGFβ in those microenvironments. Yet, in those tumors CD49a was expressed on a high proportion of the TIL. Thus, we hypothesized that in the tumors with low CD103 co-expression, factors other than TGFβ modulate CD49a and/or CD49b expression. Addition of TNFα to TCR stimulation increased CD49a expression slightly, but significantly (/B). However, even after 7 days of culture with TNFα, the intensity of CD49a expression remained low, and the fraction expressing high intensity CD49a seen after TCR stimulation with TGFβ was not observed (). TNFα also decreased CD49b expression when combined with TCR stimulation (), but had no effect on CD103 co-expression which was virtually absent (data not shown).
Figure 5. CD49a and CD49b expression on normal donor CD8 T cells after TCR stim and 7 days of culture with TNFα. (A) Plots for one example. (B and C) Percentage of CD8 T cells expressing CD49a or CD49b. Accumulated data for 7 different donors. (D). CD49a expression intensity histograms under different culture conditions. Examples for one donor. * P < 0.05, ** P ≤ 0.01, *** P ≤ 0.001, **** P < 0.0001.
Discussion
Interactions between tumors and the immune system are often characterized by the presence or absence of infiltrating T lymphocytes; however, there has been little attention paid to the processes that retain T cells in the tumor. RIs are involved in persistence of lymphocytes in healthy peripheral tissues, and their expression has been associated with increased effector function.Citation7,Citation15–Citation18 In human cancers, infiltrating lymphocytes expressing RIs and CD103 have been associated with improved patient survival.Citation7,Citation15 Immune therapy of melanoma and other solid tumors is more effective when infiltrating T cells are present and functional.Citation35-Citation37 Thus, the expression of RI may be critical to patient survival and response to immune therapy. We posit that the presence of functional tumor-reactive T cells within a cancer depends on infiltration, retention, and persistence of function. CD49a, CD49b, and CD103 can mediate retention and function of T cells, thus, failure to induce these integrins may impair T cell persistence and efficacy in the TME. Understanding conditions that enhance RI expression will facilitate the development of strategies to enhance functional antitumor immunity.
In this study, we have identified several subpopulations of CD8 T cells based on their expression of retention integrins. Interestingly these populations are evident both among T cells infiltrating melanoma metastases and among PBMC induced to express RI in vitro. Our findings suggest a stepwise progression of RI expression, which may be accompanied by classical processes of T cell differentiation. In vitro, TCR stimulation alone induced CD49a+ and CD49a+CD49b+ populations. We thus expect that T cells responding to antigen in lymph nodes may upregulate CD49a and/or CD49b and subsequently travel to the tumor site. In melanoma patients, these subpopulations were found among virtually all TIL and contained a heterogeneous population of naïve, effector and memory-like cells. Upon TGFβ addition to TCR stimulation in vitro, CD103 was upregulated on subsets of these cells. These data indicate that CD103+ subsets require an additional signal in vivo to develop, on top of antigen stimulation, similar to what we observed in vitro. This signal is present in some tumors, but not others, and may well be TGFβ. Interestingly, CD103+ CD8 TIL subsets were present at significantly higher fractions in small bowel metastases, compared to tumor involved nodes or skin metastases. Based on these findings, we hypothesize that the tumors, such as skin and TIN metastases, with small to absent CD103+ CD8 TIL have little active TGFβ in the TME. Future studies will test this hypothesis.
Our data confirm the hypothesis that RI expression on CD8 T cells marks functionally and phenotypically distinct subpopulations. Importantly, we found that CD49a SP cells not only are capable of inducing expression of multiple effector cytokines, they additionally expressed memory marker CD127. On the other hand, subsets expressing CD49b and/or CD103 in addition to CD49a were more dysfunctional and expressed high levels of exhaustion markers PD1 and TIM3. These data indicate one of two explanations; CD8 TIL that express multiple retention integrins and thus remain in the TME may become quiescent/exhausted. Alternatively, CD8 TIL that become exhausted in the TME may also upregulate multiple retention integrins. Interestingly though, the most exhausted subsets also expressed the highest level of cytotoxicity marker perforin, suggesting that there may be a diversification in TIL subsets, some that are most polyfunctional for cytokine secretion and others with maximal cytotoxic function. The subset expressing highest perforin levels were also the most exhausted/quiescent, raising important questions about the association between exhaustion state and effector dysfunction. In vivo studies addressing the dynamics of retention integrin expression on CD8 TIL and their location may provide more insight into the relationship among RI expression, exhaustion and effector molecule expression. Regardless, these results offer important insights for adoptive T cell therapies and may guide strategies to selectively enhance more functional T cell subsets in the TME by other immune therapies. However, our preliminary data on CD49a+ CD8 T cell localization showed that differences in functional state may not simply be caused by distinct differentiation state. The different integrins may also provide retention in specific locations within the TME leading to selective exposure to tumor cells. Interestingly, CD49a+ CD8 T cells may be associated with perivascular locations. This may be expected since the primary ligand for CD49a is collagen IV, which is highly expressed in perivascular tissues.
IL-2 increases the proportion of CD49a and CD49b on CD45ROneg CD8 T cells, which raises important questions about the possible advantage of having naïve T cells retained in peripheral tissues. However, we have only selected naïve T cells based on CD45RO and CD45RA expression. Thus, CD8 T cells inducing CD49a and CD49b upon IL-2 stimulation, may also be terminal effectors. If CD49a and CD49b are indeed induced on naïve T cells by IL-2, it is possible that these RI+ naive cells are recruited to and retained in tertiary lymphoid structures (TLS) within chronically inflamed tissues, including tumors, and subsequently get activated in situ.Citation38 High levels of IL-2 in the TME, provided by Th1 CD4 cells, may thus be beneficial for the retention of naïve CD8 cells within TLS’s and thus may increase the probability of their activation by DCs presenting tumor antigen. Heterogeneity of neoantigens has been identified among different metastases in the same tumor;Citation39 so there may be an advantage to retaining naïve T cells that could recognize new antigens locally. Further experiments regarding naïve T cells based on CD45RA as well as CCR7 and CD62L will have to be done to confirm our conclusions.
Since chemokines can recruit T cells to peripheral tissues, and some are critical for activating homing receptors on T cell, we suspected that chemokines may also support their retention in those tissues.Citation40-Citation42 However, none of the 7 chemokines we tested had any impact on induction of these RI. We cannot rule out effects of other chemokines, or effects of chemokines on cytokine-mediated induction of RI, but thus far our data suggest that the process of T cell retention in the TME through integrins is controlled separately from the process of homing to tumor.
The molecular mechanisms by which cytokines upregulate RI are not completely understood. Because CD49a (VLA-1) and CD49b (VLA-2) are induced fully over several days, we suspect the effect of antigen stimulation and/or TGFβ is indirect; so future work should identify key intermediate proteins or signaling pathways. From a clinical perspective, the present report raises the possibility that RI can be upregulated in the TME by changing the cytokine milieu. Manipulations of this sort may enable selective induction of functional rather than dysfunctional T cell subpopulations. Intratumoral or tumor-targeted therapies to support CD49a-mediated T cell retention in the TME may improve the efficacy of current immune therapies by increasing retention and function of long-lived tumor-reactive T cells. We are currently testing whether the present findings can be replicated in vivo in murine models, and whether myeloid cells, stromal cells, or tumor cells themselves may modulate or support RI expression and function of RI+ T cells among both murine and human TIL. Such studies will provide further guidance toward clinical manipulation of RI expression for support of antitumor immunity or for modulation of autoimmune diseases.
Conflicts of Interest
No potential conflict of interest was reported by the authors related to this work.
Supplemental Material
Download MS Word (957.7 KB)Acknowledgments
Special thanks go to Donna Deacon and Kelly Smith, as well as other members of the Slingluff Laboratory for their support and guidance during the project. We particularly appreciate Shawn Gill from the Carter Immunology Center for maintaining the flow cytometry equipment. Furthermore, we thank members of the Slingluff, Bullock and Engelhard laboratories for discussions and feedback.
Supplemental Material
Supplemental data for this article can be accessed here.
Additional information
Funding
References
- Cepek KL, Shaw SK, Parker CM, Russell GJ, Morrow JS, Rimm DL, Brenner MB. Adhesion between epithelial cells and T lymphocytes mediated by E-cadherin and the alpha E beta 7 integrin. Nature. 1994;372:190–193. doi:10.1038/372190a0.
- Roberts AI, Brolin RE, Ebert EC. Integrin alpha1beta1 (VLA-1) mediates adhesion of activated intraepithelial lymphocytes to collagen. Immunology. 1999;97:679–685.
- Kim SK, Schluns KS, Lefrancois L. Induction and visualization of mucosal memory CD8 T cells following systemic virus infection. J Immunol. 1999;163:4125–4132.
- Cepek KL, Parker CM, Madara JL, Brenner MB. Integrin alpha E beta 7 mediates adhesion of T lymphocytes to epithelial cells. J Immunol. 1993;150:3459–3470.
- Wakim LM, Woodward-Davis A, Bevan MJ. Memory T cells persisting within the brain after local infection show functional adaptations to their tissue of residence. Proc Natl Acad Sci U S A. 2010;107:17872–17879. doi:10.1073/pnas.1010201107.
- El-Asady R, Yuan R, Liu K, Wang D, Gress RE, Lucas PJ, Drachenberg CB, Hadley GA. TGF-{beta}-dependent CD103 expression by CD8(+) T cells promotes selective destruction of the host intestinal epithelium during graft-versus-host disease. J Exp Med. 2005;201:1647–1657. doi:10.1084/jem.20041044.
- Salerno EP, Olson WC, McSkimming C, Shea S, Slingluff CL Jr. T cells in the human metastatic melanoma microenvironment express site-specific homing receptors and retention integrins. Int J Cancer J Int Du Cancer. 2014;134:563–574. doi:10.1002/ijc.28391.
- Piet B, De Bree GJ, Smids-Dierdorp BS, Van Der Loos CM, Remmerswaal EB, Von Der Thusen JH, Van Haarst JMW, Eerenberg JP, Ten Brinke A, Van Der Bij W, et al. CD8(+) T cells with an intraepithelial phenotype upregulate cytotoxic function upon influenza infection in human lung. J Clin Invest. 2011;121:2254–2263. doi:10.1172/JCI44675.
- Franciszkiewicz K, Le Floc’h A, Jalil A, Vigant F, Robert T, Vergnon I, Mackiewicz A, Benihoud K, Validire P, Chouaib S, et al. Intratumoral induction of CD103 triggers tumor-specific CTL function and CCR5-dependent T-cell retention. Cancer Res. 2009;69:6249–6255. doi:10.1158/0008-5472.CAN-08-3571.
- Boisvert M, Gendron S, Chetoui N, Aoudjit F. Alpha2 beta1 integrin signaling augments T cell receptor-dependent production of interferon-gamma in human T cells. Mol Immunol. 2007;44:3732–3740. doi:10.1016/j.molimm.2007.04.003.
- Richter MV, Topham DJ. The alpha1beta1 integrin and TNF receptor II protect airway CD8+ effector T cells from apoptosis during influenza infection. J Immunol. 2007;179:5054–5063. doi:10.4049/jimmunol.179.8.5054.
- Mackay LK, Rahimpour A, Ma JZ, Collins N, Stock AT, Hafon ML, Vega-Ramos J, Lauzurica P, Mueller SN, Stefanovic T, et al. The developmental pathway for CD103(+)CD8+ tissue-resident memory T cells of skin. Nat Immunol. 2013;14:1294–1301. doi:10.1038/ni.2744.
- Gebhardt T, Lm W, Eidsmo L, Pc R, Wr H, Carbone FR. Memory T cells in nonlymphoid tissue that provide enhanced local immunity during infection with herpes simplex virus. Nat Immunol. 2009;10:524–530. doi:10.1038/ni.1718.
- De Fougerolles AR, Sprague AG, Nickerson-Nutter CL, Chi-Rosso G, Rennert PD, Gardner H, Gotwals PJ, Lobb RR, Koteliansky VE. Regulation of inflammation by collagen-binding integrins alpha1beta1 and alpha2beta1 in models of hypersensitivity and arthritis. J Clin Invest. 2000;105:721–729. doi:10.1172/JCI7911.
- Webb JR, Wick DA, Nielsen JS, Tran E, Milne K, McMurtrie E, Nelson BH. Profound elevation of CD8+ T cells expressing the intraepithelial lymphocyte marker CD103 (alphaE/beta7 Integrin) in high-grade serous ovarian cancer. Gynecol Oncol. 2010;118:228–236. doi:10.1016/j.ygyno.2010.05.016.
- Webb JR, Milne K, Watson P, Deleeuw RJ, Nelson BH. Tumor-infiltrating lymphocytes expressing the tissue resident memory marker CD103 are associated with increased survival in high-grade serous ovarian cancer. Clinical Cancer Res. 2014;20:434–444. doi:10.1158/1078-0432.CCR-13-1877.
- Cresswell J, Robertson H, Neal DE, Griffiths TR, Kirby JA. Distribution of lymphocytes of the alpha(E)beta(7) phenotype and E-cadherin in normal human urothelium and bladder carcinomas. Clin Exp Immunol. 2001;126:397–402.
- Djenidi F, Adam J, Goubar A, Durgeau A, Meurice G, De Montpreville V, Validire P, Besse B, Mami-Chouaib F. CD8+CD103+ tumor-infiltrating lymphocytes are tumor-specific tissue-resident memory T cells and a prognostic factor for survival in lung cancer patients. J Immunol. 2015;194:3475–3486. doi:10.4049/jimmunol.1402711.
- Workel HH, Komdeur FL, Wouters MC, Plat A, Klip HG, Eggink FA, Wisman GBA, Arts HJG, Oonk MHM, Mourits MJE, et al. CD103 defines intraepithelial CD8+ PD1+ tumour-infiltrating lymphocytes of prognostic significance in endometrial adenocarcinoma. Eur J Cancer. 2016;60:1–11. doi:10.1016/j.ejca.2016.02.026.
- Wang ZQ, Milne K, Derocher H, Webb JR, Nelson BH, Watson PH. CD103 and intratumoral immune response in breast cancer. Clinical Cancer Res. 2016;22:6290–6297. doi:10.1158/1078-0432.CCR-16-0732.
- Murray T, Fuertes Marraco SA, Baumgaertner P, Bordry N, Cagnon L, Donda A, Romero P, Verdeil G, Speiser DE. Very late antigen-1 marks functional tumor-resident CD8 T cells and correlates with survival of melanoma patients. Front Immunol. 2016;7:573. doi:10.3389/fimmu.2016.00573.
- Rihs S, Walker C, Virchow JC Jr., Boer C, Kroegel C, Giri SN, Braun RK. Differential expression of alpha E beta 7 integrins on bronchoalveolar lavage T lymphocyte subsets: regulation by alpha 4 beta 1-integrin crosslinking and TGF-beta. Am J Respir Cell Mol Biol. 1996;15:600–610. doi:10.1165/ajrcmb.15.5.8918367.
- Kilshaw PJ, Murant SJ. A new surface antigen on intraepithelial lymphocytes in the intestine. Eur J Immunol. 1990;20:2201–2207. doi:10.1002/eji.1830201008.
- Kilshaw PJ, Murant SJ. Expression and regulation of beta 7(beta p) integrins on mouse lymphocytes: relevance to the mucosal immune system. Eu J Immunol. 1991;21:2591–2597. doi:10.1002/eji.1830211041.
- Sheridan BS, Lefrancois L. Regional and mucosal memory T cells. Nat Immunol. 2011;12:485–491.
- Goldstein I, Ben-Horin S, Koltakov A, Chermoshnuk H, Polevoy V, Berkun Y, Amariglio N, Bank I. alpha1beta1 Integrin+ and regulatory Foxp3+ T cells constitute two functionally distinct human CD4+ T cell subsets oppositely modulated by TNFalpha blockade. J Immunol. 2007;178:201–210. doi:10.4049/jimmunol.178.1.201.
- Ben-Horin S, Goldstein I, Koltakov A, Langevitz P, Ehrenfeld M, Rosenthal E, Gur H, Bank I. The effect of blockade of tumor necrosis factor alpha on VLA-1+ T-cells in rheumatoid arthritis patients. J Clin Immunol. 2007;27:580–588. doi:10.1007/s10875-007-9119-6.
- Zhang N, Bevan MJ. Transforming growth factor-beta signaling controls the formation and maintenance of gut-resident memory T cells by regulating migration and retention. Immunity. 2013;39:687–696. doi:10.1016/j.immuni.2013.08.019.
- Schindelin J, Arganda-Carreras I, Frise E, Kaynig V, Longair M, Pietzsch T, Preibisch S, Rueden C, Saalfeld S, Schmid B, et al. Fiji: an open-source platform for biological-image analysis. Nat Methods. 2012;9:676–682. doi:10.1038/nmeth.2019.
- Ellis B, Haaland P, Hahne F, Le Meur N, Gopalakrishnan N, Spidlen J, Jiang M. flowCore: Basic structures for flow cytometry data. R package version 1.44.0. 2017. doi:10.18129/B9.bioc.flowCore
- Tenenbaum D and Biocore Team. BiocInstaller: Install/Update Bioconductor, CRAN, and github Packages. R package version 1.28.0. 2017. doi: 10.18129/B9.bioc.BiocInstaller
- Bendall SC, Simonds EF, Qiu P, Amir El AD, Po K, Finck R, Bruggner RV, Melamed R, Trejo A, Ornatsky OI, et al. Single-cell mass cytometry of differential immune and drug responses across a human hematopoietic continuum. Science. 2011;332:687–696. doi:10.1126/science.1198704.
- Van Gassen S, Callebaut B, Van Helden MJ, Lambrecht BN, Demeester P, Dhaene T, Saeys Y. FlowSOM: Using self-organizing maps for visualization and interpretation of cytometry data. Cytometry A. 2015;87:636–45. doi: 10.1002/cyto.a.22625.
- Erdag G, Schaefer JT, Smolkin ME, Deacon DH, Shea SM, Dengel LT, Patterson JW, Slingluff CL. Immunotype and immunohistologic characteristics of tumor-infiltrating immune cells are associated with clinical outcome in metastatic melanoma. Cancer Res. 2012;72:1070–1080. doi:10.1158/0008-5472.CAN-11-3218.
- Clemente CG, Mihm MC Jr., Bufalino R, Zurrida S, Collini P, Cascinelli N. Prognostic value of tumor infiltrating lymphocytes in the vertical growth phase of primary cutaneous melanoma. Cancer. 1996;77:1303–1310. doi:10.1002/(SICI)1097-0142(19960401)77:7<1303::AID-CNCR12>3.0.CO;2-5.
- Boon T, van der Bruggen P. Human tumor antigens recognized by T lymphocytes. J Exp Med. 1996;183:725–729.
- Weiss GR, Grosh WW, Chianese-Bullock KA, Zhao Y, Liu H, Slingluff CL Jr., Marincola FM, Wang E. Molecular insights on the peripheral and intratumoral effects of systemic high-dose rIL-2 (aldesleukin) administration for the treatment of metastatic melanoma. Clinical Cancer Res. 2011;17:7440–7450. doi:10.1158/1078-0432.CCR-11-1650.
- Dieu-Nosjean MC, Goc J, Giraldo NA, Sautes-Fridman C, Fridman WH. Tertiary lymphoid structures in cancer and beyond. Trends Immunol. 2014;35:571–580. doi:10.1016/j.it.2014.09.006.
- Carreno BM, Magrini V, Becker-Hapak M, Kaabinejadian S, Hundal J, Petti AA, Ly A, Lie W-R, Hildebrand WH, Mardis ER, et al. Cancer immunotherapy. A dendritic cell vaccine increases the breadth and diversity of melanoma neoantigen-specific T cells. Science. 2015;348:803–808. doi:10.1126/science.aaa3828.
- Agace WW. Tissue-tropic effector T cells: generation and targeting opportunities. Nat Reviews Immunol. 2006;6:682–692. doi:10.1038/nri1869.
- Brinkman CC, Peske JD, Engelhard VH. Peripheral tissue homing receptor control of naive, effector, and memory CD8 T cell localization in lymphoid and non-lymphoid tissues. Front Immunol. 2013;4:241. doi:10.3389/fimmu.2013.00241.
- Woods AN, Wilson AL, Srivinisan N, Zeng J, Dutta AB, Peske JD, Tewalt EF, Gregg RK, Ferguson AR, Engelhard VH. Differential expression of homing receptor ligands on tumor-associated vasculature that control CD8 effector T-cell entry. Cancer Immunol Res. 2017;5:1062–1073. doi:10.1158/2326-6066.CIR-17-0190.