
ABSTRACT
Programmed death-ligand 1 (PD-L1) and its receptor programmed cell death protein 1 (PD-1) modulate antitumor immunity and are major targets of checkpoint blockade immunotherapy. However, clinical trials of anti-PD-L1 and anti-PD-1 antibodies in breast cancer demonstrate only modest efficacy. Furthermore, specific PD-L1 contributions in various tissue and cell compartments to antitumor immunity remain incompletely elucidated. Here we show that PD-L1 expression is markedly elevated in mature adipocytes versus preadipocytes. Adipocyte PD-L1 prevents anti-PD-L1 antibody from activating important antitumor functions of CD8+ T cells in vitro. Adipocyte PD-L1 ablation obliterates, whereas forced preadipocyte PD-L1 expression confers, these inhibitory effects. Pharmacologic inhibition of adipogenesis selectively reduces PD-L1 expression in mouse adipose tissue and enhances the antitumor efficacy of anti-PD-L1 or anti-PD-1 antibodies in syngeneic mammary tumor models. Our findings provide a previously unappreciated approach to bolster anticancer immunotherapy efficacy and suggest a mechanism for the role of adipose tissue in breast cancer progression.
Introduction
Tumors utilize various immunosuppressive mechanisms to avoid elimination by host antitumor immunity.Citation1,Citation2 Adaptive mechanisms in tumor cells include inflammatory cytokine-induced expression of the immune checkpoint molecule programmed death-ligand 1 (PD-L1),Citation2,Citation3 which is encoded by the gene CD274. Through its interaction with the corresponding receptor programmed cell death protein 1 (PD-1) on the surface of immune cells, tumor PD-L1 suppresses antitumor immunity in the tumor microenvironment by multiple mechanisms including induction of T cell apoptosis and functional exhaustion.Citation2,Citation4 More recent studies show that PD-L1 expressed in host immune cells including myeloid cells also contribute to suppression of antitumor immunity and immunotherapy.Citation5–Citation7 Anti-PD-L1 and anti-PD-1 antibody immunotherapies block the immune-suppressive actions of PD-L1/PD-1 to mediate durable responses and have become standard of care for multiple cancer types.Citation8–Citation14 However, these antitumor immunotherapies are only effective for a subset of cancer patients and are not usually curative. In particular, clinical efficacy of anti-PD-1 antibodies in other solid tumors such as triple-negative breast cancer is modest.Citation15–Citation19 There is thus an unmet clinical need to identify better therapies to improve responses to the current antitumor immunotherapies.
Adipose tissue exerts its well-documented impact on cancer development and progression primarily through secretion of various soluble tumor-promoting factors including hormones, cytokines, reactive oxygen species, extracellular matrix, and lipid metabolites.Citation20–Citation27 Both preadipocytes and mature adipocytes have distinct roles in the tumor microenvironment.Citation28 For example, we and others have shown that preadipocytes are a significant source of local estrogens and likely contribute to obesity-associated breast cancer risk in postmenopausal women.Citation29–Citation31 Likewise, mature adipocytes promote tumor growth and invasiveness through adipocyte-produced proteins and lipid metabolites.Citation32–Citation36 In addition to direct tumor-adipose communications, recent studies also suggest cancer-promoting functions of adipocytes through their ability to influence the behaviors of other components in the tumor microenvironment. For example, adipocyte-secreted vascular endothelial growth factor (VEGF)-A and interleukin (IL)-1β promote tumor angiogenesis and recruitment of immunosuppressive neutrophils to the tumor microenvironment, respectively.Citation37,Citation38 Given the impact of adiposity on breast cancer development and progression and the complexity of the tumor microenvironment, it is important to understand the tumor-adipose network better.
In the current work, we utilized in vitro cell culture systems to examine PD-L1 expression during adipogenesis and the impact of adipose PD-L1 on the ability of anti-PD-L1 antibody to promote antitumor effector function of T cells. To validate these effects in vivo, we used syngeneic mouse mammary tumor models to assess the impact of GW9662, a pharmacologic inhibitor of adipogenesis, on immune checkpoint blockade-based immunotherapy. Our data suggest a previously unappreciated role of adipose PD-L1 in antitumor immunity and immunotherapy outcomes. Furthermore, our findings inform novel approaches to bolster clinical efficacy of current immunotherapies for breast cancer.
Results
PD-L1 is highly induced during adipogenesis
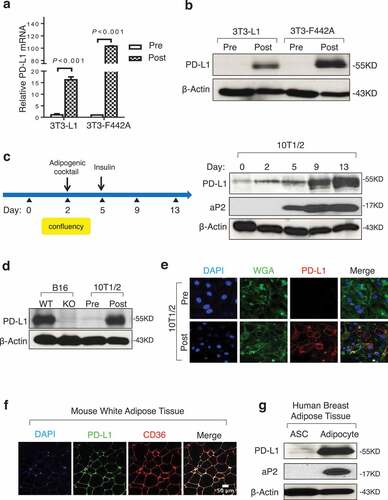
By mining the ENCODE mouse transcriptome database, we found that adipose tissue of various depots (gonadal, subcutaneous, mammary) express high levels of PD-L1 mRNA (Supplementary Figure 1). To determine the specific adipogenic stage at which PD-L1 is expressed, we induced adipogenesis in vitro using mouse 3T3-derived preadipocyte lines 3T3-L1 and 3T3-F424A (Supplementary Figure 2a). PD-L1 mRNA levels increased by approximately 15- and 100-fold following differentiation of 3T3-L1 and 3T3-F424A, respectively (). In support, PD-L1 protein levels were undetectable in both parental preadipocyte lines but were markedly induced post adipogenesis (). To confirm these findings, we also analyzed PD-L1 expression in a multipotent mouse adipose progenitor cell line 10T1/2 (Supplementary Figure 2a). Authenticity of the adipose PD-L1 protein band in immunoblotting was confirmed by PD-L1-specific siRNA knockdown (Supplementary Figure 2b). In a time-course study, we found that PD-L1 levels were elevated significantly during adipogenesis, along with adipocyte binding protein 2 (aP2), an established marker for mature adipocytes (). Notably, induced PD-L1 protein levels post adipose differentiation were comparable to those in B16 melanoma cells (), an extensively studied tumor model for PD-L1-mediated immunosuppression. Immunofluorescent staining confirmed that adipose PD-L1 is predominantly localized to the cell membrane of mature adipocytes differentiated in vitro (). To extend the mouse cell line-based findings, we conducted immunofluorescent staining for PD-L1 in mouse subcutaneous white adipose tissue (WAT). PD-L1 was detected primarily on the membrane of mature adipocytes, which were co-stained with adipocyte marker CD36 (). Lastly, we assessed PD-L1 protein levels in three pairs of primary human adipose stromal cells (ASCs) and adipocytes isolated from three healthy donors undergoing reduction mammoplasty. Human adipocytes express substantially higher PD-L1 protein versus ASCs isolated from the same donors (, data not shown). Taken together, our data clearly demonstrate that adipose PD-L1 is highly induced during adipogenesis.
Figure 1. Adipocytes express high levels of PD-L1. (a) PD-L1 mRNA by PCR in 3T3-L1 and 3T3-F442A pre- and post-adipogenesis. (b) PD-L1 protein in cells by WB before and after adipogenesis. (c) Diagram for in vitro adipogenesis (left) and PD-L1 protein expression at different stages of adipogenesis in 10T1/2 (right). aP2 is an adipogenic marker and β-actin is the loading control. (d) Comparison of PD-L1 protein by WB in 10T1/2 pre/post adipogensis and PD-L1 WT/KO B16 melanoma cells. (e) Representative immunofluorescence images of PD-L1 (red), plasma membrane marker wheat germ agglutinin (WGA, green) and nuclear marker DAPI (blue) in pre- and post-adipogenic 10T1/2 cells. (f) Immunostaining of PD-L1 and CD36 using WAT from C57BL/6 mice. (g) WB of PD-L1 and aP2 proteins in adipose stromal cells (ASC) and adipocytes from human breast tissue. One representative result from three donor samples are shown here. β-Actin is used as the loading control. Values represent mean ± SD
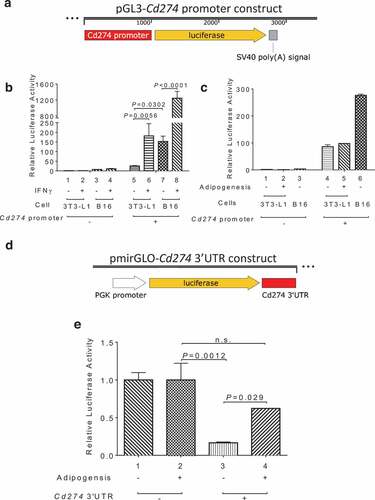
To discern the underlying regulatory mechanism by which PD-L1 expression is induced during adipogenesis, we sub-cloned the proximal promoter sequence of the mouse Cd274/Pd-l1 gene into a promoter-less luciferase reporter vector (). As expected, the resulting reporter was significantly activated in B16 melanoma cells by IFNγ (lanes 7 and 8 in ), a cytotoxic cytokine and known stimulus of tumor PD-L1 released by CD8+ T cells. When transfected into 3T3-L1 preadipocytes, the same Cd274/Pd-l1 luciferase reporter was also stimulated by IFNγ (lanes 5 and 6 in ). However, unlike endogenous PD-L1, this reporter gene was not stimulated by adipogenic medium (lanes 4 and 5 in ), suggesting that the proximal Cd274/Pd-l1 promoter sequence is not sufficient for adipogenesis-induced activation of PD-L1 expression in preadipocytes. Next, we engineered a luciferase reporter construct that contains a constitutively active, heterologous promoter (PGK) and the 3’ untranslated region (3’UTR) of the Cd274/Pd-l1 gene (). When transfected into undifferentiated 10T1/2 cells, the Cd274/Pd-l1 3’UTR-fused reporter construct exhibited significantly lower luciferase activity than the parental control reporter (lanes 1 and 3 in ), suggesting a repressive function of the 3’UTR region. Interestingly, this inhibitory activity was largely mitigated following adipogenesis (lanes 2 and 4 in ), which likely contributes to augmented expression of endogenous PD-L1 during adipogenesis.
Figure 2. 3’ UTR-mediated control of PD-L1 expression during adipogenesis. (a) Diagram of the pGL3-Cd274/Pd-l1 promoter reporter construct. (b) IFNγ stimulation of Cd274 promoter-driven luciferase in B16 and 3T3-L1 cells. (c) Cd274 promoter-driven luciferase reporter activity before and after adipogenesis. (d) Diagram of the pmirGLO-CD274 3’UTR reporter construct. (e) Cd274 3’UTR luciferase reporter activity before and after adipogenesis
Adipose PD-L1 blocks anti-PD-L1 antibody effects on CD8+ T cell functions in vitro
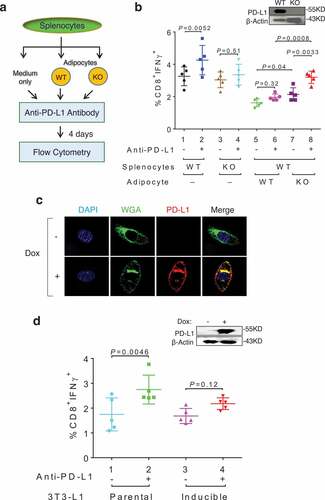
Previously published studies showed that anti-PD-L1 antibody boosts the abundance of IFNγ-expressing CD8+ T cells in vitro.Citation6,Citation39,Citation40 We made a similar observation when incubating total splenocytes isolated from wild-type (WT), but not PD-L1 knockout (KO) mice with anti-PD-L1 antibody (; compare lanes 1–2 and 3–4 in ), thus demonstrating antibody specificity. However, co-culture of WT splenocytes with WT adipocytes significantly dampened the anti-PD-L1 antibody effect on CD8+IFNγ+ T cells (compare lanes 1–2 and 5–6 in ). In contrast, the antibody effect was largely preserved when WT splenocytes were co-cultured with PD-L1 KO adipocytes (compare lanes 5–6 and 7–8 in ), suggesting that adipose PD-L1 interferes with the action of anti-PD-L1 antibody in boosting important antitumor functions of CD8+ T cells. Adipose PD-L1 also interferes with the function of anti-PD-L1 antibody in boosting CD4+IFNγ+ T cells (Supplementary Figure 3). To determine whether adipose PD-L1 expression alone is sufficient for interfering with anti-PD-L1 antibody effects, we engineered a doxycycline (Dox)-inducible PD-L1 expression system in 3T3-L1 preadipocytes, which resulted in predominantly membrane-localized ectopic PD-L1 upon Dox induction (). Using the same co-culture system, we found that the DOX-induced ectopic PD-L1 expression diminished the antibody-mediated stimulation of CD8+IFNγ+ T cells (compare lanes 1–2 and 3–4 in ). Collectively, these in vitro results support the notion that adipose PD-L1 blunts the activity of anti-PD-L1 antibody.
Figure 3. Adipose PD-L1 attenuates anti-PD-L1 antibody effect in vitro. (a) Flow chart of the coculture assay. (b) Percentage of IFNγ+ T cells in CD8+ cells following co-culturing of total splenocytes, anti-PD-L1 antibody, and adipocytes. (c) Immunofluorescent staining of PD-L1 (red), WGA (green) and DAPI (Blue) in doxycycline (Dox, 1μg/ml) treated PD-L1-inducible 3T3-L1 cells. (d) Percentage of IFNγ+ T cells in CD8+ cells following co-culturing of total splenocytes, anti-PD-L1 antibody, and preadipocytes. Dox was included in all co-culture wells throughout the experiment. Induced ectopic PD-L1 in 3T3-L1 derivative cells is shown in the inlet. Data expressed as mean ± SD
Pharmacologic inhibition of PPARγ selectively reduces adipose PD-L1 expression in vitro and in vivo
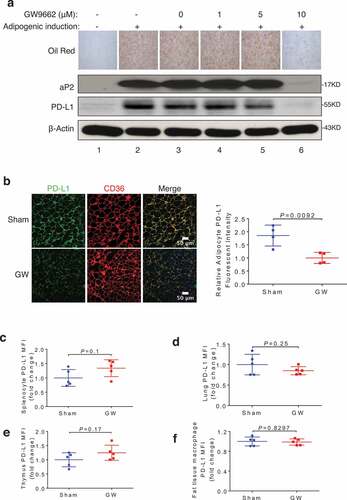
Nuclear receptor PPARγ is a key transcription factor that promotes adipogenesis.Citation41,Citation42 To modulate adipose PD-L1 levels, we treated 10T1/2 cells with a PPARγ antagonist GW9662 during adipogenesis. Consistent with published studies,Citation43–Citation45 GW9662 inhibited adipogenesis as measured by oil red O staining and aP2 immunoblotting (). The same PPARγ antagonist treatment also resulted in marked reduction of adipose PD-L1 protein (). To assess in vivo effects, we treated WT C57BL/6 mice with GW9662 and determined cell-surface PD-L1 levels in primary adipocytes of vehicle- and antagonist-treated mice by immunostaining. GW9662 treatment significantly reduced primary adipocytes PD-L1 (). Of note, the same GW9662-treated mice did not exhibit reduced PD-L1 levels in other PD-L1-expressing cells/tissues including splenocytes (), lung (), thymus () or macrophages (). These data support a tissue- and cell type-selective inhibition of PD-L1 expression by this PPARγ antagonist.
Figure 4. PPARγ antagonist GW9662 represses adipose PD-L1 expression. (a) Oil Red O staining and Western blotting of aP2, PD-L1, and β-actin in 3T3-L1 during adipogenesis, with or without GW9662 treatment. (b) Representative PD-L1 immunofluorescent staining of subcutaneous WAT from DMSO- and GW9662-treated mice (left). Fold change (normalized to vehicle-treated group) of fluorescence intensity of PD-L1 is shown on the right. (c-f) Fold changes of mean fluorescence intensity (MFI) from specific cells types isolated from either sham (vehicle) or GW9662-treated mice are shown for splenocytes (c), lung cells (d), thymus cells (e), fat tissue macrophages (CD45+ CD3-CD11b+ F4/80+) (f). Values represent mean ± SD. N = 5 per group
GW9662 boosts checkpoint blockade immunotherapy for distinct breast cancers
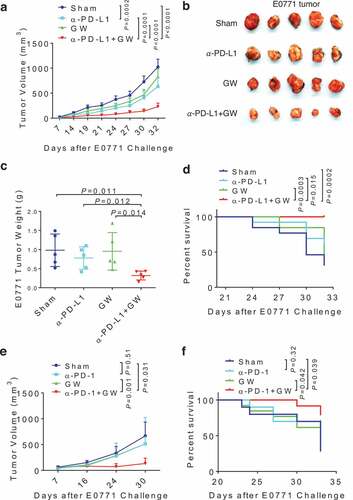
Given the interference of anti-PD-L1 antibody by adipose PD-L1 in vitro and the adipocyte-specific inhibition of PD-L1 expression by GW9662 in vivo, we hypothesized that pharmacologic inhibition of its expression in adipocytes by GW9662 could enhance the antitumor efficacy of anti-PD-L1 antibody in vivo. To this end, we used 4 treatment cohorts after challenge with E0771 mammary tumor in syngeneic female host mice: (1) vehicle + anti-IgG (sham), (2) vehicle + anti-PD-L1, (3) GW9662 + anti-IgG, and (4) GW6992 + anti-PD-L1. Compared to sham and single treatment groups, combination treatment resulted in slower tumor growth (), lower end-point tumor size/weight (-c), and better host survival (). The enhanced antitumor efficacy of the combination treatment was also demonstrated in another syngeneic mammary tumor model characteristic of basal/triple negative breast cancer phenotype (AT-3, Supplementary Figure 4). GW6992 also boosted anti-PD-1 treatment efficacy against E0771 tumor cells () and host survival (). Based on these findings, we conclude that GW6992 is capable of enhancing anti-PD-1 and anti-PD-L1 checkpoint blockade cancer immunotherapies. The ability to improve efficacy against breast cancers that are generally refractory to such immunotherapies is especially notable.
Figure 5. GW9662 boosts anti-PD-L1/PD-1 antibody efficacy in vivo. (a-d) Tumor study with treatment of GW9662 and anti-PD-L1. E0771 mammary tumor growth curve (a), representative tumor image (b) and tumor weight (c) upon harvest. Survival curve is shown in (d). Treatments are as follow. Sham: vehicle + anti-IgG (n = 13), vehicle + anti-PD-L1 (n = 13), GW + anti-IgG (n = 13) and anti-PD-L1 + GW (n = 13). (e-f) Tumor study with treatment of GW9662 and anti-PD-1. E0771 mammary tumor growth (e) and survival (f). Sham: vehicle + anti-IgG (n = 4), vehicle + anti-PD-1 (n = 4), GW + anti-IgG (n = 5) and anti-PD-1 + GW (n = 4). Data are mean± SEM. P values for the tumor growth curve in (a) indicate the statistics for the last measurement time point. P values for the survival analysis in (d) test the null hypothesis that the indicated two survival curves are identical
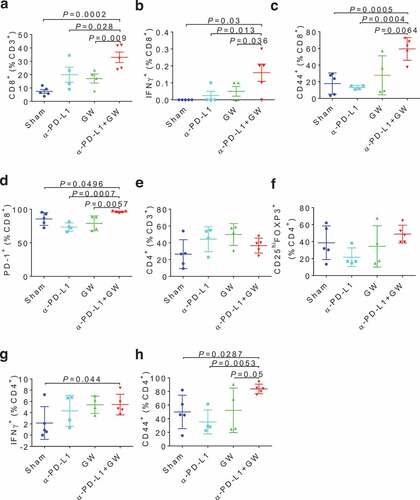
To gain more insight into the in vivo antitumor effect of GW9662, we analyzed tumor-infiltrating lymphocyte (TIL) populations from E0771 mammary tumor-bearing mice under various treatments. The combination treatment group elicited a significant increase over the control and single-agent treatment groups in the abundance of total CD8+ T cells () and CD8+ T cells expressing IFNγ (), CD44 (), or PD-1 (). Neither total CD4+ T cells () nor CD25hiFOXP3+ regulatory T cells () were affected significantly by the combination treatment. However, abundance of CD4+ T cells expressing IFNγ () or CD44 () was significantly elevated in the combination treatment group versus the sham (vehicle + anti-IgG) treatment group. Taken together, these data strongly suggest that GW9662 enhances checkpoint blockade cancer immunotherapy by augmenting antitumor T cell functions.
Figure 6. GW9662 boosts anti-tumor immunity in E0771 TILs. Immunophenotyping of various tumor infiltrating lymphocytes (TILs) after treatments: (a) Total CD8+ cells, and in the CD8+ gate: (b) IFNγ+, (c) CD44+, (d) PD-1+, (e) CD4+ in CD3+, and in CD4+ gate: (f) CD25+FOXP3+, (g) IFNγ+, (h) CD44+, Sham: vehicle + anti-IgG (n = 5); α–PD-L1: vehicle + anti-PD-L1 (n = 4); GW: GW9662 + anti-IgG (n = 4); α–PD-L1 + GW: anti-PD-L1 + GW9662 (n = 5). Data are mean ± SD
Discussion
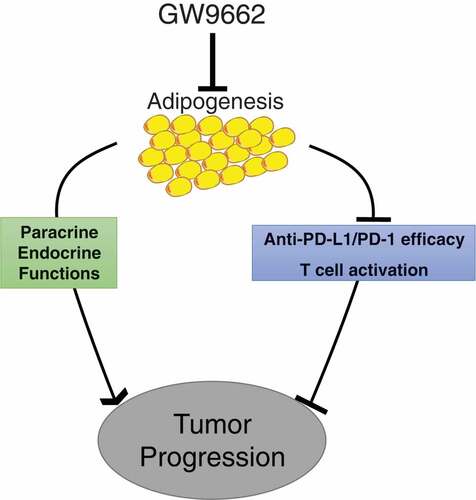
Despite the dramatic clinical response of certain cancer types to PD-1/PD-L1-targeting immunotherapies, the exact mechanisms by which the blocking antibodies work remain to be fully understood. Supported by correlative data from early clinical trials, tumor PD-L1 expression was identified as an important, but incomplete determinant for the therapeutic responsiveness of anti-PD-L1 or anti-PD-1 immunotherapy.Citation46 However, more recent preclinical and clinical studies indicate that host cell-derived PD-L1, in particular that produced by dendritic cells and macrophages, could also contribute to PD-1/PD-L1 pathway-targeting immuno-checkpoint blockade.Citation47–Citation53 Our current studies strongly implicate adipose PD-L1 expression, which is tightly associated with adipogenic differentiation, in therapeutic efficacy of these immunotherapy antibodies. This adipocyte PD-L1-dependent immunomodulatory activity represents a previously unrecognized role of adipose tissue in cancer immunopathogenesis (), in addition to a variety of well-documented endocrine and paracrine mechanisms by which adiposity promotes cancer progression.Citation22,Citation54,Citation55 Given the unique adipocyte-rich tumor microenvironment in breast cancer, our findings provide a reasonable explanation for low clinical response of breast cancer to the current checkpoint blockade immunotherapies. Overcoming this immunomodulatory activity of adipocyte PD-L1 promises to boost efficacy of PD-1/PD-L1 pathway-targeting antibodies in clinical settings.
Figure 7. Model for effects of adipogenesis on antitumor immunity
The exact mechanisms by which adipose PD-L1 interferes with the action of anti-PD-L1 antibody in vivo warrant further studies. Adipocyte PD-L1 could bind to and sequester anti-PD-L1 antibody from tumor or immune cell PD-L1. This possibility is consistent with our in vitro finding that co-cultured adipocytes antagonize activation of CD8+ T cells by anti-PD-L1 antibody in a PD-L1-dependent manner. In an alternative scenario, adipocyte PD-L1 could directly interact with T cell PD-1 to weaken T cell function in a similar fashion as does tumor PD-L1. Consistent with this model, our in vitro co-culture experiment indicates that adipocytes dampen IFNγ production by CD8+ T cells and that this effect is largely dependent on adipose PD-L1. Yet a third possibility relates to the recently reported function of cytoplasmic PD-L1 in tumor progression.Citation56 While adipocyte PD-L1 is prominently present on the cell surface, we also observe a sub-population of internally localized endogenous PD-L1 in adipocytes and ectopic PD-L1 in our inducible 3T3L1 cell system. This internal pool of PD-L1 could influence antitumor immunity via a signaling pathway independent of the conventional mechanism involving cell surface PD-L1/PD-1. These models are not mutually exclusive and await more in-depth mechanistic interrogation.
Another clinically relevant question concerns the impact of obesity on patient outcome and therapeutic response. Obesity paradox refers to the well-observed observation in which moderately elevated body mass index (BMI) appears to be associated with better outcome for patients who undergo cancer treatments, whereas the protective trend is reversed when BMI reaches morbid obesity.Citation57 Even more perplexing is the recent report that increasing BMI in male melanoma patients correlates with improved response to immunotherapy, regardless of the extent of obesity.Citation58 The biological basis for this intriguing clinical observation is not clear, nor is it known whether the protective effect of obesity is specific to melanoma. However, it is worth noting that many obese male melanoma patients in this clinical study received anti-diabetic drugs,Citation58 which have been shown to enhance the antitumor activity of anti-PD-1 blockade in preclinical melanoma models.Citation59,Citation60
A recent imaging-based study identified mouse brown adipose tissue (BAT), not WAT, as a significant source of PD-L1.Citation61,Citation62 We therefore compared PD-L1 protein levels in mouse BAT versus WAT and found that PD-L1 levels in BAT are indeed significantly higher than those in WAT (Supplementary Figure 5). However, given the far more abundance of total WAT over BAT in adult mice, WAT at the organismal level is still likely to be a significant and functionally relevant source of this immune checkpoint protein.
The exact cis-acting regulatory elements that confers activation of PD-L1 expression following adipogenesis remains to be characterized. In this regard, we surveyed published ChIP-seq data for enhancer-binding proteins preadipcoytes before and after adipose differentiation in vitro. MED1 is a transcription mediator protein frequently associated with transcriptional enhancers.Citation63 Two clusters of MED1 ChIP-seq are observed around the Cd274/Pd-l1 locus after, but not before, differentiation (Clusters 1 and 2; Supplementary Figure 6). Cluster 1 is located in the first intronic region of the Cd274/Pd-l1 locus, and Cluster 2 in an intergenic region downstream of the gene. Of note, both MED1 clusters coincide with binding peaks for PPARγ and C/EBPβ, two master transcriptional regulators of adipogenesis.Citation64 Future work will be aimed at validating the functional role of these and other genomic regions in adipogenesis-induced Cd274/Pd-l1 transcription.
PPARγ has been implicated in both promoting tumor-intrinsic function and modulating antitumor immunity.Citation65 Indeed, several PPARγ antagonists including GW9662 exert antitumor activity in various preclinical models.Citation66 Given that PPARγ is expressed in tumor and other host tissue/cell types besides adipocytes, reduction of adipocyte PD-L1 may not be the sole underlying mechanism by which GW9662 boosts the therapeutic efficacy of these checkpoint blockade antibodies. While we cannot exclude a potential effect of systemic GW9662 on tumor and/or immune cells, GW9662 inhibits adipocyte PD-L1 expression without affecting its expression in other cell types examined. It is also worth noting that, although GW9662 is highly selective for PPARγ over other PPAR family members (e.g., PPARα and PPARδ),Citation67, the drug effect we observed in our study could be compounded by a possible effect of GW9662 on other PPAR family members. Future exploration of more potent and selective PPARγ antagonists and other small-molecule compounds that specifically target adipose PD-L1 expression promises to inform development of new therapeutic approaches to boost the current checkpoint blockade cancer immunotherapies.
Materials and methods
Plasmid construction
Mouse Cd274/Pd-l1 coding sequence was amplified using primers as follow: mPD-L1-F: AGACTACCGGTCGCCACCATGAGGATATTTGCTGGCATTATATTCACAG; mPD-L1-R: CATGTGTCACGCGTTTACGTCTCCTCGAATTGTGTATCATTTCG. The cDNA was cloned through the AgeI and MluI sites in the pINDUCER11 vector containing a constitutive EGFP expression cassette and a tetracycline response element as previously described.Citation52 For construction of the pGL3-Cd274 promoter and pmirGLO-Cd274 3’UTR vectors, the following primers were used to amplify the 1kb promoter and 500 bp 3’UTR sequence of Cd274 gene, respectively: Cd274 promoter-F: GCGACGCGTGTTTCATTATGTCGAGGAACTTTGA; Cd274 promoter-R: ACGCGTCGACCTGGTCTTATCTCGAGTTCAGAGCC; Cd274 3’UTR-F: CCGCTCGAGGAAGGAGCCCATTAGCTCTGTGT; Cd274 3’UTR-R: ACGCGTCGACAATAAATAAAAATATTTATTAAATTAATGC. Amplified promoter sequence was inserted into pGL3 vector through the SalI and MluI sites. Amplified 3’UTR sequence was inserted into the pmirGLO vector through Xho and SalI sites. All resulting vectors were verified by sequencing.
Cell culture and reagents
To generate inducible PD-L1-expressing 3T3-L1 cells, HEK293 cells were transfected with the PD-L1 expression plasmid and two packaging plasmids psPAX2 and pMD2.G using Lipofectamine 2000 (Life Technologies, Cat: #11668027) in Opti-MEM I media (Life Technologies, Cat: #31985–062). After 48 h, parental 3T3-L1 cells were infected with PD-L1-expressing lentivirus and polybrene (5 μg/ml). Infected cells were sorted on a BD FACSAria II Flow Cytometer (BD Biosciences) for GFP positive cells.
Mouse CH3/10T1/2 (10T1/2), 3T3-L1 and B16-F10 melanoma (B16) were purchased from ATCC. 3T3-F442A was purchased from Kerafast. All cells were cultured in high glucose DMEM (Thermo Fisher Scientific; Cat: #11965) supplemented with 10% fetal bovine serum (FBS), 100 μg/ml penicillin and 100 μg/ml streptomycin (P/S, Thermo Fisher Scientific, Cat: #15140122). For in vitro experiments, GW9662 (Sigma, Cat: #M6191) was added to fresh medium at the indicated concentrations during the adipogenesis. PD-L1 was knock out in B16 cells using Cd274 sgRNA CRISPR/Cas9 All-in-One Lentivector set (Mouse) (ABM; Cat: #K4385405) following the manufacturer’s instruction. For luciferase reporter assay, 3T3-L1 and B16 cells were treated with IFNγ (R&D Systems) at 0.5 ng/ ml overnight.
In vitro co-culture and anti-PD-L1 treatment
Total splenocytes were isolated from age-matched wildtype and PD-L1 syngeneic KO mice. Briefly, spleens were ground and washed with RPMI-1640 medium (containing 10% FBS and 1% P/S) and passed through 70 μm cell strainers to obtain single-cell suspensions. Red blood cells were removed by Red Blood Cell Lysing Buffer (Sigma, Cat: #R7757) following the manufacturer’s instructions. Adipocytes were isolated following published protocols.Citation68 Briefly, fat tissue was digested for 40 min in DMEM/F12 (Stem Cell Technologies, Cat: # 36254) containing 10% Collagenase/Hyaluronidase solution (Stem Cell Technologies, Cat: #07912), 1% P/S and 2% FBS. Debris was removed by 70 μm cell strainers, and then centrifuged at 1,000 g for 10 min. Red blood cells were lysed by Red Blood Cell Lysing Buffer as describe above and resuspended in CR10 medium (RPMI-1640 with 10% FBS, L-glutamine, sodium pyruvate, non-essential amino acids, penicillin/streptomycin, and HEPES buffer).
For co-culture experiments, U-bottom 96 well plates were pre-coated with 10 μg/ml anti-CD3e (clone 2C11) overnight at 4°C and subsequently washed with sterile PBS twice prior to cell seeding. Splenocytes and wild-type or PD-L1 KO adipocytes were seeded at ratio of 1:1 with 4 μg/ml anti-CD28 antibody and 10 μg/ml anti-PD-L1 or anti-IgG2b antibody. After 4 days of co-culture, cells were examined by flow cytometry. For co-culture of splenocytes and 3T3-L1 cells, splenocytes and PD-L1 inducible 3T3-L1 or parental 3T3-L1 cells were seeded on anti-CD3e-coated plates at ratio of 10:1 with 4 μg/ml anti-CD28 antibody (clone 37.51), 1 μg/ml doxycycline and 10 μg/ml anti-PD-L1 or anti-IgG2b antibody. After overnight co-culture, cells were examined by flow cytometry.
Mice tumor challenge and treatments
Wild type C57BL/6J mice (Cat: #000664) were purchased from Jackson laboratory. For tumor studies, 8 to 10-week-old mice were used. PD-L1 knockout (KO) mice were a generous gift from Dr. Lieping Chen.Citation69 E0771Citation70 and AT-3Citation71 tumor cells were subcutaneously inoculated into the fourth mammary pad using 5 × 10⁵ and 2x10⁵, respectively. B16 tumor cells were subcutaneously inoculated into mouse back flank at 5 × 10⁵. Tumor volumes were measured with calipers (0.5 × length × width2) at indicated days. Survival was determined by tumor size ≥1000 mm3 or animal death or distress. Anti-IgG2b (BioXcell, Cat: #BE0101) and anti-PD-L1 (BioXcell, Cat: #BE0090) antibodies were administered through intraperitoneal (i.p.) injection at 10 mg/kg. Anti-IgG2a (BioXcell, Cat: #BE0146) and anti-PD-1 (BioXcell, Cat: #BE0089) antibodies were administered through i.p. injection at 5 mg/kg. All antibodies were given twice per week. GW9662 (Sigma, Cat: #M6191) was intraperitoneally (i.p.) injected daily at 1 mg/kg beginning 14 days prior to tumor challenge and continuing throughout the entire tumor growth period. All animal-related procedures were approved by the Institutional Animal Care and Use Committee (IACUC) at the University of Texas Health Science Center at San Antonio.
Human adipose tissue procurement
Cancer-free breast tissue was procured from women undergoing cosmetic reduction mammoplasty, following protocols approved by the Institutional Review Board at the University of Texas Health Science Center at San Antonio. Written consent forms were signed by all donors prior to tissue procurement.
Flow cytometry
Cells were stained with fixable, viability live/dead Ghost Dye™ Violet 450 (Cat: # 13–0863-T100, Tonbo Biosciences) in 1x PBS for 30 min at 4°C in the dark, after which they were thoroughly washed once with 1x PBS. Non-specific antibody binding was blocked using anti-CD16/32 antibody at 1:200 dilution (clone 2.4G2, Cat: #70–0161-U100, Tonbo Biosciences). Surface staining was done at 4°C for 30–45 min in dark for CD45 (FITC, clone 30-F11, Cat: #103108, BioLegend), CD3 (redFluor710TM, clone 17-A2, Cat: #80–0032-U100, Tonbo Biosciences), CD4 (Brilliant Violet 605TM, clone RM4-5, Cat; #100548, BioLegend), CD8 (APC-CyTM7, clone 53–6.7, Cat: #557654, BD Biosciences), CD44 (Brilliant Violet 785TM, clone IM7, Cat: #103041, BioLegend), PD-1 (APC, clone 29F.1A12, Cat: 135210, BioLegend), CD25 (Per-CP/Cy5.5, clone PC61, Cat: #102030, BioLegend), CD11b (PerCP-CyTM5.5, clone M1/70, Cat: 550993, BD Biosciences), F4/80 (FITC, clone BM8, Cat: 11-4801-85, eBioscience), and PD-L1 (Brilliant Violet 421TM, clone 10F.9G2, Cat: #124315, BioLegend). Following surface staining, cells were fixed and permeabilized with the FoxP3/transcription factor staining buffer kit (Cat: #00–5523-00, eBioscienceTM) according to manufacturer instructions, and stained for FoxP3 (FITC, clone FJK16s, Cat: #11–5773-82, eBioscienceTM). To detect intracellular IFN-γ, a 24-well plate was coated with 5 µg/ml anti-CD3e antibody in 1x PBS at 37°C for 2 h. Wells were washed with 1x PBS and 4 × 10⁶ cells were suspended in 2 ml medium containing 1 µg/ml anti-CD28 mAb, and incubated at 37ºC for 12 h. Cells were then incubated with 2 µL leukocyte activation cocktail, with BD GolgiPlug™ (Cat: 550583, BD Biosciences) per ml CR10 medium for 5 h at 37ºC. Cells were permeabilized and stained with anti-IFN-γ (PE/Cy7, clone XMG1.2, Cat: #505826, BioLegend). To detect GW9662 effect on PD-L1 expression in vivo, various tissues and cells as indicated were harvested from either DMSO or GW9662-treated E0771 tumor bearing mice after 30 days of tumor growth. Single cell tissue suspensions were generated as described above and stained with live/dead Ghost Dye™ (Tonbo Biosciences). Cells and were stained with anti-PD-L1 antibody after anti-CD16/32 blockade. Relevant controls were fluorescence minus one, single color staining or isotype controls (BioLegend). Data was acquired on BD LSRII and BD FACSCelesta flow cytometers and analyzed using FACSDiva or FlowJo software (BD Bioscience).
RNA isolation and quantitative PCR
Total RNA was extracted and quantitative PCR (qPCR) was set up with the Luminaris Color High Green High ROX qPCR Master mix all as described,Citation72 using an Applied Biosystems 7900HT workstation with SDS 2.4 software. These primer sequences used for RT-qPCR were designed by Primer-3 software (Sigma Aldrich). The sequences of primers are as follows.: PD-L1-F (forward): AGTATGGCAGCAACGTCACG; PD-L1-R (reverse): TCCTTTTCCCAGTACACCACTA; β-Actin-F: CAACGAGCGGTTCCGATG; β-Actin-R: GCCACAGGATTCCATACCCA
Immunoblotting
Cultured or primary cells were lysed in Laemmli sample buffer. Protein amounts were determined by using Pierce BCA Protein Assay Kits (Pierce, Cat: #23225). Primary antibodies were against mouse PD-L1 goat mAb (R&D Systems, Cat: # AF1019), human PD-L1 rabbit mAb (Cell Signaling Technology, Cat: # 13684S), aP2 (R&D Systems, Cat: # AF1443), GAPDH (Cell signaling, Cat: #2118), β-actin (Cell signaling, Cat: #4967). Corresponding secondary antibodies were used and protein was detected with ECL SuperSignalTM West Pico PLUS Chemiluminescent Substrate (Thermo Fisher, Cat. #34580).
SiRNA transfection
PD-L1 knockdown by siRNA oligonucleotides in post-differentiated adipocytes was as previously described,Citation52 using Lipofectamine reagent RNAiMAX (Invitrogen). Control siOTP (ON-TARGETplus Non-Targeting Pool, Cat: #D-001810–10) and siPD-L1 (SMARTpool: ON-TARGETplus Cd274 siRNA, Cat: #M-040760) were purchased from Dharmacon, Inc (USA). Samples were harvested 48 h after transfection and analyzed by Western blotting.
Adipose differentiation and Oil Red O staining
Two days after reaching full confluency, cells were incubated with adipogenic medium (0.5 mM 3-isobutyl-1-methylxanthine, 1 μM dexamethasone, 5 μg/mL insulin and 100 μM indomethacin) in 10% FBS/DMEM medium. Three days after induction, cells were switched to insulin-containing medium (10% FBS/DMEM medium with 5 μg/mL insulin), which was changed every 2-3 days for approximately 8 days, at which time cells were fully differentiated. Differentiated cells were rinsed twice with 1x PBS, and fixed with 4% formalin for 20 min at room temperature. Cells were washed with 1x PBS and stained with filtered oil red O (Sigma, Saint Louis, MO, USA) for 1 h, followed by rinsing twice in water. Stained cells were visualized by light microscopy (Nikon).
Luciferase assay
Transient transfection was performed using Lipofectamine 2000 (Invitrogen). For promoter study, B16, pre- or post-differentiated 3T3-L1 cells grown in 24-well plates were co-transfected with 0.1 μg of pGL3 basic empty control plasmid (Promega, Cat: #E1751) or pGL3-Cd274 promoter construct and 0.02 μg of the Renilla luciferase construct (Promega, Cat: #E6911, for normalization of transfection efficiency). For 3’UTR study, pmirGLO (Promega, Cat: #E1330) or pmirGLO-Cd274 3’UTR vector were transfected into pre- or post-differentiated 10T1/2 cells. Luciferase activity was detected by Promega dual-luciferase reporter assay system (Promega, Cat: # E1910).
Immunostaining
10T1/2 or 3T3-L1 cells were seeded on glass coverslips placed in 24-well plates. Cells were washed twice with PBS, fixed with 4% paraformaldehyde for 20 min, permeabilized with 0.3% Triton X-100 for 15 min. Samples were then blocked with 2% bovine serum albumin in PBS and incubated with anti-PD-L1 antibody (R&D Systems, Cat: #AF1019) and secondary antibody (ThermoFisher, Cat: #A-21085) sequentially. Plasma membrane was stained with wheat germ agglutinin (WGA) (ThermoFisher, Cat: #W11261). Slides were washed and mounted with coverslips using Vectashield mounting medium with DAPI.
For PD-L1 immunofluorescence in adipose tissue, subcutaneous white adipose tissue was harvested from mice after 1 month of DMSO or GW9662 treatment. Adipose tissue was fixed with formalin for overnight at 4 ºC. Paraffin-embedded adipose tissue was then cut into 4-μm sections for staining. Slides were deparaffinized, rehydrated and boiled with antigen-unmasking solution. After washed with PBS, slides were blocked by rat serum and incubated with anti-PD-L1 (R&D Systems, Cat: #AF1019) and anti-CD36 (ThermoFisher, Cat: #PA1-16813) for overnight at 4 ºC. Slides were then washed with PBS and incubated with donkey anti-goat IgG (ThermoFisher, Cat: #A11055) and donkey anti-rabbit IgG (ThermoFisher, Cat: #A10040) at room temperature for 2 hours. Slides were then mounted with Vectasheild mounting media with DAPI (Vector labs, H-1200), sealed with nail polish, and examined by Zeiss LSM710 Microscopy. PD-L1 fluorescence intensity was quantified by Image J software (https://imagej.nih.gov/ij/).
Statistics
For mean difference comparison from two groups, unpaired student t-test was used. For mean differences comparison from multiple groups, one-way ANOVA followed by multiple comparison was used. Tumor growth curves were examined through two-way ANOVA. Log-rank (Mantel-Cox) tests were used to analyze the survival curves. All the statistics were conducted on Graphpad Prism software. Data in bar and dot graphs are means ± SD. P < 0.05 was considered significant.
Disclosure of Potential Conflicts of Interest
The authors declare that they have no conflict of interest.
Author contributions
RL and TJC conceived and supervised the project. RL, TJC, BW, XS and HG designed the experiments. BW, XS, HBG, BY, JL, FG, HCC, XZ, CZ, DZ, and JY performed the experiments. RL, TJC, YH, BW, XS, and HBG analyzed the data. RL, TJC, BW, XS, and HBG wrote the manuscript.
Supplemental Material
Download PDF (385.6 KB)Acknowledgments
We thank Dr. Lieping Chen for the PD-L1 KO mouse strain, Drs. Haihui Pan, Reka Chakravarthy, Suresh Kari, Leilei Qi, Li-Ling Lin, Ms. Jie Liu, Ms. Karla M. Gorena, and Ms. Sabrina Smith for technical assistance. The work was supported by grants to RL from NIH (CA206529 and DK115219), CPRIT (RP150055), and the Tom C. & H. Frost Endowment; to YH from NIH (CA212674), DOD (W81XWH-17-1-0007), and the Cancer Prevention and Research Institute of Texas (CPRIT, RP170126); to TJC from NIH (CA205965) and the Owens and Barker Foundations and the Skinner Endowment; to BY from an CPRIT Postdoctoral Training Grant (RP170345); and to HCC from an NIH Postdoctoral Training Grant (T32CA148724). We also thank generous support from the University of Texas Health San Antonio Cancer Center (CA054174).
Financial Disclosure Statement
The authors declare that they have no financial disclosure.
Supplemental data for this article can be accessed here.
Additional information
Funding
Related Research Data
References
- Sharma P, Allison JP. The future of immune checkpoint therapy. Science. 2015;348:56–61. doi:10.1126/science.aaa8172.
- Freeman GJ, Long AJ, Iwai Y, Bourque K, Chernova T, Nishimura H, Fitz LJ, Malenkovich N, Okazaki T, Byrne MC. Engagement of the PD-1 immunoinhibitory receptor by a novel B7 family member leads to negative regulation of lymphocyte activation. J Exp Med. 2000;192:1027–1034.
- Dong H, Strome SE, Salomao DR, Tamura H, Hirano F, Flies DB, Roche PC, Lu J, Zhu G, Tamada K. Tumor-associated B7-H1 promotes T-cell apoptosis: a potential mechanism of immune evasion. Nat Med. 2002;8:793. doi:10.1038/nm730.
- Baumeister SH, Freeman GJ, Dranoff G, Sharpe AH. Coinhibitory pathways in immunotherapy for cancer. Annu Rev Immunol. 2016;34:539–573. doi:10.1146/annurev-immunol-032414-112049.
- Lau J, Cheung J, Navarro A, Lianoglou S, Haley B, Totpal K, Sanders L, Koeppen H, Caplazi P, McBride J, et al. Tumour and host cell PD-L1 is required to mediate suppression of anti-tumour immunity in mice. Nat Commun. 2017;8:14572. doi:10.1038/ncomms14572.
- Tang H, Liang Y, Anders RA, Taube JM, Qiu X, Mulgaonkar A, Liu X, Harrington SM, Guo J, Xin Y, et al. PD-L1 on host cells is essential for PD-L1 blockade-mediated tumor regression. J Clin Invest. 2018;128:580–588. doi:10.1172/JCI96061.
- Lin H, Wei S, Hurt EM, Green MD, Zhao L, Vatan L, Szeliga W, Herbst R, Harms PW, Fecher LA, et al. Host expression of PD-L1 determines efficacy of PD-L1 pathway blockade-mediated tumor regression. J Clin Invest. 2018;128:805–815. doi:10.1172/JCI96113.
- Mellman I, Coukos G, Dranoff G. Cancer immunotherapy comes of age. Nature. 2011;480:480–489. doi:10.1038/nature10673.
- Kaufman HL, Kirkwood JM, Hodi FS, Agarwala S, Amatruda T, Bines SD, Clark JI, Curti B, Ernstoff MS, Gajewski T, et al. The Society for Immunotherapy of Cancer consensus statement on tumour immunotherapy for the treatment of cutaneous melanoma. Nat Rev Clin Oncol. 2013;10:588–598. doi:10.1038/nrclinonc.2013.153.
- Brower V. Checkpoint blockade immunotherapy for cancer comes of age. J Natl Cancer Inst. 2015;107:2–4.
- Topalian SL, Drake CG, Pardoll DM. Immune checkpoint blockade: a common denominator approach to cancer therapy. Cancer Cell. 2015;27:450–461. doi:10.1016/j.ccell.2015.03.001.
- Hodi FS, O’Day SJ, McDermott DF, Weber RW, Sosman JA, Haanen JB, Gonzalez R, Robert C, Schadendorf D, Hassel JC, et al. Improved survival with ipilimumab in patients with metastatic melanoma. N Engl J Med. 2010;363:711–723. doi:10.1056/NEJMoa1003466.
- Wolchok JD, Kluger H, Callahan MK, Postow MA, Rizvi NA, Lesokhin AM, Segal NH, Ariyan CE, Gordon RA, Reed K, et al. Nivolumab plus ipilimumab in advanced melanoma. N Engl J Med. 2013;369:122–133. doi:10.1056/NEJMoa1302369.
- Topalian SL, Sznol M, McDermott DF, Kluger HM, Carvajal RD, Sharfman WH, Brahmer JR, Lawrence DP, Atkins MB, Powderly JD, et al. Survival, durable tumor remission, and long-term safety in patients with advanced melanoma receiving nivolumab. J Clin Oncol. 2014;32:1020–1030. doi:10.1200/JCO.2013.53.0105.
- Nanda R, Chow LQ, Dees EC, Berger R, Gupta S, Geva R, Pusztai L, Pathiraja K, Aktan G, Cheng JD, et al. Pembrolizumab in patients with advanced triple-negative breast cancer: phase Ib KEYNOTE-012 study. J Clin Oncol. 2016;34:2460–2467. doi:10.1200/JCO.2015.64.8931.
- Emens LA, Braiteh FS, Cassier P. Inhibition of PD-L1 by MPDL3280A leads to clinical activity in patients with metastatic triple-negative breast cancer (TNBC). The American Association for Cancer Research Annual Meeting 2015; Philadelphia, PA. Abstract 2859.
- Dirix LY, Takacs I, Nikolinakos P. Avelumab (MSB0010718C), an anti-PD-L1 antibody, in patients with locally advanced or metastatic breast cancer: A phase Ib JAVELIN solid tumor trial. 2015 San Antonio Breast Cancer Symposium 2015; Abstract S1-04. doi:10.1158/1538-7445.SABCS15-S1-04
- Rugo HS, Delord J-P, Im S-A. Preliminary efficacy and safety of pembrolizumab (MK-3475) in patients with PD-L1–positive, estrogen receptor-positive (ER+)/HER2-negative advanced breast cancer enrolled in KEYNOTE-028. 2015 San Antonio Breast Cancer Symposium 2015; Abstract S5-07. doi:10.1158/1538-7445.SABCS15-S5-07
- Dawood S, Rugo HS. Targeting the host immune system: PD-1 and PD-L1 antibodies and breast cancer. Curr Opin Support Palliat Care. 2016;10:336–342. doi:10.1097/SPC.0000000000000243.
- Dirat B, Bochet L, Escourrou G, Valet P, Muller C. Unraveling the obesity and breast cancer links: a role for cancer-associated adipocytes? Endocr Dev. 2010;19:45–52. doi:10.1159/000316896.
- Iyengar NM, Gucalp A, Dannenberg AJ, Hudis CA. Obesity and cancer mechanisms: tumor microenvironment and inflammation. J Clin Oncol. 2016;34:4270–4276. doi:10.1200/JCO.2016.67.4283.
- Olson OC, Quail DF, Joyce JA. Obesity and the tumor microenvironment. Science. 2017;358:1130–1131. doi:10.1126/science.aao5801.
- Lengyel E, Makowski L, DiGiovanni J, Kolonin MG. Cancer as a matter of fat: the crosstalk between adipose tissue and tumors. Trends Cancer. 2018. doi:10.1016/j.trecan.2018.03.004.
- Dyck L, Lynch L. Cancer, obesity and immunometabolism–connecting the dots. Cancer Lett. 2017;417:11–20.
- Aguilar EG, Murphy WJ. Obesity induced T cell dysfunction and implications for cancer immunotherapy. Curr Opin Immunol. 2018;51:181–186. doi:10.1016/j.coi.2018.03.012.
- Argolo DF, Hudis CA, Iyengar NM. The Impact of Obesity on Breast Cancer. Curr Oncol Rep. 2018;20:47. doi:10.1007/s11912-018-0688-8.
- Smith LA, O’Flanagan CH, Bowers LW, Allott EH, Hursting SD. Translating mechanism-based strategies to break the obesity− cancer link: a narrative review. J Acad Nutr Diet. 2018;118:652–667. doi:10.1016/j.jand.2017.08.112.
- Muller C. Tumour-surrounding adipocytes are active players in breast cancer progression. Ann Endocrinol (Paris). 2013;74:108–110. doi:10.1016/j.ando.2013.02.007.
- Bulun SE, Price TM, Aitken J, Mahendroo MS, Simpson ER. A link between breast cancer and local estrogen biosynthesis suggested by quantification of breast adipose tissue aromatase cytochrome P450 transcripts using competitive polymerase chain reaction after reverse transcription. J Clin Endocrinol Metab. 1993;77:1622–1628. doi:10.1210/jcem.77.6.8117355.
- Ghosh S, Ashcraft K, Jahid MJ, April C, Ghajar CM, Ruan J, Wang H, Foster M, Hughes DC, Ramirez AG, et al. Regulation of adipose oestrogen output by mechanical stress. Nat Commun. 2013;4:1821. doi:10.1038/ncomms2794.
- Zahid H, Simpson ER, Brown KA. Inflammation, dysregulated metabolism and aromatase in obesity and breast cancer. Curr Opin Pharmacol. 2016;31:90–96. doi:10.1016/j.coph.2016.11.003.
- Iyengar P, Combs TP, Shah SJ, Gouon-Evans V, Pollard JW, Albanese C, Flanagan L, Tenniswood MP, Guha C, Lisanti MP, et al. Adipocyte-secreted factors synergistically promote mammary tumorigenesis through induction of anti-apoptotic transcriptional programs and proto-oncogene stabilization. Oncogene. 2003;22:6408–6423. doi:10.1038/sj.onc.1206737.
- Nieman KM, Romero IL, Van Houten B, Lengyel E. Adipose tissue and adipocytes support tumorigenesis and metastasis. Biochim Biophys Acta. 2013;1831:1533–1541. doi:10.1016/j.bbalip.2013.02.010.
- Iyengar P, Espina V, Williams TW, Lin Y, Berry D, Jelicks LA, Lee H, Temple K, Graves R, Pollard J, et al. Adipocyte-derived collagen VI affects early mammary tumor progression in vivo, demonstrating a critical interaction in the tumor/stroma microenvironment. J Clin Invest. 2005;115:1163–1176. doi:10.1172/JCI23424.
- Picon-Ruiz M, Pan C, Drews-Elger K, Jang K, Besser AH, Zhao D, Morata-Tarifa C, Kim M, Ince TA, Azzam DJ, et al. Interactions between adipocytes and breast cancer cells stimulate cytokine production and drive Src/Sox2/miR-302b-mediated malignant progression. Cancer Res. 2016;76:491–504. doi:10.1158/0008-5472.CAN-15-0927.
- Wang YY, Attane C, Milhas D, Dirat B, Dauvillier S, Guerard A, Gilhodes J, Lazar I, Alet N, Laurent V, et al. Mammary adipocytes stimulate breast cancer invasion through metabolic remodeling of tumor cells. JCI Insight. 2017;2:e87489. doi:10.1172/jci.insight.88864.
- Incio J, Liu H, Suboj P, Chin SM, Chen IX, Pinter M, Ng MR, Nia HT, Grahovac J, Kao S, et al. Obesity-induced inflammation and desmoplasia promote pancreatic cancer progression and resistance to chemotherapy. Cancer Discov. 2016;6:852–869. doi:10.1158/2159-8290.CD-15-1177.
- Kolb R, Phan L, Borcherding N, Liu Y, Yuan F, Janowski AM, Xie Q, Markan KR, Li W, Potthoff MJ, et al. Obesity-associated NLRC4 inflammasome activation drives breast cancer progression. Nat Commun. 2016;7:13007. doi:10.1038/ncomms13007.
- Day CL, Kaufmann DE, Kiepiela P, Brown JA, Moodley ES, Reddy S, Mackey EW, Miller JD, Leslie AJ, DePierres C, et al. PD-1 expression on HIV-specific T cells is associated with T-cell exhaustion and disease progression. Nature. 2006;443:350–354. doi:10.1038/nature05115.
- Boni C, Fisicaro P, Valdatta C, Amadei B, Di Vincenzo P, Giuberti T, Laccabue D, Zerbini A, Cavalli A, Missale G, et al. Characterization of hepatitis B virus (HBV)-specific T-cell dysfunction in chronic HBV infection. J Virol. 2007;81:4215–4225. doi:10.1128/JVI.02844-06.
- Brun R, Spiegelman B. PPAR gamma and the molecular control of adipogenesis. J Endocrinol. 1997;155:217–218.
- Siersbæk R, Nielsen R, Mandrup S. PPARγ in adipocyte differentiation and metabolism–novel insights from genome‐wide studies. FEBS Lett. 2010;584:3242–3249. doi:10.1016/j.febslet.2010.06.010.
- Xiao Y, Yuan T, Yao W, Liao K. 3T3-L1 adipocyte apoptosis induced by thiazolidinediones is peroxisome proliferator-activated receptor-γ-dependent and mediated by the caspase-3-dependent apoptotic pathway. FEBS J. 2010;277:687–696. doi:10.1111/j.1742-4658.2009.07514.x.
- Jin Y, Han Y, Khadka DB, Zhao C, Lee KY, Cho W-J. Discovery of isoquinolinoquinazolinones as a novel class of potent pparγ antagonists with anti-adipogenic effects. Sci Rep. 2016;6:34661. doi:10.1038/srep34661.
- Li JJ, Wang R, Lama R, Wang X, Floyd ZE, Park EA, Liao -F-F. Ubiquitin ligase NEDD4 regulates PPARγ stability and adipocyte differentiation in 3T3-L1 cells. Sci Rep. 2016;6:38550. doi:10.1038/srep38550.
- Topalian SL, Taube JM, Anders RA, Pardoll DM. Mechanism-driven biomarkers to guide immune checkpoint blockade in cancer therapy. Nat Rev Cancer. 2016;16:275. doi:10.1038/nrc.2016.36.
- Lin H, Wei S, Hurt EM, Green MD, Zhao L, Vatan L, Szeliga W, Herbst R, Harms PW, Fecher LA. Host expression of PD-L1 determines efficacy of PD-L1 pathway blockade–mediated tumor regression. J Clin Invest. 2018;128:805–815.
- Tang H, Liang Y, Anders RA, Taube JM, Qiu X, Mulgaonkar A, Liu X, Harrington SM, Guo J, Xin Y. PD-L1 on host cells is essential for PD-L1 blockade–mediated tumor regression. J Clin Invest. 2018;128:580–588.
- Munn DH. The host protecting the tumor from the host—targeting PD‑L1 expressed by host cells. J Clin Invest. 2018. doi:10.1172/JCI99047.
- Curiel TJ, Wei S, Dong H, Alvarez X, Cheng P, Mottram P, Krzysiek R, Knutson KL, Daniel B, Zimmermann MC. Blockade of B7-H1 improves myeloid dendritic cell–mediated antitumor immunity. Nat Med. 2003;9:562. doi:10.1038/nm863.
- Sandner SE, Clarkson MR, Salama AD, Sanchez-Fueyo A, Domenig C, Habicht A, Najafian N, Yagita H, Azuma M, Turka LA. Role of the programmed death-1 pathway in regulation of alloimmune responses in vivo. J Immunol. 2005;174:3408–3415.
- Lau J, Cheung J, Navarro A, Lianoglou S, Haley B, Totpal K, Sanders L, Koeppen H, Caplazi P, McBride J. Tumour and host cell PD-L1 is required to mediate suppression of anti-tumour immunity in mice. Nat Commun. 2017;8:14572. doi:10.1038/ncomms14572.
- McDermott DF, Sosman JA, Sznol M, Massard C, Gordon MS, Hamid O, Powderly JD, Infante JR, Fassò M, Wang YV. Atezolizumab, an anti–programmed death-ligand 1 antibody, in metastatic renal cell carcinoma: long-term safety, clinical activity, and immune correlates from a phase Ia study. J Clin Oncol. 2016;34:833–842. doi:10.1200/JCO.2015.63.7421.
- Santander AM, Lopez-Ocejo O, Casas O, Agostini T, Sanchez L, Lamas-Basulto E, Carrio R, Cleary MP, Gonzalez-Perez RR, Torroella-Kouri M. Paracrine interactions between adipocytes and tumor cells recruit and modify macrophages to the mammary tumor microenvironment: the role of obesity and inflammation in breast adipose tissue. Cancers. 2015;7:143–178. doi:10.3390/cancers7010143.
- Vona-Davis L, Rose DP. Adipokines as endocrine, paracrine, and autocrine factors in breast cancer risk and progression. Endocr Relat Cancer. 2007;14:189–206. doi:10.1677/ERC-06-0068.
- Qu Q-X, Xie F, Huang Q, Zhang X-G. Membranous and cytoplasmic expression of PD-L1 in ovarian cancer cells. Cell Physiol Biochem. 2017;43:1893–1906. doi:10.1159/000484109.
- Lennon H, Sperrin M, Badrick E, Renehan AG. The obesity paradox in cancer: a review. Curr Oncol Rep. 2016;18:56. doi:10.1007/s11912-016-0539-4.
- McQuade JL, Daniel CR, Hess KR, Mak C, Wang DY, Rai RR, Park JJ, Haydu LE, Spencer C, Wongchenko M. Association of body-mass index and outcomes in patients with metastatic melanoma treated with targeted therapy, immunotherapy, or chemotherapy: a retrospective, multicohort analysis. Lancet Oncol. 2018;19:310–322. doi:10.1016/S1470-2045(18)30078-0.
- Kim SH, Li M, Trousil S, Zhang Y, Di Magliano MP, Swanson KD, Zheng B. Phenformin inhibits myeloid-derived suppressor cells and enhances the anti-tumor activity of PD-1 blockade in melanoma. J Invest Dermatol. 2017;137:1740–1748. doi:10.1016/j.jid.2017.03.033.
- Scharping NE, Menk AV, Whetstone RD, Zeng X, Delgoffe GM. Efficacy of PD-1 blockade is potentiated by metformin-induced reduction of tumor hypoxia. Cancer Immunol Res. 2017;5:9–16. doi:10.1158/2326-6066.CIR-16-0103.
- Ingram JR, Dougan M, Rashidian M, Knoll M, Keliher EJ, Garrett S, Garforth S, Blomberg OS, Espinosa C, Bhan A. PD-L1 is an activation-independent marker of brown adipocytes. Nat Commun. 2017;8:647. doi:10.1038/s41467-017-00799-8.
- Hettich M, Braun F, Bartholomä MD, Schirmbeck R, Niedermann G. High-resolution PET imaging with therapeutic antibody-based PD-1/PD-L1 checkpoint tracers. Theranostics. 2016;6:1629. doi:10.7150/thno.15253.
- Siersbæk R, Madsen JGS, Javierre BM, Nielsen R, Bagge EK, Cairns J, Wingett SW, Traynor S, Spivakov M, Fraser P. Dynamic rewiring of promoter-anchored chromatin loops during adipocyte differentiation. Mol Cell. 2017;66(420–435):e425. doi:10.1016/j.molcel.2017.04.010.
- Lefterova MI, Zhang Y, Steger DJ, Schupp M, Schug J, Cristancho A, Feng D, Zhuo D, Stoeckert CJ, Liu XS. PPARγ and C/EBP factors orchestrate adipocyte biology via adjacent binding on a genome-wide scale. Genes Dev. 2008;22:2941–2952. doi:10.1101/gad.1709008.
- Korpal M, Puyang X, Wu ZJ, Seiler R, Furman C, Oo HZ, Seiler M, Irwin S, Subramanian V, Joshi JJ. Evasion of immunosurveillance by genomic alterations of PPARγ/RXRα in bladder cancer. Nat Commun. 2017;8:103. doi:10.1038/s41467-017-00147-w.
- Seargent JM, Yates EA, Gill JH. GW9662, a potent antagonist of PPARγ, inhibits growth of breast tumour cells and promotes the anticancer effects of the PPARγ agonist rosiglitazone, independently of PPARγ activation. Br J Pharmacol. 2004;143:933–937. doi:10.1038/sj.bjp.0705973.
- Leesnitzer LM, Parks DJ, Bledsoe RK, Cobb JE, Collins JL, Consler TG, Davis RG, Hull-Ryde EA, Lenhard JM, Patel L. Functional consequences of cysteine modification in the ligand binding sites of peroxisome proliferator activated receptors by GW9662. Biochemistry. 2002;41:6640–6650.
- Shirakawa K, Yan X, Shinmura K, Endo J, Kataoka M, Katsumata Y, Yamamoto T, Anzai A, Isobe S, Yoshida N. Obesity accelerates T cell senescence in murine visceral adipose tissue. J Clin Invest. 2016;126:4626–4639. doi:10.1172/JCI88606.
- Lin P-Y, Sun L, Thibodeaux SR, Ludwig SM, Vadlamudi RK, Hurez VJ, Bahar R, Kious MJ, Livi CB, Wall SR. B7-H1–dependent sex-related differences in tumor immunity and immunotherapy responses. J Immunol. 2010;185:2747–2753. doi:10.4049/jimmunol.1000496.
- Casey AE, Jr WR L, Ross GL. Sustained enhanced growth of carcinoma EO771 in C57 black mice. Proc Soc Exp Biol Med. 1951;77:358–362.
- Stewart TJ, Abrams SI. Altered immune function during long-term host-tumor interactions can be modulated to retard autochthonous neoplastic growth. J Immunol. 2007;179:2851–2859.
- Sun X, Gupta K, Wu B, Zhang D, Yuan B, Zhang X, Chiang H-C, Zhang C, Curiel TJ, Bendeck MP, et al. Tumor-extrinsic discoidin domain receptor 1 promotes mammary tumor growth by regulatingadipose stromal interleukin 6 production in mice. J Bio Chem. 2018. doi:10.1074/jbc.RA117.000672.