
ABSTRACT
Correct temporal and spatial control of actin dynamics is essential for the cytotoxic T cell effector function against tumor cells. However, little is known whether actin engineering in tumor-targeted T cells can enhance their antitumor responses, thereby potentiating the adoptive T cell therapy. Here, we report that TAGLN2, a 22-KDa actin-stabilizing protein which is physically associated with lymphocyte function-associated antigen-1 (LFA-1), potentiates the OTI TCR CD8+ T cells to kill the intercellular adhesion molecule-1 (ICAM-1)-positive/OVA-presenting E0771 cells, but not ICAM-1-negative OVA-B16F10 cells, suggesting an ‘inside-out’ activation of LFA-1, which causes more efficient immunological synapse formation between T cells and tumor cells. Notably, recombinant TAGLN2 fused with the protein transduction domain (TG2P) overcame the disadvantages of viral gene delivery, leading to a significant reduction in tumor growth in mice. TG2P also potentiated the CD19-targeted, chimeric antigen receptor (CAR)-modified T cells to kill Raji B-lymphoma cells. Our findings indicate that activating the TAGLN2–actin–LFA-1 axis is an effective strategy to potentiate the adoptive T-cell immunotherapy.
Introduction
Cancer immunotherapies have led to important clinical advancements and provided new tools for the management of cancer. One emerging approach for cancer immunotherapy is the reactivation of tumor-infiltrated lymphocytes (TILs) by targeting checkpoint proteins, such as programmed death-1 (PD-1) or cytotoxic T lymphocyte antigen 4 (CTLA4).Citation1 However, the response rates are not sufficient.Citation2,Citation3 Another approach involves the use of chimeric antigen receptor (CAR)-engineered T or natural killer (NK) cells into ‘cancer hunter cells’.Citation4 However, these approaches have not yet been transferred to solid tumors, due in part to the strong immunosuppressive tumor microenvironment that may protect them from immune attack.Citation5–Citation7 It is therefore of great clinical interest to develop new strategies to potentiate the antitumor activities of reactivated TILs or CAR-engineered T and NK cells.
The immunological synapse (IS) is a multi-molecule functional structure that forms at the interface between a T cell and an antigen-presenting cell (APC) expressing the appropriate peptide/MHC complexes.Citation8 Subsequent studies have revealed relevant ISs between different types of immune cells and between immune cells and nonimmune cells, including tumor target cells.Citation9 During IS formation, T-cell antigen receptors (TCRs) constitute the main supramolecular activation clusters (c-SMACs) and elicit the “competence” signal for cellular activation.Citation8 However, full activation of T cells requires costimulatory “progression” signals resulting from the interaction of accessory receptors, e.g., CD2Citation10 or CD28,Citation11,Citation12 with their natural ligands, CD58 or CD80/86, respectively. Interestingly, cumulative evidence has suggested that although TCR stimulation results in actin polymerization, costimulatory signals lead to stronger, large-scale actin responses, which constitute the outermost distal-SMAC (d-SMAC) of the IS and promote the accumulation of receptors to the c-SMAC by retrograde actin flow, thereby resulting in full T-cell activation.Citation12,Citation13 However, suppression of costimulatory signals exploited by tumors may attenuate the actin rearrangement at the IS. Consequently, the absence of costimulation leads to a state of unresponsiveness/anergy or even cell death through apoptosis.Citation11 Actin cytoskeletons are also associated with integrin leukocyte function-associated antigen-1 (LFA-1) via cytoplasmic adaptor proteins, such as talin and vinculin, and regulates LFA-1 activity through avidity changes.Citation14 These growing evidences have suggested that controlling the actin cytoskeleton at the IS will open a new way to be overcome the insufficient costimulatory signals under strong immunosuppressive conditions at tumor sites. Therefore, we hypothesized that engineering of local actin dynamics at the IS will get over the current limits of immunotherapies adopting checkpoint blockades or engineered CAR-T cells by taking complete advantage of their efficacy.
Transgelin (TAGLN) is a small 22-kDa actin-binding protein that was first discovered in chicken gizzard smooth muscle Citation15 and was originally designated “transgelin” because of its transformation-sensitive and rapid actin-gelling properties.Citation16 Among three TAGLN superfamily members, we recently reported that TAGLN2 is predominantly expressed in T cells and stabilizes cortical F-actin to maintain the IS.Citation17 We also found that TAGLN2 overexpression caused LFA-1 activation after TCR stimulation.Citation17 In the present study, we found that TAGLN2 physically associated with LFA-1 via its calponin homology (CH) domain and enhanced the activity of Rap1, a small GTPase that has been shown to regulate LFA-1 affinity and clustering.Citation18–Citation20 This biochemical property of TAGLN2 may have several advantages when applied to cancer immunotherapy. First, direct engineering of the integrin ectodomain can result in serious off-target effects because effector cells can also bind to unwanted cells or tissues that express intracellular adhesion molecules (ICAMs). Activation of LFA-1 by “inside-out” signaling will minimize deleterious off-target effects. Second, because LFA-1 functions as a homing receptor for leukocyte migration and diapedesis, increased avidity of LFA-1 by TAGLN2 may facilitate effector cell migration to the tumor areas. Third, increased filamentous (F)-actin contents at the IS can mimic full activation signals as evoked by costimulatory receptor-ligand interactions, although strong suppressive microenvironments are dominant. Fourth, stable IS formation between effector killer cells and tumor target cells can increase the rate of tumor cytotoxicity.
In the current work, to our surprise, we observed that CD4+ and CD8+ T cells from severe tumor-bearing mice show significant reduction of TAGLN2 expression, suggesting an impaired T cell adhesion to APCs or tumor cells via LFA-1. We therefore evaluated the efficacy of TAGLN2 overexpression in cytotoxic OTI TCR T cells targeting two selected OVA-peptide presenting tumors, i.e., E0771 breast tumor and B16F10 melanoma. Since virus-based gene delivery systems have many disadvantages, including cost and safety issues.Citation21 We developed a protein transduction domain (PTD)-linked recombinant TAGLN2 (TG2P) and applied for both mouse OTI CD8+ T cells and human CD19-targeted, chimeric antigen receptor (CAR)-modified T cells. We expect that TG2P may be widely applicable for many types of adoptive cell-mediated cancer immunotherapies.
Results
TAGLN2 stabilizes immunological synapse by ‘inside-out’ activation of LFA-1
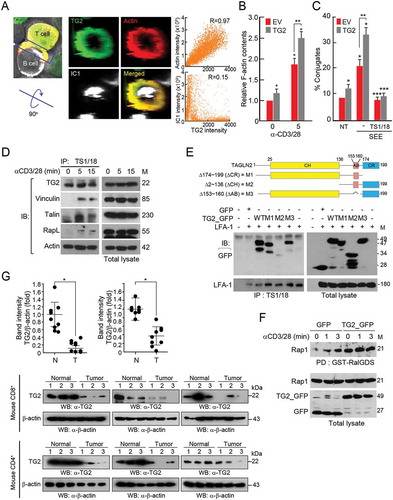
Previously, we found that TAGLN2 (TG2), which is predominantly expressed in lymphocytes, is highly concentrated at the peripheral actin ring of the IS () and corresponds to increased F-actin contents () and T-APC conjugate formation ().Citation17 In the present study, we also found that TAGLN2 was physically associated with LFA-1 through its CH domain, regardless of stimulation (), and corresponded to the activation of Rap1 (), which functions as a key regulator of LFA-1-dependent adhesion and migration of T cells.Citation18–Citation20 These results suggested that TAGLN2, in addition to its biochemical characteristics enabling it to control actin dynamics, acted as a cytosolic factor to modulate ‘inside-out’ signaling of the integrin LFA-1. The schematic diagram in Supplemental indicates the potential mechanisms of action of TAGLN2 in T cells. TAGLN2 not only stabilized F-actin but also blocked cofilin-mediated actin polymerization, resulting in increased F-actin contents at the ISCitation17 and leading to prolonged T-cell activation and IL-2 production. Additionally, TAGLN2 regulated ‘inside-out’ integrin LFA-1 function when T cells received a primary antigen signal through the TCR, even though the ‘outside-in’ costimulatory signals were weak in the tumor microenvironment. This led to the stable adhesion of T cells to the tumor target cells. These dual regulatory mechanisms of TAGLN2 enhanced T-cell activation, leading us to hypothesize that TAGLN2 could be a potential effector molecule with the ability to potentiate cancer cell killing via cell therapies. Thus, TAGLN2 may be applicable in many types of cancer immunotherapies, including CAR or TCR transgene-adopted cytotoxic T cells and NK cells. Strikingly, we further found that CD4+ or CD8+ T cells from severe E0771 tumor-bearing mice showed significant reduction of TAGLN2 levels (), strongly suggesting that T cells from tumor-bearing mice may have an impaired adhesion capacity mediated by LFA-1/ICAM-1 interaction. This result further urged us to investigate whether TAGLN2 acts as a potential T-cell booster that potentiates the antitumor response of cytotoxic T effector cells against ICAM-1-positive cancer cells.
Figure 1. TAGLN2 physically interacted with LFA-1 and increased Rap1 activity. (a) Localization of TAGLN2 (TG2), F-actin, and ICAM-1 (IC1) at the interface between T and B cells. Jurkat T cells expressing TG2_GFP and LifeA_mRFP (red) were conjugated with SEE-loaded Raji B cells stained with IC1_Cy5 (white) for 30 min. Three-dimensional reconstruction revealed the en face positions of contact interface areas between cells. Colocalization of TG2 and LifeA or TG2 and IC1 signals was determined by Pearson’s correlation coefficient (R). (b) Jurkat T cells expressing GFP and TG2_GFP were stimulated with anti-CD3/28 for 5 min. F-actin content was quantified using flow cytometry. Data are presented as relative fluorescence intensity compared with that in Jurkat T cells expressing GFP at 0 min. (c) Conjugate formation between Jurkat T cells expressing GFP or TG2_GFP cells and SEE-loaded Raji B cells. (d) Jurkat T cells were stimulated with anti-CD3/28 for the indicated times. Samples were immunoprecipitated with TS1/18 (anti-LFA-1 antibodies) and blotted with antibodies against the indicated proteins. (e) HEK293T cells were cotransfected with LFA-1 and different mutants of TG2, and immunoprecipitation and western blotting were performed. The schematic diagram shows the deletion mutants of TAGLN2 (M1, M2, and M3). (f) Activity of Rap1. Jurkat T cells expressing GFP and TG2_GFP were stimulated with anti-CD3/28 antibodies, and pull-down assays were performed. GTP-bound Rap1 was visualized by immunoblotting using anti-Rap1 antibodies. Data are representative of three independent experiments (b–f) (g) TG2 expression in CD4+ or CD8+ T cells from normal or severe tumor-bearing mice. When tumor size of the mice was over 3,000 mm3, the mice were defined as “severe tumor-bearing mice”. CD4+ or CD8+ T cells were purified from spleen and lymph nodes of mice and then subjected to western blot analysis. Intensities of western blot bands were analyzed by the Quantity one image analysis program (Bio-Rad) and were normalized to β-actin. *P < 0.05.
Retroviral transduction of TAGLN2 potentiated the cytotoxicity of OTI CD8+ T cells against icam-1-positive cancer cells and enhanced T-cell adhesion and cytokine release
Next, we generated a retroviral DNA construct containing wild-type TAGLN2 and eGFP genes or eGFP (empty vector [EV]) alone (). Retroviral particles containing TAGLN2 or EV were then produced from host plat E cells and infected into mouse primary CD8+ T cells for determination of the viral transduction efficiency by flow cytometry. The efficiency was generally over 80% () and was also confirmed by western blotting (). Next, we questioned whether TAGLN2 expression may influence CD8+ T cell adhesion to cancer cells via the LFA-1/ICAM-1 interaction, as we observed for T-cell conjugation with APCs (). To this end, we examined the expression levels of ICAM-1 in two cancer cell lines. Interestingly, B16F10 melanoma expressed little ICAM-1, whereas E0771 breast cancer cells expressed relatively high amounts of ICAM-1 (). By performing conjugation assays, we observed that OTI TCR+ CD8+ T cells overexpressing TG2 (OTI TG2-CD8+ T cells) showed significant increases in the numbers of conjugates when the cells were incubated with OVA257-264 peptide-loaded E0771 (OVA-E0771) cells, but not with OVA-loaded B16F10 (OVA-B16F10) cells ( and Figure S2), suggesting that the costimulatory LFA-1/ICAM-1 interaction was critical for cytotoxic T-cell adhesion to ICAM-1+ cancer target cells. This conclusion was further corroborated by utilizing anti-LFA-1 antibodies; anti-LFA-1, but not control IgG, antibodies significantly reduced the number of conjugates between TG2-CD8+ T cells and E0771 cells ().
Figure 2. Retroviral transduction of TAGLN2 increased adhesion, cytokine release, and enhanced the cytotoxic activity of OTI CD8+ T cells against onto ICAM-1-positive cancer cells. (a) Schematic diagram of retroviral vector constructs containing TAGLN2 and eGFP or eGFP (EV) alone. (b, c) Transduction efficiency of TAGLN2 or EV in OTI CD8+ T cells was determined by flow cytometry (b) and western blotting (c). (d) Surface expression of ICAM-1 in B16F10 and E0771 cells. Cancer cells were stained with FITC-isotype control IgG or FITC-anti ICAM-1. The expression pattern of ICAM-1 was determined in both cell lines by flow cytometry and confocal microscopy. Data are representative of at least three independent experiments (b–d), *P < 0.05. (e) Representative flow cytometric profiles of conjugate formation between OTI CD8+ T cells (1 × 10⁶) with/without TAGLN2 and B16F10 or E0771 cells (1 × 10⁶) in the absence or presence of OVA peptides. In some cases, control IgG or α-LFA-1 blocking antibodies were used. (f) OTI CD8+ T cells (1 × 10⁶ – 1 × 10⁷) with/without TAGLN2 were mixed with B16F10 or E0771 cells (1 × 10⁶) in the absence or presence of OVA peptides. mGZMB secretion in each condition was assessed by ELISA. (g) Representative flow cytometric profiles for quantification of apoptotic cancer cells after incubation with OTI EV-CD8+ T or OTI TG2- CD8+ T cells. OTI EV-CD8+ T or OTI TG2-CD8+ T cells (1 × 10⁷) were mixed with PKH26-labeled cancer cells (1 × 10⁶) in the absence or presence of OVA peptides. After staining with 7-AAD, apoptotic cancer cells were determined by flow cytometry. Shown on the right are the average percentages of cytotoxicity. Data represent the means of three experiments (e–g) ± SDs. *P < 0.05 versus OTI EV-CD8+ T cells.
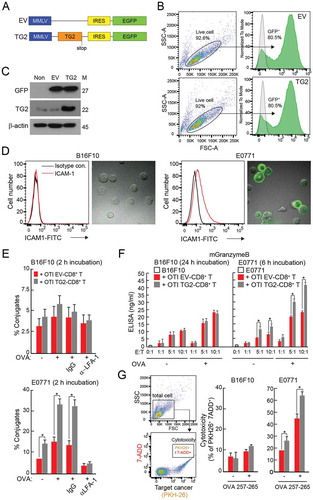
We next questioned whether the strong conjugation of OTI TG2-CD8+ T cells with E0771 cells was correlated with increased cytokine release and cytotoxicity. mGranzyme B (mGZMB) was significantly elevated in the population of OTI TG2-CD8+ T cells interacting with OVA-E0771 cells (). Furthermore, these cells significantly lysed E0771 cells, but not B16F10 cells (). These data indicated that overexpression of TG2 influenced the ability of OTI CD8+ T cells to effectively kill tumor cells, presumably by upregulating actin-dependent signaling pathways and promoting costimulatory LFA-1 activation.
Retroviral transduction of TAGLN2 potentiated the antitumor activity of OTI CD8+ T cells in vivo
Since our in vitro data revealed that OTI TG2-CD8+ T cells showed increased conjugation with target cancer cells together with enhanced cytokine release and higher cytotoxicity, we then examined the effectiveness of OTI TG2-CD8+ T cells in vivo. To this end, OVA-E0771 cells were implanted into the mammary fat pads of C57BL/6 female mice. Fourteen days later, the mice were injected intravenously with OTI EV-CD8+ T and/or OTI TG2-CD8+ T cells (). Two days later, the mice were sacrificed, and cancerous tissues were removed. Cryosection of the removed cancer tissues showed that both OTI EV-CD8+ T and OTI TG2-CD8+ T cells were similarly targeted to tumors originating from E0771 cells, as determined by confocal and fluorescence-assisted cell sorting (FACS) analyses (). We used immunohistochemistry to determine the expression levels of several proteins and the number of apoptotic cells in the tumor sites and found that cells positive for mKi67, a cancer cell proliferation marker, were decreased, whereas cells positive for interferon gamma (mIFNγ), mGZMB, and terminal deoxynucleotidyl transferase dUTP nick end labeling (TUNEL) staining were significantly increased in tumor sites injected with the OTI TG2-CD8+ T compared with OTI EV-CD8+ T cells (). For all the three groups, the cellular morphologies (H&E) and the expression levels of ICAM-1 in tumor sites were not significantly different (). Similar to , the numbers of tumor-infiltrated CD8+ T cells were similar in the OTI EV-CD8+ T and OTI TG2-CD8+ T groups, but higher in the non-treated group ().
Figure 3. Retroviral transduction of TAGLN2 potentiated the antitumor activity of CD8+ T cells in vivo. (a) Schematic experimental design of T-cell adoptive transfer for determining the activity of OTI CD8+ T cells. (b) Infiltration of adoptively transferred OTI EV-CD8+ T and OTI TG2-CD8+ T cells into tumor sites. Confocal (top) and representative flow cytometric profile (bottom, right) revealed tumor-infiltrated OTI EV-CD8+ T and OTI TG2-CD8+ T cells. The number of infiltrated cells per field (300 μm × 300 μm) is represented as a bar graph (bottom, left). (c, d) IHC and TUNEL analyses of OVA-E0771 tumors. IHC was performed using antibodies against mICAM-1, mCD8T, mKi-67, mIFNγ, and mGZMB. TUNEL assays were used to determine apoptotic cell death in tumor sites. Arrowheads indicate the TUNEL-positive cells. The average percentages of positive cells and TUNEL-positive cells were represented as bar graphs. H&E, hematoxylin and eosin. *P < 0.05. (e) Schematic experimental design of T-cell immunotherapy for E0771 tumors. OTI EV-CD8+ T or OTI TG2-CD8+ T cells were intravenously injected into the tails of mice on days 7, 10, and 13 after tumor inoculation. (f, g) Tumor weights and sizes, as shown using a statistical weight graph (f) and photograph (g). (h) Kaplan-Meier survival curve of OVA-E0771 tumor-bearing mice after adoptive transfer of OTI EV-CD8+ T or OTI TG2-CD8+ T cells. Survival time was defined as the day of death or euthanasia due to a tumor greater than 3,000 mm3 in size. *P < 0.05 versus OTI EV-CD8+ T cells.
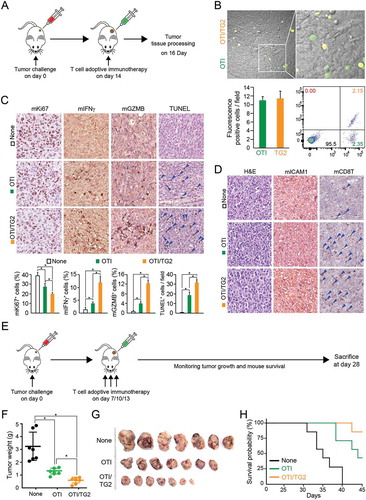
To evaluate the effects of OTI TG2-CD8+ T cells on tumor growth in vivo, OVA-E0771 cells were implanted into the mammary fat pads of C57BL/6 mice. Seven days later, the mice were randomized into three groups for administration of OTI CD8+ T cells. OTI EV-CD8+ T or OTI TG2-CD8+ T cells were injected intravenously three times at 3-day intervals (). All animals were sacrificed 28 days after tumor injection, and the tumors were weighed. The average tumor weight from mice injected with OTI EV-CD8+ T cells was lower than that of tumors without cell injection, suggesting that adoptive cytotoxic T-cell transfer efficiently reduced tumor growth in vivo. Interestingly, intravenous administration of OTI TG2-CD8+ T cells significantly reduced tumor size compared with that of tumors without adoptive cell transfer or tumors transferred with OTI EV-CD8+ T cells (). Kaplan-Meier survival studies 40 days after tumor injection showed that untreated mice and mice receiving non-transduced T cells had median survival times of 35 and 43 days, respectively. In contrast, mice adoptively transferred with OTI TG2-CD8+ T cells had an 85% probability of surviving longer than 45 days ().
Recombinant TAGLN2 fused with PTD (TG2P) was efficiently internalized into T cells and enhanced T-cell adhesion and cytokine release
Small protein domains, commonly referred to as PTDs, have been developed for the delivery of certain therapeutic macromolecules into eukaryotic cells.Citation22 To overcome the disadvantages of virus-mediated gene delivery systems, such as inconsistent transduction efficiency, long-term preparation, high cost, and safety issues, we generated TAGLN recombinant protein fused with PTD (TG2P), which was easier and faster to transduce into mouse primary T cells (). Only TG2 containing PTD (TG2P and TG2P (-LPS)) were readily internalized into the T cells (), and internalized TG2P was as stable as endogenous TAGLN2 for at least 24 h ().
Figure 4. Recombinant TAGLN2 fused with the protein transduction domain (TG2P) potentiated T-cell adhesion to APCs and cytokine release. (a) Schematic diagram of TG2P and amino acid (a.a.) sequences consisting of the C-terminus of TAGLN2, linker a.a. sequences, and N-terminus of PTD. (b, c) Transduction efficiency of TG2P, LPS-cleared TG2P (TG2P (-LPS)), and wild-type TG2 without PTD (TG2) in CD3+ T cells. CD3+ T cells were incubated with the indicated concentrations of each recombinant proteins for 4 h, and the cells were then subjected to western blot analysis. (d) The cells from (b) were cultured for the indicated times, and the retention time of TG2P in CD3+ T cells was analyzed. (e) Conjugate formation. TG2P-CD3+ T cells (1 × 10⁶) were incubated with SEB-loaded B cells (1 × 10⁶) for 30 min, and the percentages of conjugates were determined by flow cytometry (left). The results are presented as bar graphs. In some cases, control IgG or anti-LFA-1 antibodies were used. Data are representative of at least three independent experiments (b–e), *P < 0.05. (f) Cytokine analysis. TG2P (+ = 2.5 μM; ++ = 5 μM)-CD3+ T cells (1 × 10⁶) were incubated with SEB-loaded B cells (1 × 10⁶) for 6 and 24 h. Secreted cytokines (mIL-2, mIFNγ, and mGZMB) were measured by ELISAs (24 h). mRNA levels were determined by qRT-PCR (6 h). Data represent the means of three experiments ± SDs. *P < 0.05 versus CD3+ T cells.
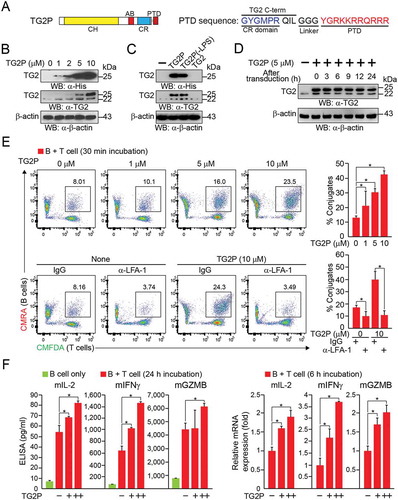
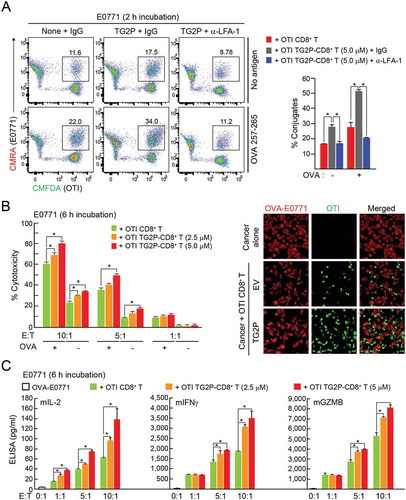
We next determined whether treatment with TG2P showed the same efficacy as viral transduction of TAGLN2 in terms of CD3+ T cell adhesion to antigen-loaded B cells. We found that CD3+ T cells treated with TG2P (TG2P-CD3+ T cells) significantly increased the number of conjugates when cells were incubated with SEB-loaded B cells. The number of conjugates was correlated with the concentration of TG2P used to treat T cells (). In accordance with the results of viral gene delivery, significant upregulation of mIL-2, mIFNγ, and mGZMB was observed in the population of TG2P-CD3+ T cells incubated with SEB-loaded B cells (). These results indicated that PTD-based transduction was as effective as retrovirus-based gene delivery in CD3+ T cells. We therefore applied TG2P to the OTI CD8+ T cells to establish OTI TG2P-CD8+ T cells. Treatment with TG2P significantly increased the number of OTI CD8+ T-OVA-E0771 conjugates (). In addition, strong inhibition of adhesion by antibodies targeting LFA-1 demonstrated that the effect of TG2P was mediated through activation of LFA-1. OTI TG2P-CD8+ T cells also produced more cytokines, such as mIL2, mIFNγ, and mGZMB ( and Figure S3), and exerted strong cytotoxic activity against E0771 cells (). In contrast, OTI TG2P-CD8+ T cells did not affect ICAM-1− OVA-B16F10 cells (Figure S4), suggesting that the adhesive interaction between cytotoxic T cells and cancer cells through LFA-1/ICAM-1 was critical.
Figure 5. Transduction of TG2P in CD8+ T cells increased adhesion and cytokine release in response to ICAM-1-positive cancer cells. (a) Conjugate formation. OTI non-CD8+ T or OTI TG2P-CD8+ T cells (1 × 10⁶) were incubated for 2 h with E0771 cells (1 × 10⁶) in the absence or presence of OVA peptides, and the percentages of conjugates were then determined by flow cytometry (left). The results are presented as bar graphs (right). In some cases, control IgG or anti-LFA-1 antibodies were used. Data are representative of at least three independent experiments. *P < 0.05. (b) Cytotoxicity of TG2P-CD8+ T cells (1 × 10⁶ – 1 × 10⁷). The above cells in (a) were further incubated for 6 h, and E0771 cell (1 × 10⁶) death (cytotoxicity) was then assessed by LDH release. (c) Cytokine analysis. Secreted cytokines (mIL-2, mIFNγ, and mGZMB) were measured by ELISAs (6 h). Data represent the means of three experiments ± SDs. *P < 0.05 versus OTI non-CD8+ T cells.
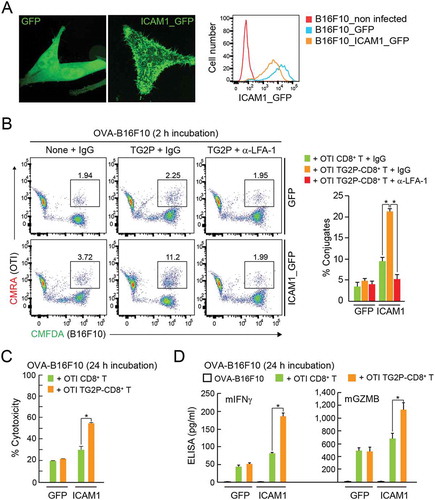
To corroborate whether the increased adhesion capacity of TG2-CD8+ T cells is truly dependent on the LFA-1 and ICAM-1 interaction, we established B16F10 cells stably overexpressing ICAM-1 fused with GFP () and determined the adhesion of cytotoxic CD8+ T cells. In the presence of OVA257-264 peptide, OTI CD8+ T cells significantly increased the adhesion to the ICAM-1_GFP+ B16F10 cells (). Moreover, OTI TG2P-CD8+ T cells showed increased adhesion to ICAM-1_GFP+ B16F10 cells compared with untreated CD8+ T cells (), confirming that the efficacy of TG2P is mediated by LFA-1/ICAM-1 interaction. In accordance with the increased adhesion capacity, OTI TG2P-CD8+ T cells showed a dramatic increase in cytotoxicity as well as cytokine production ().
Figure 6. Overexpression of ICAM-1 in B16F10 cells restored the adhesion and cytokine release of TG2P-CD8+ T cells. (a) GFP+ B16F10 and ICAM-1_GFP+ B16F10 cells. The expression pattern of GFP or ICAM-1_GFP was determined in each cell line by flow cytometry and confocal microscopy. (b) Conjugate formation. OTI non-CD8+ T or OTI TG2P-CD8+ T cells (1 × 10⁶) were incubated for 2 h with GFP+ B16F10 or ICAM-1_GFP+ B16F10 cells (1 × 10⁶) in the presence of OVA peptides, and the percentages of conjugates were then determined by flow cytometry (left). The results are presented as bar graphs (right). In some cases, control IgG or anti-LFA-1 antibodies were used. Data are representative of at least three independent experiments. *P < 0.05. (c) Cytotoxicity of TG2P-CD8+ T cells (1 × 10⁷). The above cells in (b) were further incubated for 24 h, and B16F10 cell (1 × 10⁶) death (cytotoxicity) was then assessed by LDH release. (d) Cytokine analysis. Secreted cytokines (mIFNγ and mGZMB) were measured by ELISAs (24 h). Data represent the means of three experiments ± SDs. *P < 0.05 versus OTI non-CD8+ T cells.
TG2P potentiated the antitumor activity of CD8+ cells in an E0771 tumor model
After tumor implantation as depicted in , the movement of OTI CD8+ T cells with or without TG2P into the tumor sites was evaluated. Cryosection of removed cancer tissues showed that both CD8+ T cells were similarly targeted into the E0771 cells (). We also determined the expression levels of several proteins and the number of apoptotic cells in the tumor sites and found that all results were similar to those obtained from OTI TCR TG2-CD8+ T cells (; see also ).
Figure 7. Transduction of TG2P potentiated the antitumor activity of CD8+ cells in an E0771 tumor model. (a) Infiltration of adoptively transferred OTI non-CD8+ T and OTI TG2P-CD8+ T cells into tumor sites. Confocal (top) and representative flow cytometric profiles (bottom, right) revealed tumor infiltrated OTI non-CD8+ T and OTI TG2P-CD8+ T cells. The numbers of infiltrated cells per field (300 μm × 300 μm) are represented as a bar graph (bottom, left). (b, c) IHC and TUNEL analyses of OVA-E0771 tumors. IHC was performed using antibodies against mICAM-1, mCD8T, mKi-67, mIFNγ, and mGZMB. TUNEL assays were used to determine apoptotic cell death in the tumor sites. The average percentages of positive cells and TUNEL-positive cells are represented as bar graphs. *P < 0.05. (d, e) Tumors were isolated; weights and sizes of tumors are presented as a weight graph (d) and photograph (e). (f) Kaplan-Meier survival curves of OVA-E0771 tumor-bearing mice after adoptive transfer of OTI non-CD8+ T or OTI TG2P-CD8+ T cells. Survival time was defined as the day of death or euthanasia due to a tumor measuring more than 3,000 mm3. *P < 0.05 versus OTI non-CD8+ T cells.
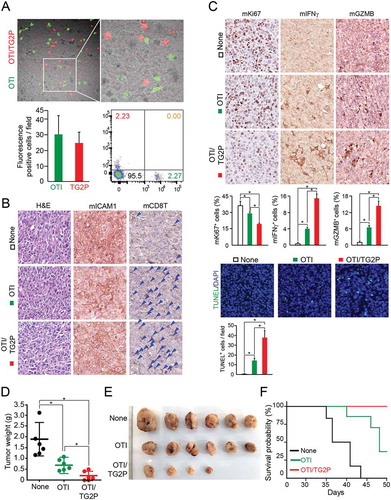
We further evaluated the effects of OTI TG2P-CD8+ T cells on tumor growth in vivo. OTI TG2P-CD8+ T cells significantly reduced the average tumor weight compared with that of tumors without adoptive cell transfer or treated with OTI CD8+ T cells without TG2P, suggesting that recombinant TG2P had effects similar to those of retrovirus-based gene delivery (). Kaplan-Meier survival studies showed that untreated mice and mice treated with non-transduced OTI T cells had a median survival of 36 and 48 days, respectively. In contrast, mice adoptively transferred with OTI TG2P-CD8+ T cells had a 100% probability of surviving more than 50 days ().
Human CD19-targeted CAR-T cells with TG2P showed enhanced the antitumor activity against Raji B-lymphoma cells
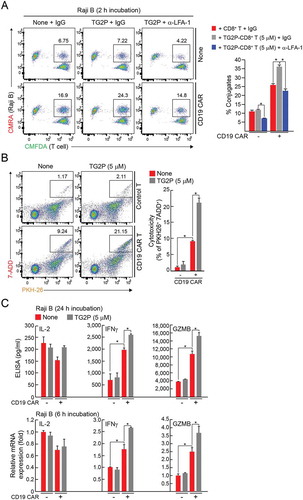
To investigate whether TG2P is also useful for CAR-modified T cells, human CD19-targeted CAR-T cells were treated with TG2P, and then the cells were incubated CD19+ Raji B-lymphoma cells. TG2P treatment significantly increased the number of CAR-T–B-lymphoma conjugates (). Consistently, it augmented the CAR-T-mediated cytotoxic activity more than 2-folds (from 9.24 to 21.15%) (). Cytokine analysis revealed that TG2P significantly increased IFN-γ and granzyme B release from CD19-engaged CAR-T cells (). These results strongly demonstrate that TG2P could be a promising protein drug that is useful for all kinds of adoptive T cell therapies.
Figure 8. TG2P potentiated the cytokine release and cytotoxicity of CD19-targeted CAR-T cells against B-cell lymphoma. (a) Conjugate formation. EV-CD8+ T or CD19-targeted CAR-CD8+ T cells (1 × 10⁶) with or without TG2P were mixed with Raji B cells (1 × 10⁶) for 2 h, and the percentages of conjugates were determined by flow cytometry (left). The results are presented as bar graphs. (b) Representative flow cytometric profiles for quantification of apoptotic cancer cells after incubation with EV-CD8+ T or CD19-targeted CAR-CD8+ T cells (5 × 10⁶) with or without TG2P. Each T cells were mixed with PKH26-labeled cancer cells (1 × 10⁶). After staining with 7-AAD, apoptotic cancer cells were determined by flow cytometry. Shown on the right are the average percentages of cytotoxicity. (c) Cytokine analysis. EV-CD8+ T or CD19-targeted CAR-CD8+ T cells (5 × 10⁶) with or without TG2P were incubated with Raji B cells (1 × 10⁶) for 6 and 24 h. Secreted cytokines (IL-2, IFNγ, and GZMB) were measured by ELISAs (24 h). mRNA levels were determined by qRT-PCR (6 h). Data represent the means of three experiments (a–c) ± SDs. *P < 0.05 versus EV-CD8+ T cells.
Discussion
To date, it is unclear whether controlling actin dynamics at the IS exerts positive effects on cell-mediated cancer immunotherapy. Furthermore, the effectiveness of modulation of integrin ‘inside-out’ signaling in cell therapy has not yet been proven. In the present study, we obtained strong evidence showing that overexpression of TAGLN2, a 22-kDa small actin stabilizing protein predominantly expressed in lymphocytes, in primary cytotoxic T cells significantly enhanced tumor cytotoxicity via increased stabilization of the IS between cytotoxic T cells and tumor target cells in vitro. The efficacy was largely dependent on the expression of ICAM-1 on tumor target cells, suggesting that regulation of LFA-1 activity by TAGLN2 via actin stabilization was critical for T cell-mediated anticancer activity. Viral transduction of TAGLN2 in cytotoxic OTI CD8+ T cells effectively suppressed tumor growth in vivo as compared with OTI CD8+ T cells containing EV. These findings suggested that stabilization of F-actin by TAGLN2 and the resulting LFA-1 avidity change at the IS was an effective strategy for cytotoxic CD8+ T cell-mediated cancer immunotherapy. Furthermore, we found that PTD-fused recombinant TAGLN2 had strong potential to be developed as an active adjuvant in cancer cell therapy due to its effectiveness and easy loading on various types of tumor-specific killer cells including CAR-modified human T cells.
Dynamic rearrangement of the actin cytoskeleton at the IS is absolutely necessary to sustain correct temporal and spatial control of the T-cell activation process.Citation13,Citation23 TCR stimulation results in actin polymerization.Citation24 For full activation, however, T cells also require ‘outside-in’ costimulation, which leads to significant rearrangement of the actin cytoskeleton and promotes accumulation of receptors and raft membrane microdomains at the interface between T cells and APCs.Citation10–Citation12,Citation25 These previous works imply that the artificial engineering of F-actin contents at the IS may mimic the signals evoked by costimulatory molecules. From this perspective, we utilized TAGLN2 as we found in a previous report that TAGLN2 increases F-actin contents through stabilization of F-actin in T cells during IS formation.Citation17 Recently, we also found that TAGLN2 is significantly upregulated in macrophages in response to lipopolysaccharide and enhances macrophage phagocytic function,Citation26 demonstrating that TAGLN2 plays an essential role in actin dynamics at the immunological or phagocytic synapses. In the present study, more strikingly, drastic down-regulation of TAGLN2 in T cells from severe E0771 tumor-bearing mice further emphasizes that TAGLN2 is an important actin regulator for cytotoxic T cell adhesion to tumor target cells. However, other proteins also can be considered. For instance, L-plastin, similar to TAGLN2, stabilizes actin filaments by means of its actin-bundling activity.Citation27 In contrast, cofilin enhances actin polymerization via its actin-severing activity.Citation28 Interestingly, we previously showed that TAGLN2 and cofilin localize to two distinguishable regions in the IS; cofilin localizes to the upper region of d-SMAC, where TAGLN2 is rather absent, and TAGLN2 localizes at the bottom of d-SMAC.Citation17
We found that TAGLN2 was physically associated with LFA-1 via the CH domain. TAGLNs belong to the calponin family and contain a single CH domain.Citation29 However, the CH domain alone does not mediate actin binding.Citation29 We, therefore, suggest that the CH domain of TAGLN2 may mediate the physical connection between F-actin and the cytoplasmic domain of LFA-1, thereby directly transmitting the inside actin-related signals to LFA-1 and eventually resulting in increased LFA-1 avidity. Consistent with this, significant activation of the small GTPase Rap1 in T cells overexpressing TAGLN2 suggested that TAGLN2, together with vinculin, talin, and RapL, is a protein contained in the cytoplasmic signalosomes of LFA-1.Citation30 These data further suggested that TAGLN2 directly controls LFA-1 avidity rather than indirectly controls it by upregulation of actin contents.
The cell adhesion molecules LFA-1 (CD11a/CD18) and ICAM-1 (CD54) are required for T-cell infiltration into tumors and antitumor function.Citation31 Indeed, administration of anti-LFA-1 antibodies completely abrogates the efficacy of adoptive immunotherapy,Citation32 suggesting an important contribution of LFA-1 in tumor immunology. However, no modulators that increase the affinity of LFA-1 have been applied to antitumor activity because they may have deleterious effects as a result of unwanted binding of T cells to non-target, ICAM-positive cells or tissues. Thus, it is theoretically reasonable to consider a strategy that controls the inside-out activation of LFA-1 by manipulating signals involved in the pathways of LFA-1 activation. In this regard, full-activation of LFA-1 through TCR-mediated, actin-linked strategies will be useful for cell therapies that are based on the recognition of tumor-associated antigen signals via TCRs or CARs. Indeed, although LFA-1 itself is not specific for tumor cells, it can be tumor-specific as it is only activated after TCRs or CARs are engaged with tumor antigens.
One major concern of the results of the current study is whether the overexpression of TAGLN2 in T cells may nonspecifically affect other non-tumor cells expressing ICAM-1 in vivo. Indeed, we observed that TAGLN2 overexpression alone slightly increased F-actin contents as well as Rap1 activity in T cells, resulting in a slight increase in the conjugation between T cells and tumor target cells even in the absence of antigen peptides. However, in the absence of a tumor antigen, the slight increase in adhesion seemed to have no direct effect on T-cell-mediated cytotoxicity in vivo as the CD8+ T cells were not activated. In addition, it is generally accepted that the actin cytoskeleton regulates LFA-1 ligand binding through avidity rather than affinity changes.Citation33 In contrast, TCR signals stimulate the adhesiveness of LFA-1 through both affinity and avidity regulations.Citation34 It has been shown that genetically engineered T cells with affinity-enhancing LFA-1 mutation show perturbed intravascular crawling to transmigration sites, thereby compromising diapedesis across the blood vessels.Citation35 In our case, however, overexpression of TAGLN2 did not affect the migration of OTI CD8+ T cells into the tumor sites, suggesting that LFA-1 avidity regulation does not influence T-cell diapedesis across the tumor blood vessels. Moreover, we found that tumor non-specific polyclonal TG2P-CD8+ T cells have little effect on tumor suppression (data not shown), suggesting that the TAGLN2–actin–LFA-1 axis can be effective when T cells are activated via TCRs or CARs.
ICAM-1 is expressed in APCs and, as a major ligand of LFA-1, is also expressed in several tumors.Citation31,Citation36–Citation38 Consistent with this, transfection of ICAM-1 into colorectal cancer cell lines inhibits tumor growth and metastasis.Citation39 In addition, the production of prostaglandin E2 in the tumor microenvironment downregulates the expression of ICAM-1 in tumor cells, reducing the cytotoxic effects of T cells.Citation40 Thus, ICAM-1 could be a potential target for cancer immunotherapy. However, in some reports, the expression of ICAM-1 has been shown to be positively correlated with a more aggressive tumor phenotype and metastatic potential,Citation38,Citation41 suggesting that ICAM-1 is not a good primary target protein for cancer immunotherapy. However, as shown in the present study, ICAM-1 could play an important role as an adhesion site for cytotoxic killer T cells. However, a problem of targeting ICAM-1 on cancer cells is that not all cancer cells express ICAM-1 on their surfaces. In this study, however, we found that although OTI TG2 (or TG2P)-CD8 T cells were ineffective for killing B16F10 melanoma cells in vitro, adoptive transfer of these cells significantly suppressed the tumor growth of B16F10 cells in vivo (data not shown). Interestingly, we found that ICAM-1 was induced in B16F10 tumor cells in vivo, presumably due to the production of cytokines, such as IFNγ and IFNβ, in the tumor microenvironment. Indeed, B16F10 cells have been shown to express ICAM-1 in response to IFNγ and IFNβ treatment.Citation42 Moreover, IFNγ-primed and IFNβ-treated B16F10 cell vaccines enhance CTL responses to melanoma cells in vivo.Citation42 Therefore, further studies are underway to determine whether co-immunotherapy with IFNγ and TG2-CD8+ T cells can improve the outcomes of ICAM-1-negative tumor cells.
The discovery of PTDs and cell-penetrating peptides (CPPs) in the late 1980s established a basis for further studies of the cellular delivery of large, bioactive molecules.Citation22 PTDs are now widely used as research tools and applied for the delivery of macromolecular drugs in patients with a variety of diseases.Citation22,Citation43 PTDs have also been developed for cancer treatment, including treatment of preclinical tumor-bearing animals.Citation43 Although it is still too early to predict the outcomes of clinical trials, there have been more than 20 phase I and phase II clinical trials performed by biotech companies and academic institutions.Citation22 Notably, no adverse effects of PTD-mediated delivery have been reported, thereby suggesting that PTD-mediated delivery is safe for patients. To the best of our knowledge, however, no reports have described the use of PTDs or CPPs directly enhancing cytotoxic T-cell functions in vitro and applying these PTDs or CPPs to kill tumor target cells in vivo. This approach will overcome many issues of PTD-conjugated drugs when applied systemically. As described above, PTD-based approaches also overcome the disadvantages of virus-based gene delivery, including inconstant transduction efficiency, time-consuming protocols, high cost, and safety issues. One of the downsides of the PTD-based approach for cell therapy is that it is not as stable as virus-based gene expression. However, the results presented here demonstrate that TG2P is as stable as endogenous TAGLN2 at least for 24 h. In addition, the fact that TG2P did not differ from the virus-mediated gene delivery system in terms of its efficacy implies that cytotoxic CD8+ T cells may exert their activity at the early period of adoptive cell transfer; otherwise, this disadvantage has a positive aspect as it can minimize the off-target effects caused by the unnecessary long-term activity.
In conclusion, two major approaches of immunotherapies have led to a new era in cancer treatment. Checkpoint blockade can circumvent the natural inhibitory signals that limit T-cell effector function.Citation2 Simultaneously, cell-based immunotherapy has emerged as a highly promising approach for the treatment of cancer.Citation5 However, both strategies have limitations, including a lack of responsive in some patients,Citation2 difficulty in treating solid tumors,Citation4 and off-target toxicities.Citation1,Citation4,Citation7,Citation44 Therefore, it is of great clinical interest to develop alternative methods to potentiate cancer cell therapy. Accordingly, actin and integrin control by TAGLN2 may be used in combination with currently available cytotoxic T cell- and NK cell-mediated therapies.
Materials and methods
Reagents and antibodies
Rabbit polyclonal anti-TAGLN2 antibodies were raised in rabbits using purified full-length TAGLN2 (AbFrontier, Seoul, Korea). Rabbit polyclonal anti-green fluorescent protein (GFP) and rabbit polyclonal anti-β-actin antibodies were purchased from Santa Cruz Biotechnology (Santa Cruz, CA). Mouse polyclonal anti-His, anti-Vinculin, anti-Talin, anti-RapL, anti-LFA-1, anti-Rap1, horseradish peroxidase-conjugated anti-mouse IgG, and anti-rabbit or mouse IgG antibodies were obtained from Cell Signaling Technology (Danvers, MA). 145-2C11 (mouse anti-CD3; CRL-1975) and PV1 (mouse anti-CD28; HB-12352) hybridoma cell lines were purchased from the American Type Culture Collection (ATCC; Manassas, VA). TS1/18 (anti-human LFA-1; HB-203) and R6.5 (anti-human ICAM-1) hybridoma cell lines were a gift from T.A. Springer (Harvard Medical School, Boston, MA). Anti-human CD28 and anti-mouse ICAM-1 antibodies were acquired from R&D Systems (Minneapolis, MN). Anti-mouse CD8a, anti-rabbit IFNγ, and anti-rabbit GZMB antibodies were obtained from Abcam (Cambridge, MA). Anti-mouse LFA-1, fluorescein isothiocyanate (FITC)-conjugated anti-mouse ICAM-1, and FITC-rat IgG1 isotype control antibodies were purchased from Biolegend (San Diego, CA). CellTracker CMFDA-green, CMRA-Orange, and Lipofectamine 2000 reagent were obtained from Invitrogen (Carlsbad, CA). OVA peptide fragments (257–265) were purchased from InvivoGen (San Diego, CA). Staphylococcal enterotoxin E (SEE) and staphylococcal enterotoxin B (SEB) were obtained from Toxin Technology, Inc. (Sarasota, FL). Tetramethylrhodamine (TRITC)-phalloidin and poly-l-lysine (PLL) were purchased from Sigma (St. Louis, MO). Reverse transcription polymerase chain reaction (PCR) premix was purchased from Enzynomics (Daejeon, Korea). Restriction enzymes were purchased from New England Biolabs, Inc. (Beverly, MA). The plasmid DNA purification kit and WEST-ZOL Western Blot Detection kit were purchased from iNtRON Biotechnology (Seongnam, Korea). PrimeSTAR HS DNA polymerase was purchased from TaKaRa Bio Inc. (Shiga, Japan). Unless otherwise stated, all chemical reagents were purchased from Sigma.
Cells
Jurkat T (TIB-152), Raji B (CCL-86), HEK293T (CRL-3216), E0771 (CRL-2755), and B16F10 (CRL-6475; all from ATCC) cells and Platinum-E (Plat-E) viral packaging cells (Cell Biolabs, San Diego, CA) were maintained in RPMI-1640 or Dulbecco’s modified Eagle medium (Invitrogen) supplemented with 10% (v/v) fetal bovine serum (FBS; Invitrogen). Stable E0771 cells expressing OVA (pCL-neo-cOVA; Addgene, Cambridge, MA) were prepared by transfection with Lipofectamine 2000 reagent (Invitrogen) and selected with G418 (InvivoGen). To establish stable B16F10 cell lines expressing ICAM-1 fused with GFP (ICAM-1_GFP), ICAM-1 cDNA in pHJ-1 vector was cotransfected with lentiviral packaging vectors by Lipofectamine 2000 reagent (Invitrogen) into HEK293T cells. After 48 h, the supernatants were collected and spin infected into B16F10 cells by centrifugation at 800 × g for 30 min in the presence of 8 μg/ml polybrene. Naïve CD3+ T cells were purified from mouse spleen and lymph nodes by negative selection using a T-cell enrichment column (R&D Systems). To generate mouse T-cell blasts, CD3+ T cells were incubated in 2 µg/mL anti-CD3/28 coated culture plates with 100 U/mL rIL-2 for 48 h and cultured for an additional 5 days with 100 U/mL rIL-2. Mouse splenocytes were dispersed and purified into CD4+, CD8+ and CD19+ populations using EasySep (StemCell Technologies, Seattle, WA). The purity of each population was confirmed to be more than 95% by flow cytometry.
cDNA constructs
To generate TAGLN2 constructs, a TAGLN2 clone coding for the full-length open reading frame was purchased from ImaGene (Berlin, Germany). TAGLN2, TAGLN2ΔCR (Δ174-199), TAGLN2ΔCH (Δ2-136), and TAGLN2ΔAB (Δ153-160) genes were generated by standard or overlapping PCR and subcloned into the pEGFP vector (Addgene). To produce His-tagged TG2P, the pET-21a vector was used as an expression vector; this vector has a T7 promoter and provides six His residues at the C terminus of the expressed protein. The coding sequence of TAGLN2 was amplified by PCR, and the products were incorporated into the pET-21a vector (Novagen, Madison, WI). The mouse ICAM-1 coding sequence region was ligated to pHJ-1 as a lentiviral vector (CMV promoter).
Animals
C57BL/6 wild-type mice and OTI TCR transgenic mice (C57BL/6 background) were purchased from Jackson Laboratories (Bar Harbor, ME). All mice were housed in specific pathogen-free conditions. All experimental methods and protocols were approved by the Institutional Animal Care and Use Committee of the School of Life Sciences, Gwangju Institute of Science and Technology and carried out in accordance with their approved guidelines.
Reverse transcription PCR (RT-PCR) and real-time quantitative RT-PCR (qRT-PCR)
Total RNA was isolated from cells using TRIzol reagent (Molecular Research Center, Cincinnati, OH). cDNA was prepared using RT Premix. Real-time qPCR was conducted in an ABI PRISM 7300 RT-PCR System using a SYBR Green PCR Master Mix (Applied Biosystems, Carlsbad, CA) and gene-specific primers (forward and reverse pairs, respectively) as follows: mouse IL-2, 5′-CACGTCTTGCACTTGTCAC-3′ and 5′-CCTTCTTGGGCATGTAAAACT-3′; mouse INFγ, 5′-GCTCTGAGACAATGAACGCT-3′ and 5′-AAAGAGATAATCTGGCTCTG-3′; mouse GZMB, 5′-TTTCATCCTGTAATTGGACTAA-3′ and 5′-GCGATCTCCACACTTCTC-3′; mo-use GAPDH, 5′-GCACAGTCAAGGCCGAGAAT-3′ and 5′-GCCTTCTCCATGGTGGTGAA-3′; human IL-2, 5′-TGTCACAAACAGTGCACCTAC-3′ and 5′-CAGTTCTGTGGCCTTCTTGG-3′; human IFNγ, 5′-GAGTGTGGAGACCATCAAGGA-3′ and 5′-CGACAGTTCAGCCATCACTT-3′; human GZMB, 5′-AGGCTACCTAGCAACAAGGC-3′ and 5′-TCGATCTTCCTGCACTGTCA-3′; human GAPDH, 5′-ACCCAGAAGACTGTGGATGG-3′ and 5′-TCAGCTCAGGGATGACCTTG-3′. The mRNA levels of the target genes relative to GAPDH were normalized using the following formula: relative mRNA expression = 2−(ΔCt of target gene – ΔCt of GAPDH), where Ct is the threshold cycle value. In each sample, the expression of the analyzed gene was normalized to that of GAPDH and described as the mRNA level relative to GAPDH.
Retroviral transduction in mouse T cells
Before retroviral transduction, mouse CD3+ T cells from C57BL/6 mice or CD8+ T cells from OTI TCR C57BL/6 mice were incubated in 2 μg/mL anti-CD3/28-coated plates with 100 U/mL rIL-2 for 48 h. A total of 5 × 10⁶ retroviral packaging cells (Plat-E; Cell Biolabs) were plated overnight in 10-cm2 dishes. Retroviral particles were generated by transfection with retroviral vectors (empty vector, GFP, and TG2) and pCL-Eco packaging vector using Lipofectamine 2000 (Invitrogen). After 48 h, virus supernatants (1 mL) were harvested, mixed with 106 mouse T cells, incubated in 12-well plates coated with 20 μg/mL retronectin (Takara, Otsu, Japan), and centrifuged for 90 min at 2,000 × g at 25°C with 100 U/mL rIL-2. The transduced T cells were maintained with fresh media with rIL-2 and expanded for 5–8 days.
Purification of TG2P
Expression of TG2P in Escherichia coli BL21 (DE3) cells was performed as described for transformation of the aforementioned recombinant plasmids. Expression of TG2P was induced by addition of 0.5 mM isopropyl β-d-1-thiogalactopyranoside to the culture medium overnight at 25°C, and cells were then collected. The cell pellets were resuspended in PBS, sonicated, and centrifuged. After centrifugation, TG2P in the supernatant was purified by affinity chromatography on a His-selected Nickel Affinity Gel (Sigma). The gel was equilibrated with 10 volumes of buffer (50 mM sodium phosphate, pH 8.0 and 0.3 M NaCl) and incubated with the supernatant. The gel was washed with five volumes of wash buffer (50 mM sodium phosphate, pH 8.0, 0.3 M NaCl, and 10 mM imidazole). The TG2P was eluted with increasing concentrations of imidazole up to 250 mM. To remove potential endotoxin contaminants, TG2P was further subjected to the polymyxin B-agarose (Detoxi Gel, Thermo Scientific Inc.) column. Briefly, polymyxin B-agarose column was washed with five volumes of 1% sodium deoxycholate followed by ten volumes of PBS. The eluted TG2P was loaded onto the column and incubated at room temperature for 1 h. The column was then eluted with PBS. TG2P was desalted using PD-10 Sephadex G-25 (Amersham Pharmacia Biotech, Uppsala, Sweden), supplemented with 10% glycerol, separated into aliquots, and flash-frozen at −70°C.
Introduction of TG2P into the cytotoxic CD8+ T cell blasts
T cells were washed and incubated with indicated concentration (1, 2.5, 5, and 10 μM) of TG2P for 4 h at 37°C in serum-free medium. After incubation, the cells were washed in PBS and then resuspended in media.
Determination of cellular F-actin contents
Cells were maintained in serum-free medium for 12 h and incubated with anti-CD3/28 for the indicated times at 37°C. The reactions were terminated by adding 4% paraformaldehyde. Fixed cells were washed once with phosphate-buffered saline (PBS) and resuspended in PBS containing 1% bovine serum albumin and 0.25% Triton X-100 for 5 min. After permeabilization, cells were washed, stained for 30 min with TRITC-phalloidin (Sigma), and then analyzed by flow cytometry.
Conjugation assay
B cells (5 × 10⁵) were incubated with 5 μg/mL SEB or vehicle control for 30 min, washed, and resuspended in RPMI 1650 medium. E0771 or B16F10 cells (5 × 10⁵) were incubated with 10 μg/mL OVA257–264 peptides for 30 min, washed, and resuspended in RPMI 1640 medium. Mouse or human T cells (5 × 10⁵) and target cells (B cells, B16F10, E0771, and Raji B (5 × 10⁵)) were stained with Cell Tracker Green CMFDA and Orange CMRA, respectively, according to the manufacturer’s protocol (Invitrogen). For conjugation, equal volumes of T cells and target cells were mixed and incubated at 37°C. The relative proportion of green, orange, and green-orange events in each tube was determined by two-color flow cytometry using a FACSCanto (BD Biosciences, San Jose, CA) and analyzed with FlowJo software (Treestar, San Carlos, CA). The number of gated events counted per sample was at least 10,000. The percentage of conjugated T cells was determined as the number of dual-labeled (CMFDA- and CMRA-positive) events divided by the number of CMFDA-positive T cells.
Confocal microscopy
To investigate TAGLN2 localization, Jurkat T cells expressing TG2_GFP were transfected with LifeA_RFP and incubated for 30 min with 1 μg/mL SEE-pulsed Raji B cells stained with ICAM-1_Cy5. The cells were then placed on PLL-coated glass and imaged using a 100×, NA 1.40 oil immersion objective on a laser-scanning confocal microscope (FV1000; Olympus, Tokyo, Japan). To evaluate ICAM-1 expression in B16F10 and E0771 cells, cells were detached using 10 mM ethylenediaminetetraacetic acid, stained with anti-ICAM-1-FITC, and observed using a 60×, NA 1.40 oil immersion objective. In some conjugation assays, samples were prepared as described above, and E0771 (5 × 10⁵) cells were stained with CMRA-orange cell tracker for 30 min, washed, and seeded on glass-bottom confocal dishes for 24 h. The next day, EV- or TG2P-treated OTI CD8+ T cells (5 × 10⁵) were stained with CMFDA-green and incubated with cancer cells for 2 h. The unattached cells were removed by washing with warm PBS and observed using a 40×, NA 1.40 oil immersion objective.
Western blotting
Cells were lysed in ice-cold lysis buffer (50 mM Tris-HCl, pH 7.4, containing 150 mM NaCl, 1% Triton X-100, and one tablet of complete protease inhibitors) for 15 min on ice. Cell lysates were centrifuged at 16,000 × g for 30 min at 4°C, and the supernatants were eluted with sodium dodecyl sulfate (SDS) sample buffer (100 mM Tris-HCl, pH 6.8, 4% SDS, and 20% glycerol with bromophenol blue) and heated for 5 min. The proteins were separated by SDS polyacrylamide gel electrophoresis (PAGE) on 10–15% gels and were transferred to nitrocellulose membranes using a Trans-Blot SD semidry transfer cell (Bio-Rad). The membrane was blocked in 5% skim milk (1 h), rinsed, and incubated with the appropriate antibodies in TBS containing 0.1% Tween 20 (TBS-T) and 0.5% skim milk overnight. Excess primary antibody was then removed by washing the membrane three times in TBST. The membrane was then incubated with 0.1 μg/mL peroxidase-conjugated secondary antibodies (anti-rabbit or anti-mouse) for 1 h. After three washes with TBST, bands were visualized using western blotting detection reagents and were then exposed to X-ray film (Kodak, Rochester, NY).
Immunoprecipitation (IP)
Cell lysates were precleared, and supernatants were incubated overnight with antibodies at 4°C, followed by incubation with protein A/G agarose beads (Santa Cruz Biotechnology). Beads were collected, washed with PBS, and resuspended in equal volumes of 5× SDS loading buffer. Immunoprecipitated proteins were separated by SDS-PAGE on 12% gels and analyzed by western blotting, as described above.
Pull-down assay for active Rap1
Active GTP-bound Rap1 levels were measured using an EZ-Detect Rho activation kit according to the manufacturer’s instructions (Thermo Fisher Scientific Inc., Rockford, IL). Briefly, Jurkat T cells expressing GFP or TG2_GFP cells were stimulated with anti-CD3/28 for the indicated times at 37°C, washed once with ice-cold PBS, and lysed in buffer containing 20 mM Tris-HCl, pH 7.4, 150 mM NaCl, 1% Triton X-100, and protease inhibitor cocktail. Samples were incubated on ice for 20 min followed by centrifugation (16,000 × g, 30 min, 4°C). Equivalent amounts of supernatants were incubated with GST-RalGDS-RBD/GSH-beads for GTP-Rap1 for 12 h at 4°C. The beads were washed three times with lysis buffer, and bound proteins were eluted with sample buffer by boiling. Samples were electrophoresed and analyzed by western blotting with anti-Rap1 antibodies.
Flow cytometric analysis
Cells were suspended in PBS containing 2% FBS and stained with fluorescence-conjugated antibodies against mouse ICAM-1 or isotype control for 15 min at room temperature. Cells were then assessed on a FACSCanto instrument (BD Biosciences), and the data were analyzed with FlowJo software (Treestar).
Measurement of cytokine secretion
CD3+ T (1 × 10⁶) or OTI CD8+ T cells (1 × 10⁶ – 1 × 10⁷) were stimulated with SEB-loaded B cells (1 × 10⁶) or OVA-loaded cancer cells (1 × 10⁶). Human CD8+ T or CD19-targeted CAR-T cells (5 × 10⁶) were incubated with Raji B cells (1 × 10⁶). After incubation for the indicated time points, the amounts of mouse of human IL-2, IFNγ, and GZMB in the supernatants were determined by ELISA with Duo Set Mouse ELISA kits (R&D Systems).
In vitro cytotoxicity assay
For in vitro cytotoxic T-cell activity assays, OTI CD8+ T cells (1 × 10⁶ – 1 × 10⁷) were generated and incubated with E0771 or B16F10 cells (1 × 10⁶) in the absence or presence of OVA. After 6 or 24 h, cell-mediated cytotoxicity was determined using a Pierce LDH Cytotoxicity Assay Kit (Thermo Scientific Inc.), and the percent cytotoxicity was calculated according to the manufacturer’s instructions. For flow cytometric cytotoxicity assays, PKH26 (Sigma) was diluted according to the manufacturer’s kit directions. E0771, B16F10, or Raji B cells (1 × 10⁶) were washed in PBS and resuspended in 1 mL diluent C from the kit. The PKH26 was diluted to 4 μM in 1 mL diluent C. Cells were combined with dye, and the tube was inverted several times over 3 min. About 2 mL FBS was added to the tubes, and tubes were inverted continuously for 1 min. Cells were then transferred to 15-mL conical tubes with 4 mL phenol red-free of RPMI 1640 with 10% FBS and washed three times in the same medium. OTI CD8+ T (1 × 10⁶ – 1 × 10⁷), CD8+ T, or CD19-targeted CAR CD8+ T cells (5 × 10⁶) were washed twice in phenol red-free RPMI with 10% FBS, mixed with PKH26-labeled cancer cells (1 × 10⁶), and incubated at 37°C for 4 h. After incubation, 10 μL of a 5 μg/mL solution of 7-AAD was added to the cell suspension for 10 min on ice. Cells were evaluated on a FACSCanto (BD Biosciences), and data were analyzed with FlowJo software (Treestar).
Xenograft model
For the OVA-E0771 tumor model, the fourth mammary fat pads (murine mammary glands) of 8-week-old C57BL/6 female mice were orthotopically injected with 5 × 10⁵ OVA-E0771 cells on day 0. Mice were conditioned with 5 Gy total body irradiation immediately before T-cell transfer. OTI CD8+ T (1 × 10⁷ cells), OTI TG2-CD8+ T, or OTI TG2P-CD8+ T cells were injected into the tail vein on days 7, 10, and 13 after tumor inoculation. Animals were sacrificed 28 days after tumor injection, and tumors were weighed and imaged.
For analysis of the in vivo activity of TG2-loaded CD8+ T cells, OTI CD8+ T, OTI TG2-CD8+ T, or OTI TG2P-CD8+ T cells (1 × 10⁷) were injected into the tail vein on day 14 after tumor inoculation. Two days later, animals were sacrificed, and tumor tissues were extracted. For immunofluorescence, tumor tissues were fixed in 4% paraformaldehyde for 2 h at room temperature, washed with PBS, and dehydrated in 30% sucrose until tumor tissues sunk. Tissues were then cryoprotected with Tissue-Tek OCT (Sakura Finetek, Torrance, CA), and 10 μm cryosections were mounted with Fluorescent Mounting Medium (Dako, Carpinteria, CA). Images were obtained using a 40×, NA 1.40 oil immersion objective on a laser-scanning confocal microscope (FV1000). To compare the amounts of tumor infiltrated CD8+ T cells (OTI CD8+ T (green) and OTI TG2-CD8+ T (green/red) or OTI TG2P-CD8+ T (red) cells, tumor tissues were homogenized in PBS, and cells were evaluated on a FACSCanto instrument (BD Biosciences). Data were analyzed with FlowJo software (Treestar).
For immunohistochemistry (IHC), the extracted tumor tissues were fixed in 4% paraformaldehyde and embedded in paraffin. Tissue slices (5 μm) were incubated with anti-ICAM-1, anti-CD8T, anti-Ki67, anti-GZMB, and anti-INFγ antibodies or TdT-BiOTIn-dUTP mix (100 μl TdT buffer [30 mM Tris, pH 7.2, 140 mM sodium cacodylate, 1 mM cobalt chloride], 30 U TdT, and 0.5 μL BiOTIn-dUTP mix [Boehringer Mannheim, Indianapolis, IN]) followed by diaminobenzidine staining (Dako and R&D Systems), according to the manufacturer’s instructions. TUNEL assays were performed using an In Situ Cell Death Detection kit, AP (Roche, Mannheim, Germany). Microscopy images were analyzed using ImmunoRatio (http://imtmicroscope.uta.fi/immunoratio) or recorded by a pathologist.
Establishment of human CD19-targeted CAR-T cells
Human CD8+ T cells were purified from healthy donor blood samples using EasySep (StemCell Technologies). The purity of each population was confirmed to be more than 95% by flow cytometry. Before lentiviral transduction, isolated human CD8+ T cells were incubated in 2 µg/mL anti-OKT3/CD28-coated culture plates with 100 U/mL rIL-2 for 48 h. A total of 5 × 10⁶ viral packaging cells (Plat-E; Cell Biolabs) were plated overnight in 10-cm2 dishes. Lentiviral particles were generated by transfection with a lentiviral vector (CD19-targeted CAR viral plasmid, CellRapeuticsTM E19828bbz; Creative Biolabs, NY) and packaging vector using Lipofectamine 2000 (Invitrogen). After 48 h, virus supernatants (1 mL) were harvested, mixed with 106 human CD8+ T cell blasts, incubated in 12-well plates with 8 μg/mL polybrene (Sigma) and 100 U/mL rIL-2. The transduced CD8+ T cells were maintained with fresh media with rIL-2 and expanded for 10–13 days.
Statistical analysis
Mean values were calculated using data taken from at least three independent experiments conducted on different days. Where significance testing was performed, unpaired Student’s t tests and one-way analysis of variance tests were used. Differences between groups were considered significant when the P value was less than 0.05.
Disclosure of Potential Conflicts of Interest
No potential conflicts of interest were disclosed.
Authors’ Contributions
B.-N.J., H.-R.K., and C.-D.J. designed and performed experiments, analyzed data and wrote the manuscript; Y.-S.C., B.-R.N., H.P., C.H., Y.F., H.O., C.-H.K. performed experiments. All authors revised the manuscript.
Supplemental Material
Download MS Word (869.2 KB)Acknowledgments
This work was supported by the Creative Research Initiative Program (2015R1A3A2066253) and the Basic Science Program (2015R1A2A1A15052658) through National Research Foundation (NRF) grants funded by the Ministry of Science, ICT & Future Planning (MSIP), and Basic Science Program (2013R1A6A3A04064259) through National Research Foundation (NRF) grants funded by the Ministry of Education (MOE), Korea, and the GIST Research Institute (GRI) in 2017.
Supplementary material
Supplemental data for this article can be accessed here.
References
- Intlekofer AM, Thompson CB. At the bench: preclinical rationale for CTLA-4 and PD-1 blockade as cancer immunotherapy. J Leukoc Biol. 2013;94(1):25–39. doi:10.1189/jlb.1212621.
- Sharma P, Allison JP. The future of immune checkpoint therapy. Science. 2015;348(6230):56–61. doi:10.1126/science.aaa8172.
- Yao S, Zhu Y, Chen L. Advances in targeting cell surface signalling molecules for immune modulation. Nat Rev Drug Discovery. 2013;12(2):130–146. doi:10.1038/nrd3877.
- June CH, Maus MV, Plesa G, Johnson LA, Zhao Y, Levine BL, Grupp SA, Porter DL. Engineered T cells for cancer therapy. Cancer Immunol, ImmunoTher. 2014;63(9):969–975. doi:10.1007/s00262-014-1568-1.
- Rabinovich GA, Gabrilovich D, Sotomayor EM. Immunosuppressive strategies that are mediated by tumor cells. Annu Rev Immunol. 2007;25(1):267–296. doi:10.1146/annurev.immunol.25.022106.141609.
- Kershaw MH, Westwood JA, Slaney CY, Darcy PK. Clinical application of genetically modified T cells in cancer therapy. Clin Transl Immunol. 2014;3(5):e16. doi:10.1038/cti.2014.7.
- Svane IM, Verdegaal EM. Achievements and challenges of adoptive T cell therapy with tumor-infiltrating or blood-derived lymphocytes for metastatic melanoma: what is needed to achieve standard of care? Cancer Immunol, ImmunoTher. 2014;63(10):1081–1091. doi:10.1007/s00262-014-1580-5.
- Grakoui A. The immunological synapse: a molecular machine controlling T cell activation. Science. 1999;285(5425):221–227. doi:10.1126/science.285.5425.221.
- Davis DM, Chiu I, Fassett M, Cohen GB, Mandelboim O, Strominger JL. The human natural killer cell immune synapse. Proc Natl Acad Sci USA. 1999;96(26):15062–15067. doi:10.1073/pnas.96.26.15062.
- Meuer SC, Hussey RE, Fabbi M, Fox D, Acuto O, Fitzgerald KA, Hodgdon JC, Protentis JP, Schlossman SF, Reinherz EL. An alternative pathway of T-cell activation: a functional role for the 50 kd T11 sheep erythrocyte receptor protein. Cell. 1984;36(4):897–906. doi:10.1016/0092-8674(84)90039-4.
- Boise LH, Minn AJ, Noel PJ, June CH, Accavitti MA, Lindsten T, Thompson CB. CD28 costimulation can promote T cell survival by enhancing the expression of Bcl-xL. Immunity. 1995;3(1):87–98. doi:10.1016/1074-7613(95)90161-2.
- Radvanyi LG, Shi Y, Vaziri H, Sharma A, Dhala R, Mills GB, Miller RG. CD28 costimulation inhibits TCR-induced apoptosis during a primary T cell response. J Immunol. 1996;156(5):1788–1798.
- Samstag Y, Eibert SM, Klemke M, Wabnitz GH. Actin cytoskeletal dynamics in T lymphocyte activation and migration. J Leukoc Biol. 2003;73(1):30–48. doi:10.1189/jlb.0602272.http.
- van Kooyk Y, van Vliet SJ, Figdor CGC. The actin cytoskeleton regulates LFA-1 ligand binding through avidity rather than affinity changes. J Biol Chem. 1999;274(38):26869–26877. doi:10.1074/jbc.274.38.26869.
- Lees-Miller JP, Heeley DH, Smillie LB, Kay CM. Isolation and characterization of an abundant and novel 22-kDa protein (SM22) from chicken gizzard smooth muscle. J Biol Chem. 1987;262(7):2988–2993.
- Shapland C, Hsuan JJ, Totty NF, Lawson D. Purification and properties of transgelin: a transformation and shape change sensitive actin-gelling protein. J Cell Biol. 1993;121(5):1065–1073. doi:10.1083/jcb.121.5.1065.
- Na B-R, Kim H-R, Piragyte I, Oh H-M, Kwon M-S, Akber U, Lee H-S, Park D-S, Song WK, Park Z-Y, et al. TAGLN2 regulates T cell activation by stabilizing the actin cytoskeleton at the immunological synapse. J Cell Biol. 2015;209(1):143–162. doi:10.1083/jcb.201407130.
- Katagiri K, Hattori M, Minato N, Kinashi T. Rap1 functions as a key regulator of T-cell and antigen-presenting cell interactions and modulates T-cell responses. Mol Cell Biol. 2002;22(4):1001–1015. doi:10.1128/MCB.22.4.1001.
- Katagiri K, Maeda A, Shimonaka M, Kinashi T. RAPL, a Rap1-binding molecule that mediates Rap1-induced adhesion through spatial regulation of LFA-1. Nat Immunol. 2003;4(8):741–748. doi:10.1038/ni950.
- Sebzda E, Bracke M, Tugal T, Hogg N, Cantrell DA. Rap1A positively regulates T cells via integrin activation rather than inhibiting lymphocyte signaling. Nat Immunol. 2002;3(3):251–258. doi:10.1038/ni765.
- Kamimura K, Suda T, Zhang G, Liu D. Advances in gene delivery systems. Pharmaceut Med. 2011;25(5):293–306. doi:10.1007/BF03256872.
- van den Berg A, Dowdy SF. Protein transduction domain delivery of therapeutic macromolecules. Curr Opin Biotechnol. 2011;22(6):888–893. doi:10.1016/j.copbio.2011.03.008.
- Pandit S, Zhou Y, Shiue L, Coutinho-Mansfield G, Li H, Qiu J, Huang J, Yeo GW, Ares M, Fu XD. Genome-wide analysis reveals SR protein cooperation and competition in regulated splicing. Mol Cell. 2013;50(2):223–235. doi:10.1016/j.molcel.2013.03.001.
- Piragyte I, Jun C-D. Actin engine in immunological synapse. Immune Netw. 2012;12(3):71–83. doi:10.4110/in.2012.12.3.71.
- Ritter AT, Angus KL, Griffiths GM. The role of the cytoskeleton at the immunological synapse. Immunol Rev. 2013;256(1):107–117. doi:10.1111/imr.12117.
- Kim H-R, Lee H-S, Lee K-S, Jung ID, Kwon M-S, Kim C-H, Kim S-M, Yoon M-H, Park Y-M, Lee S-M, et al. An essential role for TAGLN2 in phagocytosis of lipopolysaccharide-activated macrophages. Sci Rep. 2017;7(1):8731. doi:10.1038/s41598-017-09144-x.
- Wang C, Morley SC, Donermeyer D, Peng I, Lee WP, Devoss J, Danilenko DM, Lin Z, Zhang J, Zhou J, et al. Actin-bundling protein L-plastin regulates T cell activation. J Immunol. 2010;185(12):7487–7497. doi:10.4049/jimmunol.1001424.
- Eibert SM, Lee K-H, Pipkorn R, Sester U, Wabnitz GH, Giese T, Meuer SC, Samstag Y. Cofilin peptide homologs interfere with immunological synapse formation and T cell activation. Proc Natl Acad Sci USA. 2004;101(7):1957–1962. doi:10.1073/pnas.0308282100.
- Gimona M, Mital R. The single CH domain of calponin is neither sufficient nor necessary for F-actin binding. J Cell Sci. 1998;111(13):1813–1821.
- Comrie WA, Burkhardt JK. Action and traction: cytoskeletal control of receptor triggering at the immunological synapse. Front Immunol. 2016;7:(MAR):1–25. doi:10.3389/fimmu.2016.00068.
- Reina M, Espel E. Role of LFA-1 and ICAM-1 in cancer. Cancers. 2017;9(12):1–14. doi:10.3390/cancers9110153.
- Mukai S, Kagamu H, Shu S, Plautz GE. Critical role of CD11a (LFA-1) in therapeutic efficacy of systemically transferred antitumor effector T cells. Cell Immunol. 1999;192:122–132. doi:10.1006/cimm.1998.1439.
- Dustin ML, Springer TA. T-cell receptor cross-linking transiently stimulates adhesiveness through LFA-1. Nature. 1989;341(6243):619–624. doi:10.1038/341619a0.
- Kandula S, Abraham C. LFA-1 on CD4+ T cells is required for optimal antigen-dependent activation in vivo. J Immunol. 2004;173(7):4443–4451. doi:10.4049/jimmunol.173.7.4443.
- Park EJ, Peixoto A, Imai Y, Goodarzi A, Cheng G, Carman CV, Von Andrian UH, Shimaoka M. Distinct roles for LFA-1 affinity regulation during T-cell adhesion, diapedesis, and interstitial migration in lymph nodes. Blood. 2010;115(8):1572–1581. doi:10.1182/blood-2009-08-237917.
- Dippold W, Wittig B, Schwaeble W, Mayet W, Meyer zum Buschenfelde KH. Expression of intercellular adhesion molecule 1 (ICAM-1, CD54) in colonic epithelial cells. Gut. 1993;34(11):1593–1597. doi:10.1136/gut.34.11.1593.
- Wimmenauer S, Keller H, Ruckauer KD, Rahner S, Wolff-Vorbeck G, Kirste G, von Kleist S, Farthman EH. Expression of CD44, ICAM-1 and N-CAM in colorectal cancer. Correlation with the tumor stage and the phenotypical characteristics of tumor- infiltrating lymphocytes. Anticancer Res. 1997;17(4A):2395–2400.
- Lu W, Dong Z, Donawho C, Fidler IJ. ICAM-1 expression and the soluble ICAM-1 level for evaluating the metastatic potential of gastric cancer. Int J Cancer. 2002;100(4):486–490. doi:10.1002/ijc.10514.
- Tachimori A, Yamada N, Sakate Y, Yashiro M, Maeda K, Ohira M, Nishino H, Hirakawa K. Up regulation of ICAM-1 gene expression inhibits tumour growth and liver metastasis in colorectal carcinoma. Eur J Cancer. 2005;41(12):1802–1810. doi:10.1016/j.ejca.2005.04.036.
- Basingab FS, Ahmadi M, Morgan DJ. IFNγ-dependent interactions between ICAM-1 and LFA-1 counteract prostaglandin E2-mediated inhibition of antitumor CTL responses. Cancer Immunol Res. 2016;4(5):400–411. doi:10.1158/2326-6066.CIR-15-0146.
- Schröder C, Witzel I, Müller V, Krenkel S, Wirtz RM, Jänicke F, Schumacher U, Milde-Langosch K. Prognostic value of intercellular adhesion molecule (ICAM)-1 expression in breast cancer. J Cancer Res Clin Oncol. 2011;137(8):1193–1201. doi:10.1007/s00432-011-0984-2.
- Dezfouli S, Hatzinisiriou I, Ralph SJ. Enhancing CTL responses to melanoma cell vaccines in vivo: synergistic increases obtained using IFNγ primed and IFNβ treated B7-1 + B16-F10 melanoma cells. Immunol Cell Biol. 2003;81(6):459–471. doi:10.1046/j.0818-9641.2003.01189.x.
- Harada H, Kizaka-Kondoh S, Hiraoka M. Antitumor protein therapy; application of the protein transduction domain to the development of a protein drug for cancer treatment. Breast Cancer. 2006;13(1):16–26. doi:10.2325/jbcs.13.16.
- Eggermont LJ, Paulis LE, Tel J, Figdor CG. Towards efficient cancer immunotherapy: advances in developing artificial antigen-presenting cells. Trends Biotechnol. 2014;32(9):456–465. doi:10.1016/j.tibtech.2014.06.007.