
ABSTRACT
Pancreatic adenocarcinoma (PAC) has a poor prognosis. One treatment approach, investigated here, is to reinforce antitumor immunity. Dendritic cells (DCs) are essential for the development and regulation of adaptive host immune responses against tumors. A major role for DCs may be as innate tumoricidal effector cells. We explored the efficacy of vaccination with immature (i)DCs, after selecting optimal conditions for generating immunostimulatory iDCs. We used two models, C57BL/6Jrj mice with ectopic tumors induced by the PAC cell line, Panc02, and genetically engineered (KIC) mice developing PAC. Therapeutic iDC-vaccination resulted in a significant reduction in tumor growth in C57BL/6Jrj mice and prolonged survival in KIC mice. Prophylactic iDC-vaccination prevented subcutaneous tumor development. These protective effects were long-lasting in Panc02-induced tumor development, but not in melanoma. iDC-vaccination impacted the immune status of the hosts by greatly increasing the percentage of CD8+ T-cells, and natural killer (NK)1.1+ cells, that express granzyme B associated with Lamp-1 and IFN-γ. Efficacy of iDC-vaccination was CD8+ T-cell-dependent but NK1.1+ cell-independent. We demonstrated the ability of DCs to produce peroxynitrites and to kill tumor cells; this killing activity involved peroxynitrites. Altogether, these findings make killer DCs the pivotal actors in the beneficial clinical outcome that accompanies antitumor immune responses.
We asked whether efficacy can be improved by combining DC-vaccination with the FOLFIRINOX regimen. Combined treatment significantly increased the lifespan of KIC mice with PAC. Prolonged treatment with FOLFIRINOX clearly augmented this beneficial effect. Combining iDC-vaccination with FOLFIRINOX may therefore represent a promising therapeutic option for patients with PAC.
Introduction
Cancer immunotherapy aims to generate or to reinforce the antitumor immune responses.Citation1 This requires overcoming immunosuppression applied by tumor cells and the tumor microenvironment (for example by using immune checkpoint inhibitors (ICIs)Citation2 and adoptive cell transfer (ACT).Citation3 However at least around 50% of patients with cancer do not respond to ICIs.Citation4 Moreover, immune responses causing severe-to fatal side effects following treatment with ICIs and ACTs are a concern.Citation5 Because dendritic cells (DCs) are the cardinal players in the induction of immune responses, strategies that harness them have been developed as a basis for antitumor vaccination.Citation6–Citation12 With that aim, DCs are used once loaded ex vivo with tumor-associated antigens (TAAs) from various sources, and matured with defined cytokine cocktails.Citation13 Another approach consists of loading DC-derived exosomes (Dex) with TAAs.Citation14 To date, DC- and Dex-based immunotherapies are reported to boost anticancer immunity with some beneficial clinical effects.Citation14 Alternatively, TAAs can be delivered to DCs in vivo.Citation8,Citation15 Importantly, DC-vaccination has proven to be feasible and safe in multiple clinical trials.Citation9,Citation10 The best proof of concept that DC-based vaccines may improve the clinical outcome remains Sipuleucel-T (Provenge®), approved since 2010 for the treatment of metastatic hormone-refractory prostate cancer.Citation16 Phase I, II, and III clinical trials that test DC-vaccination strategies in various cancer types are ongoing, for reviews, see refs.Citation10,Citation12,Citation14 The ongoing trials (begun in 2014–2017) encompass 24% of glioblastoma/high-grade glioma, 12% of melanoma and 6% of PAC.Citation10 In trials that assessed overall survival (OS), DC-vaccines increased OS by around 20% (importantly the threshold for clinically meaningful improvement).Citation9 Moreover vaccination with TAA-loaded DCs can generate antitumor responses mainly through natural killer (NK) and cytotoxic T lymphocytes, as widely reported in humansCitation17 and in mice.Citation18,Citation19
Another promising strategy exploits unloaded and mature ex vivo autologous DCs injected in combination with cytokine-induced killer cells, chemotherapy, and/or radiotherapy.Citation20 In animal models, a body of evidence shows the ability of unloaded mature (m)DCs to exert protection against challenge with various kinds of tumor cells and to prevent the development of tumor metastases.Citation21–Citation25 Mature unloaded DCs were shown to be pivotal in inducing antitumor immunity, dialoging with NK cells, and/or CD4+ T-cells, and/or CD8+ T-cells in humans and in murine models.Citation19 In fact, in the initial clinical studies, immature or ‘semi-mature’ monocyte-derived DCs were used.Citation26 Subsequent trials demonstrated the superiority of mDCs over their immature counterparts in terms of immunogenicity and clinical outcome in humans and mice.Citation19,Citation27 Mature DCs, unloaded or loaded with antigen have the advantage of bypassing tolerance while immature (i)DCs may induce tolerance under certain circumstances. Whereas iDCs are equipped with high phagocytic activity, mDCs have a high cytokine-producing capacity. iDCs do not express sufficient amounts of MHC II and costimulatory molecules on the cell surface, and do not secrete sufficient amounts of cytokines to effectively activate T-cells. Moreover they secrete insufficient amounts of chemokines, such as CCR7, to efficiently migrate. They are therefore capable of producing immunological tolerance, and could even promote antigen-specific tolerance when used as DC-vaccines.Citation10,Citation15 However, Kolstad et al.Citation28 reported that intranodal iDC-injection induces antitumor immunity and regression of disseminated follicular lymphoma. In animal models, numerous reports demonstrate that iDCs have antitumor clinical effects.Citation23,Citation29–Citation31 In addition, Dex from iDCs reduced lung metastases induced by B16F10 melanoma.Citation32 Importantly, iDCs, which may phagocytize both necrotic and apoptotic tumor cells depending on immunogenic “eat-me” signals, can be matured in vivo to generate efficient antitumor immunity. Last but not least iDCs can be endowed with tumoricidal properties.Citation33 For these reasons, iDC-vaccination keeps the momentum as a valuable line of investigation.
PAC is one of the most aggressive malignancies with a huge disease burden worldwide, with a 5-year survival rate below 5%.Citation34 Early metastatic spread and late diagnosis prohibits resection and results in this high mortality rate. The desmoplastic reaction is an important histological hallmark of PAC.Citation35 This acts as a mechanical barrier to immune cells, and prevents effective delivery of anticancer agents to tumor cells; it also supports development of an anti-angiogenic, hypoxic, and immunosuppressed tumor microenvironment. Moreover, PAC expresses low level of MHC molecules making its recognition by T-cells difficult.
Cancer vaccines for the treatment of PAC are currently investigated. Recent reviews summarize the clinical trials of DC-based cancer vaccines for patients with PAC.Citation36 In murine models, under prophylactic conditions, vaccinating mice with mDCs pulsed with heat-treated lysate of a PAC line cells (Panc02)Citation37 and irradiated Panc02Citation38 resulted in increased survival. In therapeutic conditions, injection of Panc02-RNA-transfected DC into transplanted orthotopic tumors resulted in tumor regression.Citation39 We previously reported the efficacy of vaccination against PAC using DCs loaded with a TAA, an onco-glycoprotein (a bile salt-dependent lipase), and mature, implying cytotoxic T lymphocyte (CTL) recognizing the specific TAA.Citation25 Moreover, we showed that this TAA is internalized by human DCs, induces their functional maturation and, efficiently processed, promotes T-cell activation.Citation40,Citation41 Here, we investigate the ability of iDCs to induce both immune responses and resistance to PAC.
Given the limited successes of immunotherapeutic trials so far, most current clinical and preclinical trials combine immunotherapy with cytotoxic drugs. The treatment of patients with metastatic PAC with the folinic acid, fluorouracil, irinotecan, and oxaliplatin protocol (FOLFIRINOX) significantly prolonged the median OS compared to the gemcitabine group (11.1 vs. 6.8 months).Citation42 The treatment of patients with locally advanced PAC with FOLFIRINOX resulted in a median OS that was 24.2 months longer than that of patients in the gemcitabine group (6–13 months).Citation43,Citation44
In this study, in order to develop DC-based antitumor immunotherapy, we explored the ideal conditions required to generate potent immunostimulatory immature DCs with tumoricidal functions, which are key factors in this context, and looked to exploit these iDCs in combination with FOLFIRINOX.
Results
Characteristics of ‘immature’ vaccinating DCs
We firstly determined the optimal conditions for raising iDCs appropriate for vaccination. Changes in DC culture conditions (type and composition of cytokines) and mode of isolation can impact the signaling pathways that control expression of defined molecules. In particular, the status of DCs with ‘spontaneous maturation’, which might result from positive selection of DC preparations, or other factors such as the presence and the concentration of IL-4Citation45, can induce experimental bias. To use iDCs as vaccines, it was therefore crucial to delineate their characteristics. In our culture conditions, CD11b+CD11c+ DCs at day (d)5–7 were characterized by MHC-IIlo, CD80lo, CD86−/lo, and CD40−/lo molecule expression [percentages of fluorescent cells and median fluorescence intensity (MFI)] ( and ()) and corresponded to an ‘immature’ status, which was evidenced by their capacity to internalize exogenous A488-ovalbumin. This function was abolished at 0°C or after LPS-induced maturation (Supplementary Fig. S1). Unlike their immature counterparts, DCs cultured in the presence of stimuli such as the TLR-4 ligand LPS and CD40 ligation presented enhanced expression of MHC class II and costimulatory molecules. These DCs were defined as mDCs (, lower panel). CD8α and Ly6G were not, or were only weakly, detected ().
Figure 1. Characteristics of immature vaccinating DCs. (A) Analysis of cell-surface molecules on immature (i)DCs versus mature (m)DCs using flow cytometry. White histograms represent non-specific binding using control isotype antibodies (Ab), and blue histograms specific Ab as indicated. (B) Effects of IL-4, added either one day before the maturation (day 6: d6) or at the beginning of the culture (d0), on iDC and mDC cell-surface molecules. Percentage of fluorescent cells and median fluorescence intensity (MFI, in brackets) are shown. Value of isotype is deduced from that of each corresponding Ab unless indicated. (C) Effects of IL-4 on cytokine secretion by iDCs and mDCs. Culture supernatants from iDCs (medium), from DCs with IL-4, added either at d6 or at d0, and from mDCs (LPS+ CD40L) were collected on d7 for cytokine detection using ELISA assays. IL-12 and IL-15/IL-15 R production is presented as mean ± SEM of four experiments. (*P < 0.05; Wilcoxon-Mann Whitney test).
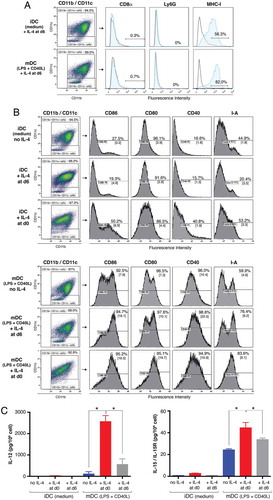
In most studies, IL-4, thought to suppress the macrophage/granulocyte outgrowth and to enhances the final degree of DC differentiationCitation46 in human DC culture and thus usually included, is also added to murine DCs with GM-CSF at d0.Citation18,Citation30,Citation37 Some groups, however, followed the pioneering protocol developed by Inaba et al.Citation47 in which IL-4 is not added, or is added at the end of the culture, with the maturation agents.Citation48 In view of the effects of IL-4 on DC biology and in order to select the best conditions for vaccination, we compared membrane molecule expression, cytokine production, and cell proliferation of DCs cultured in GM-CSF with IL-4 (added at d0 and at d6) with those of DCs cultured in GM-CSF alone. IL-4 added to iDCs at d0 significantly increased the expression of CD86 compared to IL-4 added at d6 or to no IL-4 ( upper panel; Supplementary Fig. S2, which shows the statistical analysis performed on pooled data from five experiments) and that of CD40. It had also a tendency to increase the expression of I-A compared to IL-4 added at d6 or to no IL-4. Altogether these results are in agreement with the finding that IL-4 is an enhancer of the spontaneous maturation of DCs.Citation45,Citation48,Citation49 Thus adding IL-4 only one day before the end of the culture therefore appeared to be the best option to obtain CD11b+ CD11c+ immature DCs characterized by MHC-IIlo, CD80lo, CD86−/lo, and CD40−/lo molecule expression, and MCP-1 production.Citation25 Their mDC counterparts presented enhanced expression of MHC class II and costimulatory molecules, and produced IL-12, IL-15, and IL-18, in addition to MCP1 and RANTES, as previously reported.Citation25
Presence of IL-4 during the maturation of DCs induced by LPS and CD40L did not appear to significantly impact the expression of any studied membrane markers.
Proliferation of iDC progenitors was hampered by the presence of IL-4 from d0 in comparison to DCs cultured without IL-4 (62.8 ± 5% cell recovery; mean ± SEM of seven experiments; P = 0.001; Wilcoxon-Mann Whitney test; data not shown). These results are in line with data from Yin et al.Citation50 In contrast, IL-4 added 24h before the end of the culture boosted cell proliferation (134.8 ± 21%; mean ± SEM of six experiments). Lastly, upon maturation, DCs produced IL-12- and IL-15. Cytokine production significantly increased when IL-4 was added either at d0, or with maturation agents (d5 or d6), though to a lesser extent ()). Enhanced IL-12 production due to IL-4 is in agreement with Hochrein’s findings.Citation46 Immature DCs secreted no, or low levels of, IL-12 and low levels of IL-15. We also detected small amounts of IL-18 in both the presence (d0; 24.95 ± 12.5 pg/10Citation6 cells) and absence (9.8 ± 2.5 pg/10Citation6 cells) of IL-4 (mean of four experiments, P = 0.38; data not shown). These low levels of IL-18 are consistent with the observation that IL-18 secretion may be restricted to the synaptic cleft.Citation51
Based on the above results, we reasoned that IL-4 should be added to iDC culture, but only 24h before the end of the culture to prevent the partial maturation of DCs. Any partial maturation would be inappropriate for the vaccine preparations. We postulate that iDCs generated in these well-defined conditions are able in vivo, once mature, to secrete key cytokines in the activation of innate and adaptive immune responses.Citation52–Citation56 Thus these iDCs are expected to play a central role in innate and adaptive anticancer clinical responses.
Vaccination with iDCs hampers tumor development induced by Panc02 PAC cells and promotes innate and adaptive immune responses
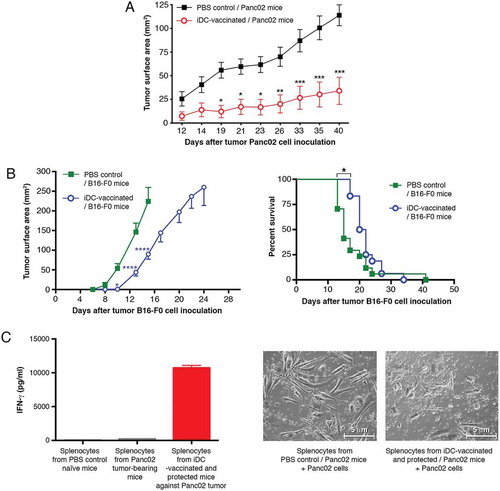
We initiated preclinical trials of antitumor iDC-vaccination. Control Panc02-recipient mice injected with PBS developed large tumors (mean surface area of 114 ± 11 mmCitation2) at d40 (). In contrast, three vaccinations with iDCs conferred resistance to subsequent Panc02 challenge (34 ± 14 mmCitation2 at termination date; P < 0.001). Striking protection from tumor growth occurred, as six iDC-vaccinated mice out of ten remained tumor-free, indicating the high capacity of DC-vaccination to increase survival. We next explored the capacity of iDCs to vaccinate against melanoma B16-F0. The left panel of shows a significant delay in melanoma development; the right panel shows Kaplan-Meier survival curves with a significant extension of survival in iDC-vaccinated mice vs controls. However, none of the iDC-vaccinated mice survived melanoma. The culture supernatants of splenocytes from protected iDC-vaccinated mice contained copious amounts of IFN-γ (10.7 ± 0.3 ng/ml; four experiments), while there was no IFN-γ in the culture supernatants of control groups (naïve mice and Panc02 tumor-bearing mice) (). Co-culturing splenocytes with tumor cells did not impact the amount of secreted IFN-γ (data not shown). Of note, Panc02 cells displayed an abnormal round shape when cultured with splenocytes from iDC-vaccinated mice, illustrated in (right panel), suggesting that Panc02 cells were targets of cytotoxic activities.
Figure 2. Prophylactic iDC-vaccination in Panc02 pancreatic adenocarcinoma and B16-F0 melanoma models. (A) Prophylactic vaccination against pancreatic tumor cells. C57BL/6Jrj mice were either vaccinated sc with iDCs, three times at weekly intervals or received PBS (control mice) (n = 10 mice/group). Four days after the third iDC-injection, mice were challenged sc with Panc02 in the contralateral flank. Experiments were performed four times with groups of 6–9 mice, with similar results. Data are expressed as mean tumor surface area ± SEM. Six mice vaccinated with iDCs remained free of Panc02-induced tumors. Comparisons between groups were made by two-way ANOVA followed by a Bonferroni test (*P < 0.05, **P < 0.01, ***P < 0.001). (B) Prophylactic vaccination against melanoma cells. The graph (left panel) shows the mean tumor surface area ± SEM of pooled data from two experiments, with the PBS-control group (n = 17) and the iDC-vaccinated group (n = 18), both challenged with B16-F0. The graph (right panel) shows a Kaplan-Meier survival curve from mice that received PBS (controls) or iDCs followed by B16-F0 inoculation (*P = 0.04; log-rank Mantel-Cox test). (C, left panel) IFN-γ secretion. Culture supernatants of splenocytes were collected after 4 days for IFN-γ detection (mean ± SEM of four experiments). (C, right panel) Images of cells after 4 days of co-culture. Co-cultures of splenocytes with tumor cells were examined using a phase-contrast microscope (x200). Panc02 cultured with splenocytes from PBS-treated mice bearing tumors exhibit their usual spindled shape; Panc02 cultured with splenocytes from iDC-vaccinated and protected mice show dramatic changes in cell morphology and density.
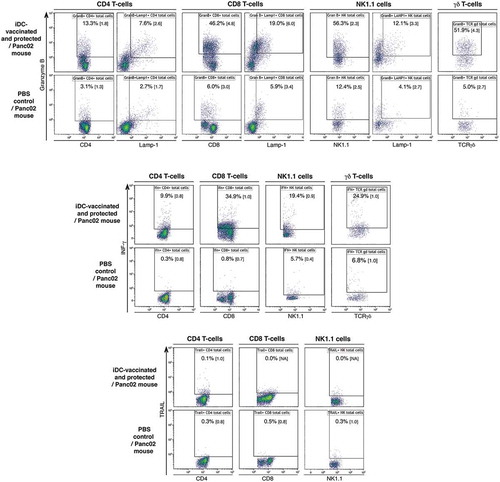
To assess the immune status of iDC-vaccinated mice, we cultured splenocytes for 4 days. We found a significant increase in the percentage of cells expressing granzyme B and IFN-γ in CD8+ T-cells, CD4+ T-cells, natural killer (NK)1.1+ cells, and γδ T-cells in iDC-vaccinated and protected mice compared to control Panc02 recipients (; the statistical analyses are presented in Supplementary Fig. S3). Expression of Lamp-1 was associated with about 50% of granzyme B+ CD8+ T-cells. We did not observe any increases in cell subpopulations expressing TRAIL. Next we examined lymphoblasts within CD3+CD8+ T-cell populations gated according to their sizes. Within the CD3+CD8+ lymphoblast population (about 30% of total CD3+CD8+ T-cells), cells expressing granzyme B, granzyme B/Lamp-1 or IFN-γ largely dominated, as expected (Supplementary Fig. S3). No or very few lymphoblasts were found in splenocyte cultures from PBS control/Panc02 mice. Thus, the cytokine–producing potential of our mDCs indicate they are endowed with a unique capability to efficiently activate anticancer effector cells such as Th cells, CTL, NK cells, and γδ T-cells.
Figure 3. Immune status of iDC-vaccinated mice. Spleens from iDC-vaccinated and protected mice, and from Panc02 tumor-bearing control mice, were collected on d18. Intracellular expression of granzyme B, Lamp-1, IFN-γ and TRAIL in CD45+CD3+CD4+ and CD8+ T-cells, CD45+CD3− NK1.1+ cells and γδ T-cells was determined after 4 days of culture. Percentage of fluorescent cells and MFI (in brackets) are shown. Value of isotype is deduced from that of each corresponding Ab. Representative of four experiments.
Vaccination with iDCs establishes long-term protection against panc02-induced tumor development
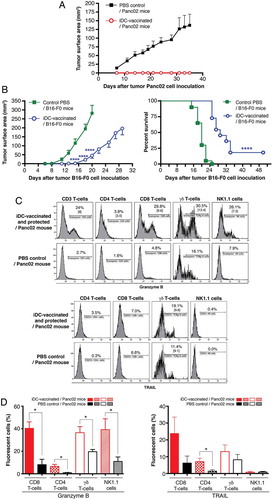
To evaluate the ability of iDCs to establish long-term protection against tumor development, iDC-vaccinated and fully protected mice (depicted in ) were re-challenged with either Panc02 or melanoma B16-F0, 38 days after the first Panc02 inoculation. Whereas control mice inoculated with Panc02 developed large tumors (surface area mean: 137 ± 31 mmCitation2 at d35), vaccinated mice showed long-term survival without tumors for at least 54 days ()). Interestingly, upon challenge with melanoma B16-F0, Panc02-resistant mice exhibited a significantly delayed development of tumors in comparison with B16-F0 controls, which all died by d24. Only one mouse out of 11 iDC-vaccinated mice remained tumor-free until the termination date; the survival curves are significantly different ()). Thus, iDC-vaccination mainly established a striking long-term protection against Panc02 re-challenge. Moreover, compared to Panc02 recipients, the iDC-vaccinated and protected recipients re-challenged with Panc02 displayed significant expansion of CD8+ T-cells, γδ T-cells, and NK1.1+ cells that express granzyme B, assessed following four-day culture of splenocytes ( and ()). Lastly TRAIL expression significantly increased on CD4+ T-cells whereas its expression only slightly increased on CD8+ T-cells and γδ T-cells ()).
Figure 4. Long-term protection against pancreatic tumor cells and melanoma cells. Mice receiving prophylactic iDC-vaccination and remaining tumor-free were challenged after 38 days with (A) Panc02 (n = 7) or (B) B16-F0 (n = 11), along with respective controls injected with Panc02 (n = 5, representative of three experiments) or B16-F0 (n = 20, pool of two experiments). Data are expressed as mean tumor surface area ± SEM. Comparisons between groups were made by two-way ANOVA followed by a Bonferroni test. The graph (right panel) shows Kaplan-Meier survival curves from mice that received PBS (controls) or iDCs followed by B16-F0 inoculation (****P = 0.0001; log-rank Mantel-Cox test). (C) Immune status of iDC-vaccinated mice with long-term protection. Twenty-four days after the second challenge with Panc02, splenocytes were collected and the expression of granzyme B and TRAIL were determined after four-day culture. (D) Statistical analyses of results from 3–4 experiments. (*P < 0.05; Wilcoxon-Mann Whitney test).
Vaccination with iDCs treats established tumors
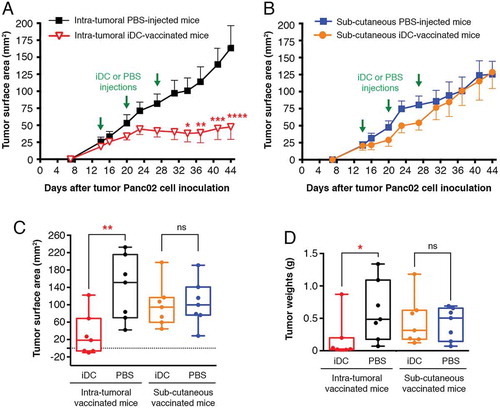
Mice bearing palpable Panc02 tumors received DCs either via subcutaneous (sc) or intratumoral injection. Immunotherapy efficacy was demonstrated by the significantly reduced sizes and weights of tumors in intratumorally iDC-vaccinated mice (47.6 ± 18.4 mmCitation2; 0.168 ± 0,12 g at the termination date) compared to those in PBS-treated controls (163.5 ± 32 mmCitation2; 0.613 ± 0.17 g) ( and (); Supplementary Fig. S4). Tumor growth rate was significantly reduced in 6 out of 7 intratumoral iDC-recipients compared to PBS-controls (); tumor regression (71% reduction in surface area) was obtained in 85.7% of intratumoral iDC-recipients. In contrast, there was no significant difference between the sc DC-vaccinated group (120 ± 22 mmCitation2, 0.450 ± 0.14 g) and the PBS-control group (125 ± 18,9 mmCitation2, 0.420 ± 0.09 g) ( and (); Supplementary Fig. S4). Thus intratumoral injection of iDCs is more effective in treating established tumors than sc injection.
Figure 5. Therapeutic iDC-vaccination. Fourteen days after challenge with Panc02 (once a palpable nodule had formed), mice were injected (A) intratumorally (n = 7) or (B) sc (n = 7) with iDCs three times at weekly intervals or received PBS (control mice, n = 7). Comparisons between groups were made by two-way ANOVA followed by a Bonferroni test (*P < 0.05, **P < 0.01, ***P < 0.001, ****P < 0.0001). (C) Comparisons of the tumor surface areas. Measurements at day 14 were subtracted from those at day 44 (termination date). (**P < 0.01; ns, not significant; Wilcoxon-Mann Whitney test). See Supplementary Fig. S4 (pooled data from two experiments). (D) Comparisons of the weights of the tumors excised at the termination date (*P < 0.05; Wilcoxon-Mann Whitney test). See also Supplementary Fig. S4 (pooled data from two experiments).
Cytotoxic properties of DCs and molecular candidates involved in the interactions with tumor cells
To elucidate the mechanisms by which DCs could act on tumor cells, we envisioned several approaches. Numerous articles support the notion that, as well as acting to potently induce immune responses, DCs can also have a central role as innate tumoricidal effector cells. NO and the death receptor ligands FasL, TRAIL, and TNF-α are involved in this direct cytotoxicity.Citation33
Peroxynitrite production by DCs
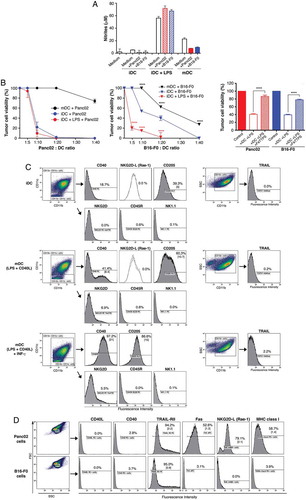
NO, reactive oxygen species (ROS), and their products are potential effector molecules released by immune cells to eliminate pathogens or tumor cells. The critical role of NO in DC cytotoxicity is well documented.Citation33 Indeed, we found high levels of nitrites, principal NO metabolites, in the supernatants of iDCs cultured with LPS, either in the absence or presence of tumor cells (), in agreement with Fraszczak’s findings.Citation57 In contrast, the culture supernatants of iDCs and fully mature DCs contained low levels of nitrites. Very low levels of nitrites (0.53 μM, data not shown) were detected in tumor cell supernatants.
Figure 6. Cytotoxic properties of DCs and molecules involved in interactions with tumor cells. (A) Detection of nitrites in the DC supernatants. Detection of nitrites was performed in the supernatants of iDCs in culture with LPS, and mature DCs (after 24-h maturation with LPS+ CD40L) in the presence or absence of tumor cells. Data are mean ± SD from triplicate cultures (representative of three independent experiments). (B) Cytotoxic activities of DCs against tumor cells. DCs (d8) were cultured for 48h with Panc02 or B16-F0 cells, without stimulus, in the presence of LPS (iDCs+ LPS) or after 24-h maturation with LPS+ CD40L (mDCs), at the indicated tumor cell:DC ratios. The viability of tumor cells was determined using crystal violet assay. The data represent the mean ± SD from triplicate cultures and are representative of two independent experiments. (****P < 0.0001). Right panel: Effects of peroxynitrite inhibitor on iDC tumoricidal activity. Tumor cells were cultured without DC (controls) or with LPS-activated iDC, with or without FeTPPS (75uM). Pooled data of two experiments; (****P < 0.0001; Wilcoxon-Mann Whitney test. (C) Flow cytometry analysis of DCs for the cell-surface expression of death receptor ligands and markers for IFN-producing DCs (IKDCs): NK1.1, NKG2D, and CD45R (B220). (D) Flow cytometry analysis of cell-surface expression of CD40L, CD40, TRAIL-RII, Fas, NKG2-L, and MHC class I on tumor cells.
Cytotoxic activities of dcs and death receptor ligands (FasL, TRAIL, or TNF-α)
We therefore examined the killer activity of DCs, in relation to their immature and mature status. Consistent with previous resultsCitation58, our data show that iDCs, when exposed to the TLR4 ligand LPS, acquired a strong killing activity towards both pancreatic tumor cells and melanoma cells (). Of note, this condition also resulted in the highest level of NO production. In contrast, mDCs lacked this killing ability, except at the highest B16-F0:DC ratio (1:40). DC-mediated cytotoxic effects were significantly impaired by the peroxynitrite metabolite accelerator FeTPPS, underlining the role of NO in the killing ().
Interestingly, we found that iDCs in the absence of LPS were nevertheless endowed with inherent cytotoxicity against Panc02 cells, and to some extent against B16-F0 cells. This implies a direct action of iDCs rather than an effect of LPS sensitizing tumor cells to killing. It also evidenced, however, that iDCs endowed with the ability to kill tumor cells did not secrete substantial levels of nitrites. This led us to investigate alternative mechanisms and/or effector molecules. However, in our study we did not detect FasL or TRAIL expression on iDCs, mDCs, or IFN-γ-mDCs (although we did in fact detect a very minor TRAIL expression in the latter population, ). In addition, our previous studies showed that these DCs do not secrete TNF-αCitation23 but its expression at the membrane surface cannot be ruled out. Moreover, whereas DCs expressed CD40, CD40L was not found either on Panc02 or B16-F0 cells ().
A subpopulation of DCs has been defined as interferon-producing killer DCs (IKDCs), characterized by a CD11c+intermediate, NK1.1+, CD49b+, B220+, Ly6G− phenotype, and by the killing of various tumor cell lines in a TRAIL-dependent fashion.Citation59 These cells can produce both IFN-γ and IFN-α. We found that neither CD11c+ CD40+ iDCs nor CD11c+ CD40+ mDCs expressed NK1.1 or NKG2D (except for a minor subpopulation (< 7%) of mDCs that expressed NKG2D (± IFN-γ) (). Thus, the phenotype of our DCs, which were CD11b+CD11c+ NK1.1− TRAIL−/low, did not meet that of IKDCs. Moreover, we investigated whether DCs expressed Rae-1, the murine ligand for the NKG2D receptor (it should be noted that the other ligand, H60, is absent in C57BL/6Jrj mice but present in BALB.B mice). Neither iDCs nor mDCs expressed NKG2DL, a finding consistent with data from Fraszczak et al.,Citation57 this excludes interactions with NK1.1+ NKG2D+ cells.
Next, we examined cell membrane molecules of tumor cells in order to decipher possible interactions with DCs and/or NK1.1+ cells. We compared pancreatic tumor Panc02 and melanoma B16-F0 cells for death receptor expression. TRAIL expression varies in different pancreatic tumor cell lines, and some express TRAIL-R.Citation60 Panc02 cells expressed TRAIL-RII and Fas; they also expressed NKG2D-L but not CD40L (). Thus, none of the studied molecules could allow a dialog between DCs and Panc02 cells. In contrast, Panc02 cells may be the target of NKGD2+ TRAIL+ NK1.1+ cells. B16-F0 cells did not express any of these markers (in agreement with Lakshmikanth et al.Citation61, who reported the expression of NKG2D on B16 cells but not on B16-F0 nor B16-F10 cells), except for TRAIL-RII. However this receptor was detected at a lower level compared to that of Panc02 cells. To summarize, the following interactions were lacking: CD40 (present on DCs)/CD40L (lacking on Panc02 cells), TRAIL (lacking on DCs)/TRAIL RII (present on Panc02 cells) and FasL/Fas (present on Panc02 cells). For both Panc02 and B16-F0 cells, MHC class I expression was variable and did not depend on either the cell confluence or on the number of passages (< 20). Nevertheless, in most cases Panc02 cells expressed more MHC class I than B16-F0 cells (% and MFI), although at low levels.
iDC -vaccination in immunodeficient mice
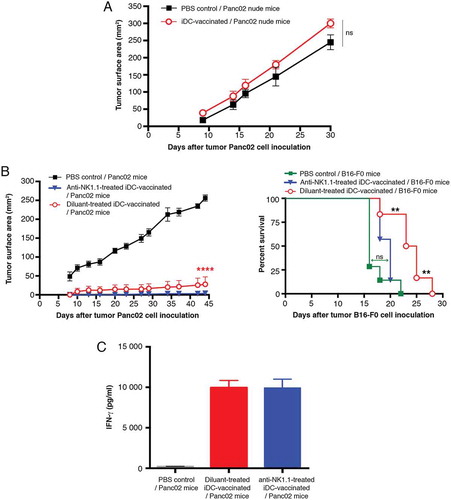
We next asked whether other immune cell populations were implicated in antitumor immunotherapy induced by iDC-vaccination. First the analysis of the immune status of spleens from iDC-vaccinated mice revealed an high activation of CD8+ T-cells and NK1.1+ cells expressing granzyme B and IFN-γ. There was an abundant IFN-γ splenocyte production in vitro. Secondly, these cells are known to play crucial roles in anticancer immunity. We therefore evaluated their involvement in iDC-vaccination. Of note, in NMRI-nu mice, the growth of tumors was comparable to C57BL/6Jrj mice (Supplementary Fig. S5). Interestingly iDC-vaccinated NMRI-nu mice and unvaccinated control mice developed Panc02 tumors; the curves were not significantly different (). These results demonstrate a role for T-cells in DC-vaccination-induced protection.
Figure 7. iDC-vaccination in immunodeficient and NK cell-depleted mice. (A) Development of tumors in nude mice, treated with PBS (n = 7) or iDC-vaccination (n = 7) before Panc02 inoculation. Data are expressed as mean of tumor surface area ± SEM. There is no significant difference between the two curves (two-way ANOVA followed by a Bonferroni test). (B, left panel) Depletion of NK1.1+ cells. Three groups of C57B6/Jrj mice were treated with anti-NK1.1 Ab (n = 7) or diluent (n = 7) one day before the first DC- injection, or PBS (n = 7). They were all challenged with Panc02 four days after the last iDC-injection. Data are expressed as mean of tumor surface area ± SEM. Comparisons between groups were made by two-way ANOVA followed by a Bonferroni test. (B, right panel). Three groups of C57B6/Jrj mice were anti-NK1.1-treated and iDC-vaccinated (n = 7) or diluent-treated and iDC-vaccinated (n = 6), or PBS-treated as controls (n = 7). They were all challenged with melanoma B16-F0. (**P < 0.01; log-rank Mantel-Cox test). (C) IFN-γ production. Spleens were collected 13 days after Panc02 inoculation and 33 days after anti-NK1.1 treatment (at a timepoint where NK1.1+ cells remained depleted). Representative of three experiments.
iDC -vaccination in NK cell-depleted mice
Treated or not with anti-NK1.1 antibodies (Ab), iDC-vaccinated C57BL/6Jrj mice were largely and significantly protected against Panc02 cell tumor development, compared to unvaccinated PBS controls (, left panel). In contrast, when inoculated with B16-F0 (, right panel) the survival curve of anti-NK1.1-treated iDC-vaccinated mice did not differ significantly from PBS controls, but was significantly different from the survival curve of iDC-vaccinated mice. Thus NK1.1+ cells do not seem to be central to protection against Panc02-induced tumors yet they may be involved in the delay of melanoma cell growth. However, 100% lethality was reached at d29. In addition, splenocytes from anti-NK1.1-treated iDC-vaccinated mice (note that NK1.1 depletion persisted at least for 34 days) produced IFN-γ amounts comparable to splenocytes from iDC-vaccinated mice, implying that the source of IFN-γ was not NK1.1+ cells ().
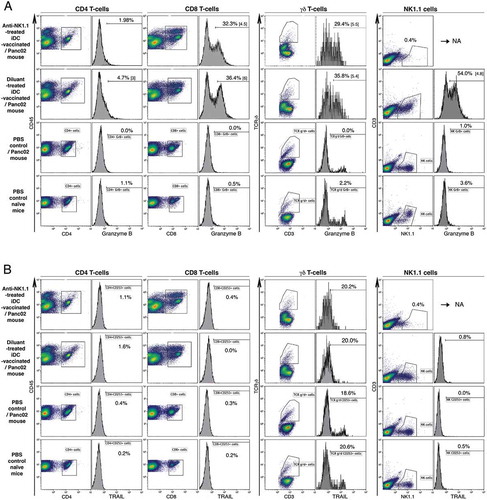
Moreover, in iDC-vaccinated mice, treated or not with anti-NK1.1 Ab, flow cytometry analysis showed that the percentage and MFI of CD8+ T-cells and γδ T-cells expressing granzyme B were equivalent, whereas these cell subpopulations were not detected in Panc02- recipients or PBS controls ( and ()). The anti-NK1.1 treatment therefore did not appear to impact the percentage of either CD8+ T-cells or γδ T-cells expressing granzyme B. TRAIL expression was similar in iDC-vaccinated mice, treated or not with anti-NK1.1 Ab, naïve PBS controls and tumor-bearing mice ( and ()).
Figure 8. Immune status of anti-NK1.1-treated mice. Spleens from four groups were collected on d16: anti-NK1.1-treated, iDC-vaccinated and Panc02-challenged group; diluent-treated, iDC-vaccinated and Panc02-challenged group; PBS-treated, Panc02-tumor-bearing control group and PBS-treated naïve group. Intracellular expression of granzyme B (A) and TRAIL (B) were determined in CD4+ T-cells, CD8+ T-cells, γδ T-cells, and NK1.1+ cells after 4 days of culture. Value (% of fluorescent cells) of isotype is deduced from that of each corresponding Ab, except for TRAIL+ γδ T-cells.
iDC -vaccination in CD8+ T-cell-depleted mice
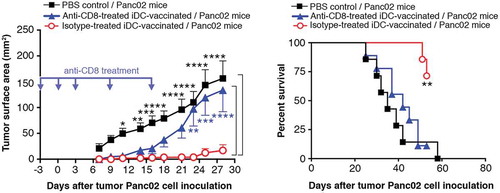
Five injections of anti-CD8 Ab and isotype control Ab were administered to two groups of iDC-vaccinated C57BL/6Jrj mice; a third group received diluent PBS; all three groups were inoculated with Panc02. The isotype control-treated iDC-vaccinated mice were fully protected (, left panel). The anti-CD8 curve, however, was not significantly different from the PBS control curve, showing that the CD8-depleting Ab abrogated the efficacy of iDC-vaccination. More precisely, from d7 to d21, the curves obtained with anti-CD8 Ab and with isotype treatments were indeed not different, whereas significant differences from the isotype-treated iDC curve appeared from d23 to d28. Such differences may indicate that CD8+ T-cells mainly intervene late and/or were more effective around three weeks after tumor cell inoculation. Even after the reemergence of CD8+ T-cells (20–25% on d25), the tumor development could not be blocked, as depicted by survival curves (, right panel).
Figure 9. iDC-vaccination in CD8+ T-cell depleted mice. Three groups of nine C57BL/6Jrj mice received one anti-CD8 Ab, or isotype control Ab, or PBS injection, three days before Panc02 inoculation (d0), one injection on d0 and three injections on d3, d9, and d17. Data are expressed as mean tumor surface area ± SEM (left panel). Comparisons between groups were made by two-way ANOVA followed by a Bonferroni test (*P < 0.05, **P < 0.01, ***P < 0.001). Right panel depicts Kaplan-Meier survival curves. (**P = 0.005; log-rank Mantel-Cox test).
iDC-vaccination and FOLFIRINOX treatment prolong survival of Pdx-1-Cre; LSL-KrasGD12; Ink4a/Arf lox/lox mice
In order to evaluate the efficacy of IDC-vaccination in a model clinically more relevant to human PAC, we utilized Pdx-1-Cre;LSL-KrasGDCitation12;Ink4a/Arf lox/lox (KIC) mice. The mice were bred onto the FVB/N background, then interbred with C57BL/6J mice. These genetically engineered mice develop some of the molecular and pathophysiological features of human PAC, with short latency.Citation61 The disease is characterized by its very fast course and by its aggressiveness. Low-grade ductal lesions can be observed by 3 weeks; the number of pancreatic ductal lesions increased with higher grade by 4 weeks.Citation61 Small PACs are detected in all mice at six weeks. Pancreatic ductal lesions therefore rapidly progress, histologically and clinically, into invasive pancreatic tumors. Taking these kinetics into consideration, the iDC-vaccination was initiated in 4–5-week-old, MHC class I-compatible mice, for four weeks.
To select compatible donors of DCs for KIC recipients, we used our previously designed primers to detect the presence of MHC class I (H2-Kb for C57BL/6J, and H2-Kq for FVB) using PCR (Supplementary Table S1).
To determine whether a combination of immunotherapy and chemotherapy would be a more effective protocol, we tested the FOLFIRINOX regimen. We did not observe any weight loss or behavioral abnormalities in FOLFIRINOX-treated mice in preliminary experiments (Supplementary Fig. S6; Supplementary Table S2). The DC-vaccination and chemotherapy schedule is presented in ). Chemotherapy was continued for at least four weeks.
Figure 10. Therapeutic effects of iDC-vaccination and FOLFIRINOX in the Pdx-1-Cre ; LSL-KrasGDCitation12 ;LSL-Trp53RCitation1Citation62H mouse model (A) Treatment schedule of iDC-vaccination and FOLFIRINOX. (B) Efficacy of iDC-vaccination alone or in combination with FOLFIRINOX. Five groups of mice were treated with PBS, iDCs, iDCs+ FOLFIRINOX (four injections), FOLFIRINOX alone (four injections), and FOLFIRINOX alone (five to seven injections). Data are pooled from three or more independent experiments. Comparisons of treatment effects on survival were performed using the Wilcoxon-Mann Whitney test. (C) The graph depicts Kaplan-Meier survival curves from the groups cited above. (*P < 0.05, **P < 0.01; log-rank Mantel-Cox test).
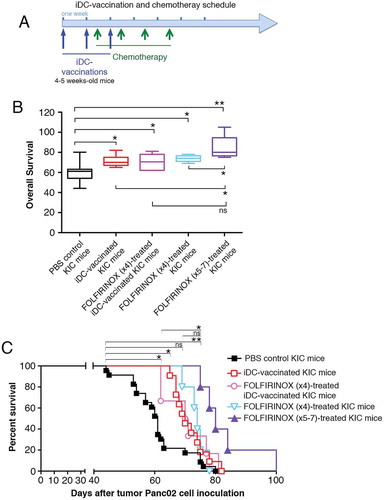
We found that KIC mice typically had weight loss, or often ascites, and in some cases jaundice. Solid pancreatic tumors ranged from ≈ 0.7–3 g, were highly invasive, and frequently involved the duodenum (at times the stomach and colon). Occasionally the tumors obstructed the bile duct. As shown in ), all the mice in the control group had a median survival of 61 days (mean ± SEM = 61 ± 1.9; n = 23), comparable to that reported by Aguirre et al.Citation61 (60.2 days; n = 24). All four DC-vaccinated and/or FOLFIRINOX-treated groups presented a median survival significantly different from that of the control group ()). Mice treated with iDC-vaccination had a median OS of 70 days (mean ± SEM = 71.5 ± 1.5; n = 11). Mice treated with FOLFIRINOX (four injections) had a median OS of 74 days (mean ± SEM = 73.8 ± 1.4; n = 5). Mice treated with iDC-vaccination combined with FOLFIRINOX (four injections) had a median OS of 70.5 days (mean ± SEM = 70.5 ± 3.1; n = 6). Thus, iDC-vaccination alone was able to induce significant therapeutic effects by increasing lifespan. FOLFIRINOX treatment alone or combined with iDC-vaccination was effective in increasing survival by 10 days. However, four injections of FOLFIRINOX failed to synergize the efficacy of DC-vaccination. Importantly, prolonging FOLFIRINOX treatment for 2–3 weeks further extended survival (median = 80 days; mean ± SEM = 84.4 ± 3.1; n = 5), which is significantly different from that of iDC-vaccinated mice and of mice treated with four injections of FOLFIRINOX (). Of note, median survival of mice treated with iDC-vaccinations and FOLFIRINOX (four injections) and that of mice treated with FOLFIRINOX (5–7 injections) do not appear to be significantly different (), whilst the comparison between the corresponding survival curves indicates a significant difference (P < 0.05; ). In future, we therefore envision to modifying these protocols by increasing both the number of injections of iDCs and of FOLFIRINOX, while decreasing the chemotherapy doses.
Discussion
Immune surveillance against tumors is mediated by both innate and adaptive anticancer immune responses, in which DCs exert a pivotal role. Here, we validated iDCs as powerful inducers of anticancer immunity associated with a CD8+ T-cell-dependent beneficial clinical outcome in tumor pancreatic models. We revealed some DC weapons, including their ability to kill tumor cells.
Immature DCs neither pulsed with tumor lysate nor antigens do exert anticancer activity, both in humans and in rodents.Citation21,Citation23,Citation28–Citation33,Citation57,Citation58 HumanCitation63,Citation64 and rodentCitation59,Citation65,Citation66 studies support a role for TNF-α, FasL, and/or TRAIL in some subsets of killer DCs, and implicate granzyme BCitation67, the CD40/CD40L interactionCitation68, or NK-cell-related pathway.Citation57 NO also is crucial in DC cytotoxicityCitation33,Citation57, including mouseCitation58 and rat iDCs. In our model, LPS- and CD40L-treated mDCs and LPS-treated iDCs produced levels of nitrites comparable to those obtained by mDCs in the study by Fraszczak et al.Citation57 whereas untreated iDCs (a condition not tested by Fraszczak et al)Citation57 did not. The peroxynitrite metabolite accelerator FeTPPS significantly impaired DC-mediated cytotoxic effects, thus underlining the role of NO in DC-cytoxicity.Citation57 The cytotoxicity shown by iDCs, which do not produce nitrites, on Panc02 and to a lesser extent B16-F0, emphasizes the existence of additional cytotoxic mechanism(s). However iDCs and Panc02 cells appear to be lacking the following interactions: CD40/CD40L, TRAIL/TRAILRII and FasL/Fas. Moreover, DCs do not produce TNF-α.Citation25 Our data support others Citation57,Citation69 demonstrating a lack of any dominant mechanism behind DC cytotoxicity, other than NOCitation70.
Before tumor cell detectability, sc injected « vaccinating » iDCs could be considered to persist within an organism and be comparable to endogenous iDCs. Should some iDCs move to the secondary lymphoid organs, they would likely leave and join the pool of circulating DCs in search of antigens. Others that become mature (but not tolerant) may reach the lymph nodes and stimulate lymphoid cells as « immune enhancers».Citation71 Should tumor cells be present in the organism, we assume that some iDCs reach the tumor site. Two main mechanisms may account for successful iDC-vaccinations: 1, iDCs could generate efficient antitumor immune responses by phagocytizing apoptotic and necrotic tumor cells, priming antitumor adaptive immunity against them, and maturing in vivo; 2, under particular circumstances, DCs could be directly cytotoxic to tumor cells, resulting in the release of TAAs from the dying cells. DCs could then prime antitumor adaptive immunity, as demonstrated in vitro by two of our co-authors, Bernard Bonnotte and Malika Tradd.Citation57 To be efficient, iDCs therefore must first be in contact either with live tumor cells (of which they may kill a fraction) or with antigenic components of dead cells. In addition to DCs, recruited NK- and γδ T-cells can act directly with tumor cells. Such interactions may define a relative specificity of action, independent of tumor antigen.Citation23
We therefore continued with preclinical models, hypothesizing that injected iDCs may undergo in vivo maturation provided that the microenvironment is favorable. Irrespective of TAAs, iDCs per se promoted strong prophylactic effects against Panc02 tumor induction, demonstrated by the large increase in lifespan or by full resistance, as yet not reported by others. This beneficial clinical outcome was associated with antitumor immune responses characterized by activated immune cells and by sustained secretion of IFN-γ in splenocyte culture, as expected given the properties of IL-12, IL-15, and IL-18.
Among other immune cell populations prone to intervene in cancer immunotherapy, NK cells appeared dispensable in contrast to other models.Citation19 Our results rather assign a role to CD8+ T-cells, known as canonical cytotoxic effectors against tumor cells.Citation14,Citation62 They also suggest that CD8+ T-cells become effective late in tumor development, with notable clinical effects around three weeks after Panc02 inoculation. In vivo therefore, antitumor immunity is triggered by iDCs and ultimately depends, at least, on CD8+ T-cells.
In long-term protection experiments, we demonstrated that iDC-vaccinated mice, fully protected against Panc02 tumor progression, all resisted a second Panc02 challenge whereas 91% iDC-recipients did not survive following melanoma induction. The immune status of iDC-protected mice was characterized by a substantial expansion of CD8+ T-cells, γδ T-cells, and NK1.1 that expressed granzyme B, and a small increase in the percentage of γδ T-cells expressing TRAIL. Long-term protection might involve memory CD4+ T- and CD8+ T-cells via IL-15 secreted by DCsCitation72, γδ T-cellsCitation54 and NK cells.Citation73
In therapeutic conditions, the route of DC-vaccination is critical to their successful in vivo proliferation, induction of distinct homing receptor profiles on effector T-cells and thus for the ability of T-cells to migrate into peripheral tissues and tumors. DCs administered directly into tumors migrate to draining lymph nodes more effectively than when injected in the skin.Citation74 Intratumoral injection of DCs here correlated with reduced tumor growth and even regression as seen elsewhere.Citation18,Citation25,Citation31,Citation39,Citation57
Immunotherapeutic approaches had to date limited success, particularly in improving long-term survival in cancer patients. Several attempts to treat PAC with new combined therapies have raised some hope.Citation10,Citation12 To our knowledge, data regarding the treatment of murine PAC with FOLFIRINOX (in nude mice) are limited.Citation75,Citation76 The combination of DCs with chemotherapy may seem inconsistent considering the known immunosuppressive effects of chemotherapy, such as leukocyte depletion.Citation10 Moreover, the safety of FOLFIRINOX remains a concern, with high rates of grades 3 and 4 neutropenia observed despite dose reduction. However, oxaliplatin and 5-Fu, included in FOLFIRINOX, decrease suppressor/regulatory cellsCitation77 and myeloid-derived suppressor cells (MDSC), increase tumor cell immunogenicity and induce immunogenic cell death.
In KIC mice, FOLFIRINOX treatment alone or combined with iDC-vaccination induced therapeutic effects shown by a significant increase in lifespan. Prolonging survival by 10.5 or 12.8 days may seem relatively small; nevertheless, these delays are meaningful given the strong underlying “genetic pressure” of two mutation/deletion alterations, the fast course of the disease, and the low overall mean survival of only 61 days. For comparison, inhibition of Hedgehog signaling (a pathway involved in the generation of tumor stroma) in the same model increased survival by 6 days.Citation78 Importantly, we report that prolonging FOLFIRINOX treatment for 2–3 weeks further extended the survival (survival = 23.4 days). To our knowledge, there are no other reports of the efficacy of iDC-vaccination alone, FOLFIRINOX alone, or the combination of vaccination with chemotherapy in a model relevant to human PAC.
Our findings bring iDCs back to the forefront as compelling vaccinating actors. Moreover, immature DC-vaccination represents an advantageous low-cost and simple treatment. Thus, treatment with DC-vaccination still holds translational potential in combined treatments aiming to promote tumor cell killing, trigger innate and adaptive immune responses, and overcome immunosuppression by the tumor environment.
Materials and methods
Ethics statement
The investigation was conducted in accordance with the French guidelines for animal care and the 2010/63/EU directive of the European Parliament, and was approved by the local ethics committee of Aix-Marseille University. The protocols were registered under numbers 35–08102012. Mice were monitored daily for any behavioral or physical changes and weighed three times per week.
Mice
Seven- to 10-week-old C57BL/6J Rj (H-2b) mice and NMRI-nu (nu/nu) mice were from Janvier (Le Genest-St. Isle, France). Pdx1-Cre;LSL-KrasG12D; Ink4a/Arfloxl/lox (KIC) and LSL-KrasG12D;Ink4a/Arfloxl/lox (KI) littermate mice were from the animal experimentation and housing facility, INSERM U1068/UMR 7258, Cancer Research Center of Marseille (Marseille, France).
Cell lines
Cell lines derived from C57BL/6 mice included the highly tumorigenic murine pancreatic carcinoma cell line with ductal morphology, Panc02, and the metastatic clones of the B16 melanoma, B16-F0 and B16-F10.Citation25 Also used were 3T3 murine fibroblasts transfected with murine CD40L. Before injection, cells were confirmed as being negative for mycoplasma contamination.
Tumor induction and vaccination strategies
Panc02 (5x10Citation5 to 1 × 10Citation6) and B16-F0 (1 to 3 × 10Citation5) cells were inoculated sc into the flank of C57BL/6 mice and nude mice. Tumor growth was expressed as the product of perpendicular diameters, measured using a digital caliper. Mice were euthanized when tumors exceeded 250 mmCitation2. For prophylactic vaccination, DCs, cultured with GM-CSF and IL-4 for the last 24 hours, were injected sc into one flank, three times at weekly intervals unless indicated. For therapeutic vaccination, DCs were injected sc or intratumorally when tumors had formed a palpable nodule. KIC mice were euthanized when weight loss reached 15–20% of total weight.
Drugs
Separate intraperitoneal injections of the drugs oxaliplatin, irinotecan, calcium leucofolinate, and 5-fluorouracil were given over a period of two days (see Supplementary Table S2).
Antibodies (see Supplementary Table S3)
Nitrite quantification
Culture supernatants were collected and incubated with an equal volume of Griess reagent. After a 15-min incubation at room temperature, the absorbance was read at 550 nm against 690 nm, as recommended. The amount of (NO2−) released by dendritic cells was detected in cell-free supernatants by the colorimetric Griess reagent kit (Molecular Probes, Eugene, OR). A standard dilution was made with nitrites from 100 µM to 0µM. We added 100 µl (standard and samples of supernatants) to each well of a 96-well plate plus 100 µL of Griess solution.
In vivo depletion of NK1.1+ cells and CD8+ T-cells
mAb anti-NK1.1 (clone PK136 ; N°BE0036), Ab, anti-CD8 clone YTS 169.4 (N°BP0117), and isotype controls were from BioXCell (Euromedex). Depletion of NK1.1+ cells was achieved by intravenous injection of 50 μg PK136 mAb one day before the first DC-vaccination. Depletion of CD8+ cells was achieved by intraperitoneal injection of 200 μg YST-169.4 mAb three days before tumor cell inoculation, on the day of inoculation, and 3, 9, and 11 days thereafter. CD8+ T-cell depletion from mouse blood was assessed on d11, d17, and d28. Control mice received rat IgG2b Ab as isotype control.
Flow cytometry
Cells were labeled following 2% or 4% paraformaldehyde fixation.Citation25 For intracellular staining, cells were incubated for 4h at 37°C with monensin (GolgiStop, BD Pharmingen). After Fc receptor blocking using anti-CD16/CD32 Ab (BD Pharmingen) and staining with anti-CD4, anti-CD8, and anti-NK1.1 Ab, intracellular IFN-γ, and granzyme B staining was performed using the fixation and permeabilization Buffer Set (Ebioscience). Antigen fluorescence intensity and cell subset frequency were measured using a Gallios flow cytometer, and data were analyzed using Kaluza Software (Beckman Coulter). Both were performed at the AMUTICYT Cytometry core facility (Faculté de Pharmacie, Aix-Marseille Université, France). The results are expressed as percentages of fluorescent cells stained by specific Ab minus percentages of fluorescent cells stained by isotype Ab.
Generation and maturation of DCs
DCs were generated from C57Bl/6 mouse bone marrow according to Inaba’s protocolCitation45 and cultured with 100 U/20 ng/ml of GM-CSF (Immunotools, N°12343125). At d2 and d4, supernatant was removed and replenished with fresh DC media. IL-4 (10 U/20 ng/ml) was added at d0 or d6. Maturation was induced with a combination of LPS (0.1 μg/ml; Sigma-Aldrich N°6529) and 3T3 murine fibroblasts transfected with murine CD40L at a 1:5 ratio (3T3:DC). At d6–7, cytometry analysis determined expression of surface membrane markers.
Cytokine detection in DC culture supernatants
Cytokine detection by ELISA occurred in collected culture supernatants (for IL-12, Ozyme; for IL-15, Platinium Elisa Affymetrix, Thermo Fisher Scientific; for IL-18, MBL Life Technologies (Clinisciences), and for IFN-γ, Biolegend) according the manufacturers’ protocol. The concentration was calculated by measuring the color change using a microplate reader (Fluostar, BMG Labteck).
Cytotoxic assays
The number of residual adherent cells was evaluated using crystal violet staining.Citation79 DCs were cultured with target tumor cells for 48h in 96-well flat bottom plate. After a gentle washing with PBS+/+, the plate was turned upside down and allowed to dry for 30 sec. Fixation was performed by adding 0.1ml/well of pure ethanol, for 15 min. The plate was turned upside down and allowed to dry for 2 min. Crystal violet (0.5%) was added (0.1ml/well) for 5 min. The wells were rinsed with H20 and 0.1ml/well of acetic acid (33%) was added; the plate was agitated for 10 min. The plate was read at 570 nm. Data are presented as the percentage of relative absorbance calculated from the formula Atest/Acontrol, where Atest is the absorbance of tumor cells cultured with DCs in different conditions minus the absorbance of DCs alone and Acontrol is the absorbance of tumor cells cultured alone. The absorbance of the medium is subtracted from each value.
Mice genotyping
KIC mice were genotyped by PCR analysis using specific primer pairs (Supplementary Table S1) to detect the H2-K MHC class I alleles. The PCR was performed in a Mastercycler (Eppendorf) in a reaction volume of 25 μl and comprised 200 ng of gDNA, 2.5 μl of 10X enzyme buffer, 400 nM of each primer, 0.4 mM of dNTP mix, 1 mM of MgCl2, and 2.5 U GoTaq DNA polymerase (Promega). The program was applied as follows: 1 cycle of 3 min at 95°C; 35 cycles of 30 sec at 95°C, 30 sec at 66°C, 10 sec at 72°C; 1 cycle of 2 min at 72°C. Amplification products were analyzed on agarose gels containing ethidium bromide for staining.
Statistical analysis
The statistical analysis was performed using the Wilcoxon-Mann-Whitney test or the two-way analysis of variance (ANOVA) test followed by a Bonferroni test. The survival curves were determined using the Kaplan-Meier method. The log-rank Mantel-Cox test was used to compare curves between study and control groups. Values are reported as means ± SEM. Values of P < 0.05 were considered significant.
Abbreviations
| ACT | = | adoptive cell transfer |
| PAC | = | pancreatic adenocarcinoma |
| CTL | = | cytotoxic T lymphocyte |
| DC | = | dendritic cell |
| GM-CSF | = | granulocyte-macrophage colony-stimulating factor |
| iDC | = | immature DC |
| IFN | = | interferon |
| Dex | = | DC-derived exosome |
| ICI | = | immune checkpoint inhibitor |
| mDC | = | mature DC |
| MFI | = | median fluorescence intensity |
| NK | = | natural killer |
| NKG2D | = | natural killer group 2 member D |
| KIC | = | Pdx1-Cre; LSL-KrasG12D; Ink4a/Arflox/llox |
| OS | = | overall survival |
| PanIN | = | pancreatic intraepithelial neoplasia |
| sc | = | subcutaneous |
| SN | = | supernatant |
| TAA | = | tumor-associated antigen |
| TNF | = | tumor necrosis factor |
Disclosure of interest
The authors report no conflict of interest.
Writing assistance
Our manuscript has been edited by « Angloscribe », an independent scientific proofreading service provider. Funding source for writing assistance: INSERM;Aix-Marseille University SIRIC - INCA-DGOS-INSERM 6838 National institute of Health and Medical Research (Inserm) Aix-Marseille University SIRIC - INCA-DGOS-INSERMM 6838 National institute of Health and Medical Research (Inserm) 6838 National institute of Health and Medical Research (Inserm)
Supplemental Material
Download Zip (4.1 MB)Acknowledgments
We are grateful to Dr Joseph Ciccolini (SMARTc: Simulation & Modelling: Adaptive Response for Therapeutics in Cancer, Assistant Professor in Pharmacokinetics, Inserm S_911 CRO2, AMU, Marseille; Clinical Pharmacologist, APHM, Marseille, France) for helpful discussion on the FOLFIRINOX regimen. We thank Guillaume Schmidt (Centre de Recherche en Oncologie biologique et Oncopharmacologie, Campus Santé-Timone, Marseille, France) for expert technical assistance in setting the PCR protocol to detect the H2-K MHC class I alleles. We are deeply indebted to Thierry Cheyrol and Perrine André (Centre d’Exploration Fonctionnelle Scientifique, Campus Santé-Timone, Marseille, France) for their invaluable and excellent assistance in animal experiments. We also thank Dr V. Schmitz and E. Raskopf (University of Bonn, Germany) for kindly providing us with the Panc02 cells and Dr Anderson D. Loundou (Unité d’Aide Méthodologique, Campus Santé-Timone, Marseille, France) for assisting with statistical analysis.
Supplemental data
Supplemental data for this paper can be accessed on the publisher’s website.
Additional information
Funding
References
- Banchereau J, Palucka K. Immunotherapy: cancer vaccines on the move. Nat Rev Clin Oncol. 2018;15(1):9–10. doi: 10.1038/nrclinonc.2017.149. PMID:28895570.
- Topalian SL. Targeting immune checkpoints in cancer therapy. JAMA. 2017;318(17):1647–1648. doi: 10.1001/jama.2017.14155. PMID:28885639.
- Rosenberg SA, Restifo NP. Adoptive cell transfer as personalized immunotherapy for human cancer. Science. 2015;348(6230):62–68. doi: 10.1126/science.aaa4967. PMID:25838374.
- Restifo NP, Smyth MJ, Snyder A. Acquired resistance to immunotherapy and future challenges. Nat Rev Cancer. 2016;16(2):121–126. doi: 10.1038/nrc.2016.2. PMID:26822578.
- Kong IC, Flynn JC. Opportunistic autoimmune disorders potentiated by immune-checkpoint inhibitors anti-CTLA-4 and Anti-PD-1. Front Immunol. 2014;5:206. doi: 10.3389/fimmu.2014.00206. PMID: 24904570.
- Rosenberg SA, Yang JC, Restifo NP. Cancer immunotherapy: moving beyond current vaccines. Nat Med. 2004;10(9):909–915. PMID: 15340416. doi: 10.1038/nm1100.
- Gilboa E. DC-based cancer vaccines. J Clin Invest. 2007;117(5):1195–1203. PMID:17476349. doi: 10.1172/JCI31205.
- Palucka K, Banchereau J. Dendritic-cell-based therapeutic cancer vaccines. Immunity. 2013;39(1):38–48. doi: 10.1016/j.immuni.2013.07.004. PMID:23890062.
- Anguille S, Smits EL, Lion E, Van Tendeloo VF, Berneman ZN. Clinical use of dendritic cells for cancer therapy. Lancet Oncol. 2014;15(7):e257–67. doi: 10.1016/S1470-2045(13)70585-0. PMID:24872109.
- Bol KF, Schreibelt G, Gerritsen WR, De Vries IJ, Figdor CG. Dendritic cell-based immunotherapy: state of the art and beyond. Clin Cancer Res. 2016;22(8):1897–1906. doi: 10.1158/1078-0432.CCR-15-1399. PMID:27084743.
- Sabado RL, Balan S, Bhardwaj N. Dendritic cell-based immunotherapy. Cell Res. 2017;27(1):74–95. doi: 10.1038/cr.2016.157. PMID:28025976.
- Garg AD, Vara Perez M, Schaaf M, Agostinis P, Zitvogel L, Kroemer G, Galluzzi L. Trial watch: dendritic cell-based anticancer immunotherapy. Oncoimmunology. 2017;6(7):e1328341. doi: 10.1080/2162402X.2017.1328341. PMID:28811970.
- Tacken PJ, De Vries IJ, Torensma R, Figdor CG. Dendritic-cell immunotherapy: from ex vivo loading to in vivo targeting. Nat Rev Immunol. 2007;7(10):790–802. PMID:17853902. doi: 10.1038/nri2173.
- Pitt JM, Andre F, Amigorena S, Soria JC, Eggermont A, Kroemer G, Zitvogel L. Dendritic cell-derived exosomes for cancer therapy. J Clin Invest. 2016;126(4):1224–1232. doi: 10.1172/JCI81137. PMID:27035813.
- Dhodapkar MV, Sznol M, Zhao B, Wang D, Carvajal RD, Keohan ML, Chuang E, Sanborn RE, Lutzky J, Powderly J, et al. Induction of antigen-specific immunity with a vaccine targeting NY-ESO-1 to the dendritic cell receptor DEC-205. Sci Transl Med. 2014; 6(232):232ra51. doi: 10.1126/scitranslmed.3008068. PMID:24739759.
- Kantoff PW, Higano CS, Shore ND, Berger ER, Small EJ, Penson DF, Redfern CH, Ferrari AC, Dreicer R, Sims RB, et al. Sipuleucel-T immunotherapy for castration-resistant prostate cancer. N Engl J Med. 2010; 363(5):411–422. doi: 10.1056/NEJMoa1001294. PMID:20818862.
- Fromm PD, Papadimitrious MS, Hsu JL, Van Kooten Losio N, Verma ND, Lo TH, Silveira PA, Bryant CE, Turtle CJ, Prue RL, et al. CMRF-56(+) blood dendritic cells loaded with mRNA induce effective antigen-specific cytotoxic T-lymphocyte responses. Oncoimmunology. 2016; 5(6):e1168555. doi: 10.1080/2162402X.2016.1168555. PMID:27471645.
- Nagaraj S, Ziske C, Strehl J, Messmer D, Sauerbruch T, Schmidt-Wolf IG. Dendritic cells pulsed with alpha-galactosylceramide induce anti-tumor immunity against pancreatic cancer in vivo. Int Immunol. 2006;18(8):1279–1283. PMID:16772371. doi: 10.1093/intimm/dxl059.
- Lion E, Smits EL, Berneman ZN, Van Tendeloo VF. NK cells: key to success of DC-based cancer vaccines? Oncologist. 2012;17(10):1256–1270. doi: 10.1634/theoncologist.2011-0122. PMID:22907975.
- Yan L, Wu M, Ba N, Wang LJ, Zhang HQ, Shi GY, Zhang ZS, Wang XJ. Efficacy of dendritic cell-cytokine-induced killer immunotherapy plus intensity-modulated radiation therapy in treating elderly patients with esophageal carcinoma. Genet Mol Res. 2015;14(1):898–905. doi: 10.4238/2015. PMID:25730028.
- Ribas A, Wargo JA, Comin-Anduix B, Sanetti S, Schumacher LY, McLean C, Dissette VB, Glaspy JA, McBride WH, Butterfield LH, et al. Enhanced tumor responses to dendritic cells in the absence of CD8-positive cells. J Immunol. 2004;172(8):4762–4769. PMID:15067052.
- Adam C, King S, Allgeier T, Braumuller H, Luking C, Mysliwietz J, Kriegeskorte A, Busch DH, Röcken M, Mocikat R. DC-NK cell cross talk as a novel CD4+ T-cell-independent pathway for antitumor CTL induction. Blood. 2005;106(1):338–344. PMID: 15769894. doi: 10.1182/blood-2004-09-3775.
- Ribas A, Vo DD, Weeks DL, Comin-Anduix B, Schumacher LY, Garban HJ, McLean C, Yang J, Dissette VB, Peraza P, et al. Broad antitumor protection by dendritic cells administered to CD8alpha knock out mice. Cancer Immunol Immunother. 2006; 55(6):663–671. PMID: 16133107. doi: 10.1007/s00262-005-0065-y.
- Karimi K, Boudreau JE, Fraser K, Liu H, Delanghe J, Gauldie J, Xing Z, Bramson JL, Wan Y. Enhanced antitumor immunity elicited by dendritic cell vaccines is a result of their ability to engage both CTL and IFN gamma-producing NK cells. Mol Ther. 2008;16(2):411–418. PMID:18059374. doi: 10.1038/sj.mt.6300347.
- Collignon A, Perles-Barbacaru AT, Robert S, Silvy F, Martinez E, Crenon I, Germain S, Garcia S, Viola A, Lombardo D, et al. A pancreatic tumor-specific biomarker characterized in humans and mice as an immunogenic onco-glycoprotein is efficient in dendritic cell vaccination. Oncotarget. 2015; 6(27):23462–23479. PMID:26405163. doi: 10.18632/oncotarget.4359.
- Simon T, Fonteneau JF, Gregoire M. Dendritic cell preparation for immunotherapeutic interventions. Immunotherapy. 2009;1(2):289–302. doi: 10.2217/1750743X.1.2.289. PMID:20635946.
- Draube A, Klein-Gonzalez N, Mattheus S, Brillant C, Hellmich M, Engert A, Von Bergwelt-Baildon M. Dendritic cell based tumor vaccination in prostate and renal cell cancer: a systematic review and meta-analysis. PLoS One. 2011;6(4):e18801. doi: 10.1371/journal.pone.0018801. PMID:21533099.
- Kolstad A, Kumari S, Walczak M, Madsbu U, Hagtvedt T, Bogsrud TV, Kvalheim G, Holte H, Aurlien E, Delabie J, et al. Sequential intranodal immunotherapy induces antitumor immunity and correlated regression of disseminated follicular lymphoma. Blood. 2015; 125(1):82–89. doi: 10.1182/blood-2014-07-592162. PMID:25293773.
- Fernandez NC, Lozier A, Flament C, Ricciardi-Castagnoli P, Bellet D, Suter M, Perricaudet M, Tursz T, Maraskovsky E, Zitvogel L. Dendritic cells directly trigger NK cell functions: cross-talk relevant in innate anti-tumor immune responses in vivo. Nat Med. 1999;5(4):405–411. PMID:10202929. doi: 10.1038/7403.
- Prins RM, Vo DD, Khan-Farooqi H, Yang MY, Soto H, Economou JS, Liau LM, Ribas A. NK and CD4 cells collaborate to protect against melanoma tumor formation in the brain. J Immunol. 2006;177(12):8448–8455. PMID:17142742.
- Candido KA, Shimizu K, McLaughlin JC, Kunkel R, Fuller JA, Redman BG, Thomas EK, Nickoloff BJ, Mulé JJ. Local administration of dendritic cells inhibits established breast tumor growth: implications for apoptosis-inducing agents. Cancer Res. 2001;61(1):228–236. PMID:11196166.
- Viaud S, Terme M, Flament C, Taieb J, Andre F, Novault S, Escudier B, Robert C, Caillat-Zucman S, Tursz T. Dendritic cell-derived exosomes promote natural killer cell activation and proliferation: a role for NKG2D ligands and IL-15Ralpha. PLoS One. 2009;4(3):e4942. PMID:19319200. doi: 10.1371/journal.pone.0004942.
- Hanke N, Alizadeh D, Katsanis E, Larmonier N. Dendritic cell tumor killing activity and its potential applications in cancer immunotherapy. Crit Rev Immunol. 2013;33(1):1–21. PMID:23510023.
- Chiaravalli M, Reni M, O’Reilly EM. Pancreatic ductal adenocarcinoma: state-of-the-art 2017 and new therapeutic strategies. Cancer Treat Rev. 2017;60:32–43. doi: 10.1016/j.ctrv.2017.08.007. PMID:28869888.
- Neesse A, Algul H, Tuveson DA, Gress TM. Stromal biology and therapy in pancreatic cancer: a changing paradigm. Gut. 2015;64(9):1476–1481. doi: 10.1136/gutjnl-2015-309304. PMID:25994217.
- Kajihara M, Takakura K, Kanai T, Ito Z, Matsumoto Y, Shimodaira S, Okamoto M, Ohkusa T, Koido S. Advances in inducing adaptive immunity using cell-based cancer vaccines: clinical applications in pancreatic cancer. World J Gastroenterol. 2016;22(18):4446–4458. doi: 10.3748/wjg.v22.i18.4446. PMID:27182156.
- Kim HS, Choo YS, Koo T, Bang S, Oh TY, Wen J, Song SY. Enhancement of antitumor immunity of dendritic cells pulsed with heat-treated tumor lysate in murine pancreatic cancer. Immunol Lett. 2006;103(2):142–148. PMID:16313973. doi: 10.1016/j.imlet.2005.10.021.
- Bauer C, Bauernfeind F, Sterzik A, Orban M, Schnurr M, Lehr HA, Endres S, Eigler A, Dauer M. Dendritic cell-based vaccination combined with gemcitabine increases survival in a murine pancreatic carcinoma model. Gut. 2007;56(9):1275–1282. PMID:17395611. doi: 10.1136/gut.2006.108621.
- Schmidt T, Ziske C, Marten A, Endres S, Tiemann K, Schmitz V, Gorschlüter M, Schneider C, Sauerbruch T, Schmidt-Wolf IG. Intratumoral immunization with tumor RNA-pulsed dendritic cells confers antitumor immunity in a C57BL/6 pancreatic murine tumor model. Cancer Res. 2003;63(24):8962–8967. PMID:14695214.
- Franceschi C, Collignon A, Isnardon D, Benkoel L, Verine A, Silvy F, Bernard JP, Lombardo D, Beraud E, Olive D. A novel tumor-associated pancreatic glycoprotein is internalized by human dendritic cells and induces their maturation. J Immunol. 2011;186(7):4067–4077. doi: 10.4049/jimmunol.1000408. PMID:21346236.
- Beraud E, Collignon A, Franceschi C, Olive D, Lombardo D, Mas E. Investigation of a new tumor-associated glycosylated antigen as target for dendritic cell vaccination in pancreatic cancer. Oncoimmunology. 2012;1(1):56–61. PMID:22720212. doi: 10.4161/onci.1.1.18459.
- Lambert A, Gavoille C, Conroy T. Current status on the place of FOLFIRINOX in metastatic pancreatic cancer and future directions. Therap Adv Gastroenterol. 2017;10(8):631–645. doi: 10.1177/1756283X17713879. PMID:28835777.
- Suker M, Beumer BR, Sadot E, Marthey L, Faris JE, Mellon EA, El-Rayes BF, Wang-Gillam A, Lacy J, Hosein PJ, et al. FOLFIRINOX for locally advanced pancreatic cancer: a systematic review and patient-level meta-analysis. Lancet Oncol. 2016; 17(6):801–810. doi: 10.1016/S1470-2045(16)00172-8. PMID:27160474.
- Hessmann E, Johnsen SA, Siveke JT, Ellenrieder V. Epigenetic treatment of pancreatic cancer: is there a therapeutic perspective on the horizon? Gut. 2017;66(1):168–179. doi: 10.1136/gutjnl-2016-312539. PMID:27811314.
- Labeur MS, Roters B, Pers B, Mehling A, Luger TA, Schwarz T, Grabbe S. Generation of tumor immunity by bone marrow-derived dendritic cells correlates with dendritic cell maturation stage. J Immunol. 1999;162(1):168–175. PMID:9886383.
- Hochrein H, O’Keeffe M, Luft T, Vandenabeele S, Grumont RJ, Maraskovsky E, Shortman K. Interleukin (IL)-4 is a major regulatory cytokine governing bioactive IL-12 production by mouse and human dendritic cells. J Exp Med. 2000;192(6):823–833. PMID:10993913.
- Inaba K, Inaba M, Romani N, Aya H, Deguchi M, Ikehara S, Muramatsu S, Steinman RM. Generation of large numbers of dendritic cells from mouse bone marrow cultures supplemented with granulocyte/macrophage colony-stimulating factor. J Exp Med. 1992;176(6):1693–1702. PMID:1460426.
- Lutz MB. IL-3 in dendritic cell development and function: a comparison with GM-CSF and IL-4. Immunobiology. 2004;209(1–2):79–87. PMID:15481143. doi: 10.1016/j.imbio.2004.03.001.
- Nelms K, Keegan AD, Zamorano J, Ryan JJ, Paul WE. The IL-4 receptor: signaling mechanisms and biologic functions. Annu Rev Immunol. 1999;17:701–738. PMID:10358772. doi: 10.1146/annurev.immunol.17.1.701.
- Yin SY, Wang CY, Yang NS. Interleukin-4 enhances trafficking and functional activities of GM-CSF-stimulated mouse myeloid-derived dendritic cells at late differentiation stage. Exp Cell Res. 2011;317(15):2210–2221. doi: 10.1016/j.yexcr.2011.06.013. PMID:21741972.
- Semino C, Angelini G, Poggi A, Rubartelli A. NK/iDC interaction results in IL-18 secretion by DCs at the synaptic cleft followed by NK cell activation and release of the DC maturation factor HMGB1. Blood. 2005;106(2):609–616. PMID:15802534. doi: 10.1182/blood-2004-10-3906.
- Trinchieri G. Interleukin-12 and the regulation of innate resistance and adaptive immunity. Nat Rev Immunol. 2003;3(2):133–146. PMID:12563297. doi: 10.1038/nri1001.
- Dubois SP, Waldmann TA, Muller JR. Survival adjustment of mature dendritic cells by IL-15. Proc Natl Acad Sci U S A. 2005;102(24):8662–8667. PMID:15932944. doi: 10.1073/pnas.0503360102.
- Burkett PR, Koka R, Chien M, Chai S, Boone DL, Ma A. Coordinate expression and trans presentation of interleukin (IL)-15Ralpha and IL-15 supports natural killer cell and memory CD8+ T cell homeostasis. J Exp Med. 2004;200(7):825–834. PMID:15452177. doi: 10.1084/jem.20041389.
- Van Acker HH, Anguille S, Willemen Y, Van Den Bergh JM, Berneman ZN, Lion E, Smits EL, Van Tendeloo VF. Interleukin-15 enhances the proliferation, stimulatory phenotype, and antitumor effector functions of human gamma delta T cells. J Hematol Oncol. 2016;9(1):101. PMID:27686372. doi: 10.1186/s13045-016-0329-3.
- Srivastava S, Salim N, Robertson MJ. Interleukin-18: biology and role in the immunotherapy of cancer. Curr Med Chem. 2010;17(29):3353–3357. PMID:20712569.
- Fraszczak J, Trad M, Janikashvili N, Cathelin D, Lakomy D, Granci V, Morizot A, Audia S, Micheau O, Lagrost L. Peroxynitrite-dependent killing of cancer cells and presentation of released tumor antigens by activated dendritic cells. J Immunol. 2010;184(4):1876–1884. doi: 10.4049/jimmunol.0900831. PMID:20089706.
- Shimamura H, Cumberland R, Hiroishi K, Watkins SC, Lotze MT, Baar J. Murine dendritic cell-induced tumor apoptosis is partially mediated by nitric oxide. J Immunother. 2002;25(3):226–234. PMID:12000864.
- Taieb J, Chaput N, Menard C, Apetoh L, Ullrich E, Bonmort M, Péquignot M, Casares N, Terme M, Flament C, et al. A novel dendritic cell subset involved in tumor immunosurveillance. Nat Med. 2006; 12(2):214–219. PMID:16444265. doi: 10.1038/nm1356.
- Ibrahim SM, Ringel J, Schmidt C, Ringel B, Muller P, Koczan D, Thiesen HJ, Löhr M. Pancreatic adenocarcinoma cell lines show variable susceptibility to TRAIL-mediated cell death. Pancreas. 2001;23(1):72–79. PMID:11451151.
- Lakshmikanth T, Burke S, Ali TH, Kimpfler S, Ursini F, Ruggeri L, Capanni M, Umansky V, Paschen A, Sucker A, et al. NCRs and DNAM-1 mediate NK cell recognition and lysis of human and mouse melanoma cell lines in vitro and in vivo. J Clin Invest. 2009; 119(5):1251–1263. doi: 10.1172/JCI36022. PMID:19349689.
- Ahrends T, Borst J. The opposing roles of CD4+ T cells in anti-tumour immunity. Immunology. 2018; doi: 10.1111/imm.12941. PMID: 29700809.
- Aguirre AJ, Bardeesy N, Sinha M, Lopez L, Tuveson DA, Horner J, Redston MS, DePinho RA. Activated Kras and Ink4a/Arf deficiency cooperate to produce metastatic pancreatic ductal adenocarcinoma. Genes Dev. 2003;17(24):3112–3126. PMID:14681207. doi: 10.1101/gad.1158703.
- Lu G, Janjic BM, Janjic J, Whiteside TL, Storkus WJ, Vujanovic NL. Innate direct anticancer effector function of human immature dendritic cells. II. Role of TNF, lymphotoxin-alpha(1)beta(2), Fas ligand, and TNF-related apoptosis-inducing ligand. J Immunol. 2002;168(4):1831–1839. PMID:11823516.
- Stary G, Bangert C, Tauber M, Strohal R, Kopp T, Stingl G. Tumoricidal activity of TLR7/8-activated inflammatory dendritic cells. J Exp Med. 2007;204(6):1441–1451. PMID:17535975. doi: 10.1084/jem.20070021.
- Roux S, Apetoh L, Chalmin F, Ladoire S, Mignot G, Puig PE, Lauvau G, Zitvogel L, Martin F, Chauffert B, et al. CD4+CD25+ Tregs control the TRAIL-dependent cytotoxicity of tumor-infiltrating DCs in rodent models of colon cancer. J Clin Invest. 2008; 118(11):3751–3761. doi: 10.1172/JCI35890. PMID:18830416.
- Munich S, Sobo-Vujanovic A, Buchser WJ, Beer-Stolz D, Vujanovic NL. Dendritic cell exosomes directly kill tumor cells and activate natural killer cells via TNF superfamily ligands. Oncoimmunology. 2012;1(7):1074–1083. PMID:23170255. doi: 10.4161/onci.20897.
- Anguille S, Lion E, Tel J, De Vries IJ, Coudere K, Fromm PD, Van Tendeloo VF, Smits EL, Berneman ZN. Interleukin-15-induced CD56(+) myeloid dendritic cells combine potent tumor antigen presentation with direct tumoricidal potential. PLoS One. 2012;7(12):e51851. doi: 10.1371/journal.pone.0051851. PMID:23284789.
- Hill KS, Errington F, Steele LP, Merrick A, Morgan R, Selby PJ, Georgopoulos NT, O’Donnell DM, Melcher AA. OK432-activated human dendritic cells kill tumor cells via CD40/CD40 ligand interactions. J Immunol. 2008;181(5):3108–3115. PMID:18713981.
- Larmonier N, Bonnotte B, Katsanis E. Cytotoxic and antigen presenting functions of T helper-1-activated dendritic cells. Oncoimmunology. 2012;1(4):566–568. PMID:22754789.
- Fotaki G, Jin C, Kerzeli IK, Ramachandran M, Martikainen MM, Karlsson-Parra A, Yu D, Essand M. Cancer vaccine based on a combination of an infection-enhanced adenoviral vector and pro-inflammatory allogeneic DCs leads to sustained antigen-specific immune responses in three melanoma models. Oncoimmunology. 2018;7(3):e1397250. doi: 10.1080/2162402X.2017.1397250. PMID: 29399398.
- Ma A, Koka R, Burkett P. Diverse functions of IL-2, IL-15, and IL-7 in lymphoid homeostasis. Annu Rev Immunol. 2006;24:657–679. PMID:16551262. doi: 10.1146/annurev.immunol.24.021605.090727.
- Fehniger TA, Cooper MA. Harnessing NK cell memory for cancer immunotherapy. Trends Immunol. 2016;37(12):877–888. doi: 10.1016/j.it.2016.09.005. PMID: 27773685.
- Hirao M, Onai N, Hiroishi K, Watkins SC, Matsushima K, Robbins PD, Lotze MT, Tahara H. CC chemokine receptor-7 on dendritic cells is induced after interaction with apoptotic tumor cells: critical role in migration from the tumor site to draining lymph nodes. Cancer Res. 2000;60(8):2209–2217. PMID:10786686.
- Wang X, Zhang X, Fu Z, Yin H. A bioengineered metastatic pancreatic tumor model for mechanistic investigation of chemotherapeutic drugs. J Biotechnol. 2013;166(4):166–173. doi: 10.1016/j.jbiotec.2013.05.008. PMID:23747489.
- Byrne JD, Jajja MR, Schorzman AN, Keeler AW, Luft JC, Zamboni WC, DeSimone JM, Yeh JJ. Iontophoretic device delivery for the localized treatment of pancreatic ductal adenocarcinoma. Proc Natl Acad Sci U S A. 2016;113(8):2200–2205. doi: 10.1073/pnas.1600421113. PMID:26858448.
- Gonzalez-Aparicio M, Alzuguren P, Mauleon I, Medina-Echeverz J, Hervas-Stubbs S, Mancheno U, Berraondo P, Crettaz J, Gonzalez-Aseguinolaza G, Prieto J, et al. Oxaliplatin in combination with liver-specific expression of interleukin 12 reduces the immunosuppressive microenvironment of tumours and eradicates metastatic colorectal cancer in mice. Gut. 2011; 60(3):341–349. doi: 10.1136/gut.2010.211722. PMID:20855451.
- Feldmann G, Habbe N, Dhara S, Bisht S, Alvarez H, Fendrich V, Beaty R, Mullendore M, Karikari C, Bardeesy N, et al. Hedgehog inhibition prolongs survival in a genetically engineered mouse model of pancreatic cancer. Gut. 2008; 57(10):1420–1430. doi: 10.1136/gut.2007.148189. PMID:18515410.
- Bonnotte B, Larmonier N, Favre N, Fromentin A, Moutet M, Martin M, Gurbuxani S, Solary E, Chauffert B, Martin F. Identification of tumor-infiltrating macrophages as the killers of tumor cells after immunization in a rat model system. J Immunol. 2001;167(9):5077–5083. PMID: 11673517.