
ABSTRACT
Chronic inflammation drives the development of colorectal cancer (CRC), where tumor-infiltrating immune cells interact with cancer cells in a dynamic crosstalk. Mast cells (MC), one of earliest recruited immune cells, accumulate in CRC tissues and their density is correlated with cancer progression. However, the exact contribution of MC in CRC and their interaction with colon cancer cells is poorly understood. Here, we investigated the impact of primary human MC and their mediators on colon cancer growth using 2D and 3D coculture models. Primary human MC were generated from peripheral CD34+ stem cells. Transwell chambers were used to analyze MC chemotaxis to colon cancer. Colon cancer cells HT29 and Caco2 differentially recruited MC by releasing CCL15 or SCF, respectively. Using BrdU proliferation assays, we demonstrated that MC can directly support colon cancer proliferation and this effect was mediated by their cellular crosstalk. 3D coculture models with cancer spheroids further confirmed the pro-tumor effect of MC on colon cancer growth, where direct cell-cell contact is dispensable and increased production of multiple soluble mediators was detected. Moreover, TLR2 stimulation of MC promoted stronger growth of colon cancer spheroids. By examining the transcriptome profile of colon cancer-cocultured MC versus control MC, we identified several MC marker genes, which were deregulated in expression. Our study provides an advanced in vitro model to investigate the role of human MC in cancer. Our data support the detrimental role of MC in CRC development and provide a molecular insight into the cellular crosstalk between MC and colon cancer cells.
Introduction
Colorectal cancer (CRC) is the third most commonly diagnosed cancer among both men and women.Citation1 Between 35–50% of those diagnosed will die from CRC, making it the second leading cause of cancer deaths affecting both sexes.Citation1 Recent development of epidermal growth factor receptor (EGFR) and vascular endothelial growth factor (VEGF) targeted inhibitors has prolonged the overall survival in patients with metastatic CRC.Citation2 However, not all patients respond to these targeted inhibitors and this might be due to the heterogeneous nature of colon cancer cells as well as the complexity of tumor microenvironment. Citation2–Citation4
Inflammation is an integral feature of tumor microenvironment.Citation5,Citation6 It is driven by the accumulation of various immune and inflammatory cells and soluble inflammatory mediators, such as cytokines, chemokines, growth factors, lipid molecules, reactive oxygen (ROS), and nitrogen species.Citation5 The interaction between these immune and inflammatory cells and mediators leads to generation of autocrine and paracrine signals that foster cancer growth and metastases.Citation5 Hence, to understand the relationship between these immune cells and colon cancer cells is key to prevent inflammation-driven cancer progression.
Mast cells (MC), one of earliest recruited immune cells during tumorigenesis, can be activated by immunologic and non-immunologic factors present in tumor microenvironment.Citation7,Citation8 Upon activation, they release a plethora of pro-tumorigenic mediators, such as IL-8, VEGF, matrix metalloproteinases and proteases.Citation7,Citation9 Angiogenesis factors (e.g., IL-8) and growth factors (e.g., VEGF) facilitate tumor growth and angiogenesis. Matrix metalloproteinases (e.g., MMP-9) and proteases (tryptase and chymase) degrade components of the extracellular matrix (ECM) and thus favoring the implantation of tumor cells. In addition, MC release TGF-β and adenosine, which subsequently suppress protective responses in tumor microenvironment. On the other hand, MC can also exhibit anti-tumor activity through direct tumor cell cytotoxicity mediated by ROS and TNF-α or indirectly through the release of heparin, IL-9 and stimulation of dendritic cell maturation, whereas in some cases MC are merely an innocent bystander.Citation7
MC accumulate in CRC tissues,Citation10–Citation17 but their exact role is still controversial in cancer progression. Particularly, there are discrepancies regarding the relationship between MC density and tumor progression and clinical outcomes in patients with CRC.Citation7 Some studies suggested MC number is positively associated with a poor prognosis for CRC,Citation10–Citation13,Citation15,Citation17 while other studies had contrasting findings.Citation14,Citation16 This suggests that simply assessing MC number does not provide insight into MC contribution in CRC progression. By using 2D and 3D coculture models, our aim is to investigate the impact of human MC on colon cancer growth and delineate the molecular mechanism of MC-colon cancer cell interaction. Our results support pro-tumor effects of MC on colon cancer growth, where the bidirectional crosstalk between MC and colon cancer cells is responsible for MC recruitment and enhanced cancer growth.
Results
Validation of CD34+ derived human MC
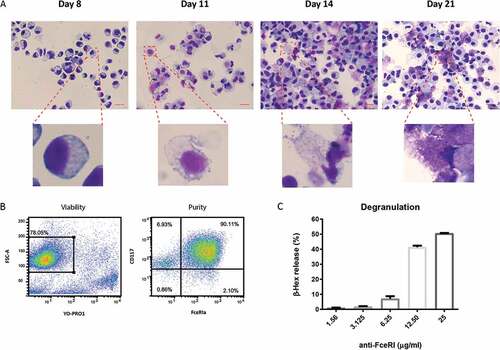
Primary human MC were generated from CD34+ purified peripheral stem cells in the presence of IL-3 and SCF. Cells gradually acquired histochemical markers of differentiated MC including metachromatic cytoplasmic granules ()). To exclude the influence of contaminating cells on our study, we removed dead cells and further purified the live cell fraction with CD117 positive selection. The purity of MC (CD117+, FcεRIa+) was up to 90% after purification ()). MC functionality was assessed by measuring FcεRI-mediated degranulation, as indicated by β-hex release. CD34+ derived human MC showed a dose-response to stimulation of anti-FcεRI MAb and the percentage of β-hex release reached up to 50% ()).
Figure 1. Generation of primary human MC
Colon cancer cells recruit human MC by releasing SCF and CCL15
We investigated MC migration to chemoattractants released by colon cancer cells using 5-μm pore size transwell chambers. CD34+ derived human MC were loaded in the top chamber and the conditioned medium (CM) from HT29 or Caco2 was placed in the bottom chamber. Both HT29 and Caco2 CM induced a significant MC migration (P < 0.0001) ()). We further investigated which chemoattractant was responsible for MC migration towards colon cancer cells. SCF is a well-known chemoattractant for MC migration in the context of cancer.Citation18 Therefore, we added various concentrations of SCF blocking antibody in the migration assay. Inhibition of SCF resulted in up to 65% reduction of MC recruitment to Caco2, but had no effect on that of HT29 ()). As HT29 constitutively express CCL15 (cytokine arrays in )) and its receptors (CCR1 and CCR3) are expressed by human MC,Citation19 we next tested if CCL15 was responsible for MC migration toward HT29. Interestingly, we observed 34% reduction in MC migration toward HT29 in the presence of CCL15 blocking antibody ()). By contrast, we observed no inhibition of blocking CCL15 in Caco2-induced MC recruitment ()). Our data indicate that colon cancer cells differentially recruit MC by releasing soluble mediators, such as SCF and CCL15.
Figure 2. Colon cancer cells recruit human MC via the release of soluble mediators
Figure 3. Human MC directly promote colon cancer proliferation
Figure 4. Crosstalk between human MC and colon cancer cells is necessary for cancer proliferation
Figure 5. TLR2-stimulated MC induce stronger growth of colon cancer in a 3D spheroid model
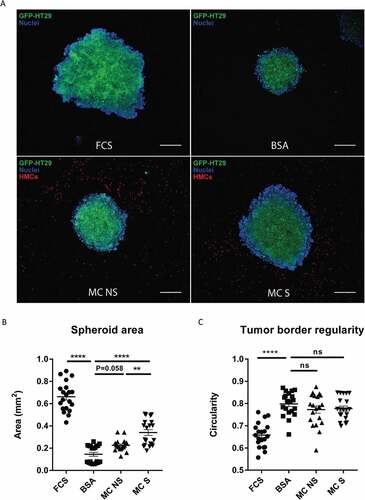
Figure 6. Coculture of colon cancer spheroids with MC induces production of various cytokines
Crosstalk between human MC and colon cancer cells is necessary for cancer proliferation
After establishing that MC accumulate in colon cancer in response to mediators secreted by colon cancer cells, we evaluated the effect of CD34+-derived human MC on colon cancer cell proliferation. To test this, we cocultured HT29 or Caco2 colon cancer cells with MC at different ratios in a serum-free medium. After 72 hr, cancer proliferation was determined using a BrdU uptake assay. MC can directly promote colon cancer cell proliferation (HT29 alone = 0.12, HT29 + MC (1:1) = 0.23, P < 0.05; Caco2 alone = 0.09, Caco2 + MC (1: 0.5) = 0.18, P < 0.05) and there was a dose-dependent increase in cancer proliferation in response to increasing ratios of MC (). To evaluate if this effect is dependent on the bidirectional crosstalk between MC and colon cancer cells, colon cancer cells were cultured with MC-conditioned supernatant alone. Surprisingly, in the absence of MC, the proliferation ratio of HT29 was significantly reduced by 60% (P ˂ 0.05) and this of Caco2 reduced from 40% to 17% (P ˂ 0.01) (). Collectively, our data indicate that cellular crosstalk between MC and colon cancer cells is needed for the pro-tumorigenic effect.
TLR2-stimulated MC induce stronger growth of colon cancer in a 3D spheroid model
As cancer spheroids are more likely to mirror the 3D cellular context and therapeutically relevant pathophysiological gradients of in vivo tumors,Citation20,Citation21 we further tested if human MC could also promote the growth of colon cancer spheroids. To answer this, we developed a coculture model of HT29 spheroids and human MC embedded in an extracellular matrix (ECM). Confocal imaging of HT29 spheroids revealed a considerable increase in tumor size when spheroids were cultured in medium containing FCS for 6 days ()). Moreover, HT29 spheroids exhibited an aggressive phenotype in FCS-containing medium, as indicated by their irregular border and protrusion into ECM ()). Similar to the finding in 2D models (), culturing HT29 spheroids with human MC (MC NS) led to an increase in tumor size compared with the negative control (HT29 BSA = 0.15 ± 0.08 mmCitation2, HT29 + MC NS = 0.23 ± 0.05 mmCitation2, P = 0.058) ().
Chronic inflammation is an integral feature of many cancers, but the drivers of inflammation remain obscure.Citation22 Evidence points to the importance of endogenous “danger signals” released from stressed and dying cancer cells.Citation23–Citation25 They can bind and activate TLRs, frequently TLR2 and TLR4, to trigger immune response.Citation26 Furthermore, TLR2-mediated MC activation has been exploited in the context of a mouse cancer model.Citation27 Therefore, we next asked if the presence of TLR2 agonists could influence human MC-induced colon cancer growth. To test this, we pre-stimulated human MC with TLR2 agonist FSL-1 and cocultured them with HT29 spheroids for 6 days. Interestingly, compared with non-stimulated MC (MC NS), FSL-1 stimulated MC (MC S) induced a markedly stronger growth of HT29 spheroids (HT29 + MC NS = 0.23 ± 0.05 mm2, HT29 + MC S = 0.34 ± 0.12 mm2, P < 0.005) (). We also observed a similar trend when using Pam3CSK4-stimulated MC (data not shown). Moreover, this effect is not caused by the direct action of FSL-1 on HT29 spheroids (Supplemental ). Our data suggest that MC induce stronger colon cancer growth when stimulated by an inflammatory signal, such as TLR2 ligands.
The major characteristic to define malignant cancers is their invasiveness. In order to evaluate the invasion capacity of HT29 spheroids, we calculated their circularity and a lower value (0–1) predicts a better invasiveness ability. HT29 spheroids exhibited an invasive phenotype in 10% FCS medium, while a smooth border remained in 1% BSA medium (HT29 FCS = 0.66, HT29 BSA = 0.80, P < 0.0001) ()). Nevertheless, we observed no significant difference in circularity between spheroids cocultured with MC and control spheroids ()), indicating that in this setting MC have no direct effect on the invasiveness of colon cancer cells. To investigate whether cell-cell contact is necessary for MC-induced colon cancer growth, we reconstructed a 3D view of the spacious relationship between human MC and HT29 spheroid by the end of coculture (Supplemental video). From every direction of the coculture model, no direct cell-cell contact was observed between HT29 and human MC. This indicates that cell-cell contact with cancer cells is not needed for MC to promote tumor growth and other mechanism, such as secreted mediators, may be involved in the cellular communication.
Cytokines produced in 3D MC-colon cancer spheroid coculture
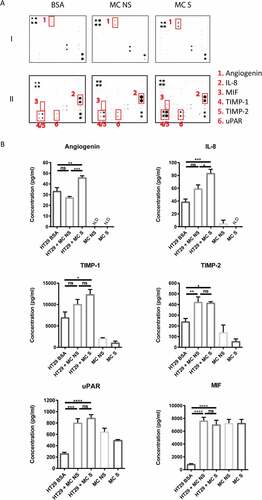
To dissect the mediator profile responsible for MC-HT29 crosstalk, we measured 108 cytokines/chemokines in the supernatant of 3D coculture by antibody arrays. Increased levels of angiogenin, IL-8, MIF (macrophage migration inhibitory factor), TIMP-1/2 (tissue inhibitor of metalloproteinases) and uPAR (urokinase receptor) were detected in the coculture compared with HT29 alone ()). ELISA assays were then carried out to quantify the concentration and assess the source of these mediators ()).
Stimulation of MC with FSL-1 led to higher levels of angiogenin and IL-8 released from the coculture with HT29 (P < 0.005), while there was no significant difference observed between HT29 alone and HT29 cocultured with non-stimulated MC ()). Only little angiogenin and IL-8 was released by human MC alone, suggesting that the source of these mediators was mainly HT29 ()). Furthermore, the increase of angiogenin and IL-8 was not due to the direct action of FSL-1 on HT29 (Supplemental ).
Coculture with MC led to higher levels of secreted TIMP-1 and TIMP-2 ()). Notably, human MC themselves were able to secret measurable levels of TIMP-1 (2*10Citation5 cells – 2,078 ± 181.6 pg/ml) and TIMP-2 (2*10Citation5 cells – 139.3 ± 69.31 pg/ml) ()), implying that levels of TIMP-1/2 in the coculture were contributed by both HT29 and MC. Similarly, 3-fold higher levels of uPAR were detected in the coculture and human MC constitutively secreted uPAR (2*10Citation5 cells – 647.3 ± 61.69 pg/ml) ()). Interestingly, HT29 themselves secreted low amounts of MIF ()). High levels of MIF in the coculture may be contributed by MC, as they constitutively secreted high amounts of MIF (2*10Citation5 cells – 7,263 ± 583.5 pg/ml) ()).
Deregulated genes in colon cancer-cocultured MC
Transcriptome analysis can provide further molecular insight into how colon cancer cells may educate MC as a pro-tumor player. Therefore, we compared the transcriptomic signature of MC cocultured with HT29 spheroids versus MC cultured only in ECM without HT29. Log2-transformed gene expression fold change (log2FC) in HT29-cocultured MC (CCS) was calculated over control MC (CTR). At the specified significance level of corrected P value < 0.05 and log2FC > 0.2, expression of 281 genes was found deregulated in CCS compared with that in CTR ()). Notably, 5 upregulated genes (NOTCH1, PTGS2, PTGER4, VEGFA, MMP2) ()) and 1 downregulated gene (ITGA3) ()) were predicted as possible MC marker genes associated with HT29 spheroid coculture (Supplemental table 2).
Figure 7. Deregulated genes in MC cocultured with colon cancer spheroids
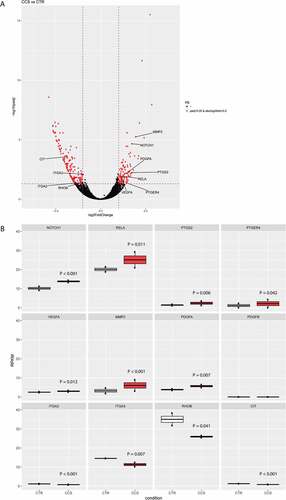
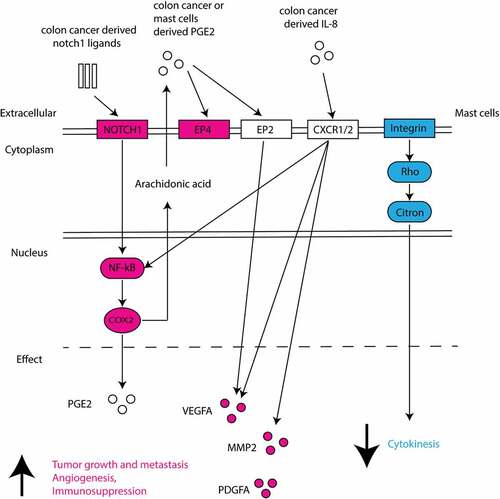
We identified various canonical pathways which are enriched for these MC marker genes. Intriguingly, the Notch1 – NF-κB – COX2 canonical pathway was found enriched in CCS (Supplemental ). RelA, a nuclear factor NF-κB subunit, was upregulated in the gene expression analysis ()) and its activity can be triggered by Notch1 signaling, leading to upregulated PTGS2 (also known as COX-2, prostaglandin-endoperoxide synthase 2) ()). PTGER4 (prostaglandin E receptor 4), a gene encoding EP4, was also upregulated ()), which supports an increased activity of PGE2-EP4 interaction. HT29 coculture induced upregulated VEGFA in MC ()), which could be a downstream product of Notch1- NF-κB canonical pathway (Supplemental ). In addition, HT29 promoted gene expression of PDGFA (platelet derived growth factor subunit a) and MMP2 (matrix metalloproteinase 2) in MC ()), which are the factors supporting tumor growth and metastasis. Another pathway, integrin-Rho-Citron, was found enriched, as supported by downregulation of ITGA2/3 (integrin alpha-2/3), RHOB (ras-related homology B) and CIT (citron) ()). The downregulation of integrin-Rho-Citron pathway indicates lower level of cytokinesis in HT29-associated MC (Supplemental ).
Discussion
In this study, we have used coculture models of primary human MC and colon epithelial cancer cells HT29 and Caco-2 to investigate the effect of MC on colon cancer development. To investigate the spatial interaction and molecular mechanism of MC-colon cancer communication, we developed an advanced in vitro 3D coculture model. Our experiments demonstrate a bidirectional communication between MC and colon cancer cells leading to MC attraction toward cancer cells, release of pro-tumorigenic mediators and increased cancer cell proliferation.
Prolonged low-grade inflammation is a hallmark of cancer and MC play a central role in the inflammatory response associated with cancer.Citation7 MC density in CRC tissues is positively associated with poor clinical outcomes in patients Citation10–Citation13,Citation15,Citation17 and decreased intestinal tumor growth has been observed in MC-deficient mice.Citation28,Citation29 Our study further provides experimental evidence that primary human MC promote colon cancer growth by stimulating production of pro-tumorigenic mediators in a bidirectional manner. Thus far, most studies in human MC-cancer interaction were using MC cell lines (LAD2 and HMC-1) Citation30–Citation35 with specific limitations that these cell lines are leukemia-derived (e.g. obtain a nature of cancer cells) and hardly express MC proteases or MC-specific receptors.Citation36 77% of infiltrating MC in human CRC tissues are found to express both tryptase and chymase, which are considered as MCTC.Citation16 Moreover, Khan et al have observed that submucosal MC, but not mucosal MC, increased as the disease progressed from colitis to invasive cancer in patients.Citation35 In the current study, we used primary human MC derived from peripheral CD34+ cells, which may better represent qualities of CRC-infiltrating MC subtype (MCTC or submucosal MC) including the expression of FcɛRI, tryptase and chymase.Citation37
We show that mediators released from colon cancer cells (Caco2 and HT29) induced human MC chemotaxis. These findings are consistent with clinical observations, where high infiltration of MC has been observed in human colon cancer.Citation10–Citation13,Citation15–Citation17 MC migration toward Caco2 was observed solely SCF-dependent. SCF is an important growth factor for MC, but also induces chemotaxis and survival.Citation38 The importance of SCF in attracting MC into tumor environment was previously demonstrated by the migration of mouse primary MC toward mouse H22 hepatocarcinoma cells.Citation18 Surprisingly, HT29 colon cancer cells induced MC chemotaxis partly via the secretion of CCL15, while no SCF-induced migration was involved. This may reflect the intrinsic biological difference among individual colon cancers. HT29, but not Caco2, is a SMAD4-deficient colon cancer cell and loss of SMAD4 correlates with elevated CCL15 expression.Citation39,Citation40 This is of particular interest, because in a mouse xenograft model, CCL15 secreted from SMAD4-deficient colon cancer cells recruited CCR1+ cells, resulting in aggressive tumor growth and metastasis. In the same study, it was found that CCL15 positively correlated with a worse survival in patients with CRC.Citation39,Citation40 Human MC express surface receptors for CCL15, which are CCR1 and CCR3.Citation19 Therefore, based on our current data it is reasonable to speculate that MC may be among those infiltrating CCR1+ cells and subsequently contribute to colon cancer growth. This notion is consistent with a study in APC∆Citation8,Citation41 mouse model, where they suggest MC represent CCR1+ immature myeloid cells in the tumor invasive front.Citation28 Subsequent RNA sequence analysis revealed a less proliferative profile of MC when cocultured with colon cancer cells (Supplemental and ), implying the increased MC density in colorectal cancer tissues might be due to migration rather than local proliferation.
It has been shown that murine MC promote colon cancer growth, as illustrated by MC-deficient mouse models Citation28,Citation29 and the coculture of primary murine MC and mouse colon cancer CT26.Citation17 We present for the first time that primary human MC can directly support human colon cancer proliferation. Importantly, this effect does not solely depend on mediators secreted by MC without receiving signals from cancer cells. Although Khan et al suggested the supernatant of LAD2 is enough to support HT29 colon cancer proliferation,Citation35 in our setting the conditioned supernatant of primary human MC has a much weaker effect on promoting cancer proliferation as compared to the direct coculture, suggesting that the mutual communication between MC and colon cancer cells enhances cancer proliferation. In other words, MC likely receive signals from colon cancer cells and further promote cancer survival and proliferation. Indeed, MC showed upregulated MMP2, VEGFA and PDGFA in gene expression when cocultured with HT29 spheroid. In addition, gene ISG15 (IFN-stimulated factor 15), which is found as a support factor for cancer stem cells in the tumor microenvironment,Citation42 was also upregulated in HT29-cocultured MC (Supplemental ).
A variety of inflammatory factors present in tumor microenvironment can activate MC.Citation7 Among those activators, TLR2 ligands, such as laminin-β1, HMGB1 and S100A9, are upregulated in CRC and have been proposed as biomarkers to monitor cancer progression.Citation43,Citation44 Furthermore, many TLR2 expressing cells are present in CRC stromal.Citation45 In line with the data of Varadaradjalou et al,Citation46 we show that primary human MC constitutively express TLR2 (Supplemental ). To mimic the inflammatory microenvironment in tumor, we pre-stimulated human MC with TLR2 agonist FSL-1 and co-cultured these MC with HT29 spheroids. It has been reported that TLR2 agonists induce the release of TNF-a, IL-5, IL-10 and IL-13 by human MC.Citation46 Nevertheless, we did not detect measurable amount TNF-a, IL-5, IL-10 and IL-13 in the 3D coculture, which might be due to the different source of cultured human MC. Interestingly, TLR2-primed MC significantly enhanced angiogenin and IL-8 production in the co-culture with HT29. We have excluded the possibility of the direct action of FSL-1 on HT29, as illustrated by lack of TLR2 expression in HT29 (Supplemental ) and no increase of angiogenin and IL-8 from HT29 stimulated directly with FSL-1 (Supplemental ). Moreover, secreted IL-8 and angiogenin was not detectable in TLR2-primed MC ()), and gene expression of CXCL8 (gene coding IL-8) and ANG (gene coding angiogenin) was not upregulated in TLR2-primed MC in coculture with HT29 (data not shown). Therefore, it is reasonable to speculate that the enhanced growth of colon cancer causes increased production of IL-8 and angiogenin. Further RNA sequence analysis revealed that ALOX5 (gene coding 5-lipoxygenase, 5-LOX) was upregulated in TLR2-primed MC in coculture with HT29 (Supplemental and -LOX is a key enzyme for leukotriene synthesis. This is of particular interest, as increased expression of 5-LOX promotes colon cancer cell proliferation in a direct mannerCitation41,Citation47. However, more work is needed to determine how MC support colon cancer growth via 5-LOX.
Increased cytokines produced in MC-HT29 co-culture correlate with clinical significance. For instance, increased TIMP-1 and TIMP-2 are associated with a poor prognosis in patients, which are produced by colon cancer cells and adjacent stroma cells.Citation48–Citation50 Notably, our data reveal for the first time that primary human MC are able to express and secrete both TIMP-1 and TIMP-2. In addition, uPAR expression, especially in tumor-associated stromal cells, is negatively associated with CRC patient survival Citation51 and MIF can promote intestinal inflammation and colonic carcinogenesis.Citation52 Consistent with the finding of Rossi et al,Citation53 we show that primary human MC constitutively produce uPAR and are the major source of MIF. Collectively, these findings reflect the capacity of MC to support the tumor microenvironment favoring colon cancer growth and implies a correlation between MC infiltration and colon cancer progression.
The upregulation of NOTCH1 signaling suggests the presence of notch1 ligands in the MC-HT29 coculture. It has been reported that notch1 ligands (e.g. Jagged1) are highly expressed in colorectal cancer tissues.Citation54 Since no cell-cell contact was detected in the coculture of MC with HT29 spheroid, we speculate that the upregulated NOTCH1 signaling may be induced by soluble form of ligands, where the shedding extracellular domain of notch1 ligands activate notch1 signaling upon clustering.Citation55 Although our RNA sequence data suggest NOTCH1 induces upregulation of COX2 and VEGFA in MC, the contribution of notch1-mediated MC activation to cancer growth is not yet explored. Consistent with the gene expression, VEGF-A is also found upregulated in the coculture supernatant by cytokine arrays (Supplemental ). These findings together support MC as a potent source of VEGF-A and point to a direct contribution of MC to tumor angiogenesis.Citation56,Citation57 PGE2 is one of the products from upregulated COX-2 activity. Intriguingly, PGE2 can strongly induce MC to produce VEGF-A without causing degranulation.Citation58,Citation59 This suggests the upregulated VEGF-A production can also be induced by increased PGE2 activity in MC themselves. Besides, PGE2 induces activation and expansion of both Tregs and MDSC (myeloid-derived suppressor cells) and thus supports immunosuppression in cancer milieu.Citation60 Human MC express multiple PGE2 receptors EP(2–4) with major expression of EP2 and EP3.Citation61 EP2 and EP4 have been reported as inhibitory receptors for MC activation.Citation59,Citation62 Further research is needed to understand the biological meaning of upregulated PTGER4 (gene coding EP4) in colon cancer-cocultured MC. Collectively, this supports the concept that in the early phase of cancer formation, colon cancer cells may stimulate MC to produce various pro-tumorigenic mediators in order to create a milieu which favors cancer growth and angiogenesis and supports immunosuppression.
Figure 8. Schematic overview of deregulated genes and associated pathways in colon cancer-cocultured MC
In conclusion, a better understanding of MC-colon cancer interaction may provide therapeutic benefit in CRC treatment. The 3D cancer spheroid coculture model with primary human MC potentially serves as a promising tool to study the role of human MC in various cancer. In future studies, the 3D multicomponent coculture should be developed by incorporation of other stromal/immune cells to further validate the interaction of MC in the complexed tumor microenvironment. Our study supports the detrimental role of MC in CRC development and provides a molecular insight into the bidirectional communication between human MC and colon cancer cells.
Materials and methods
Peripheral autologous hematopoietic stem cells derived from patients were used after written informed consent as approved by the ethics committee (TCBio 16–089) of the Utrecht Medical Center, Utrecht, the Netherlands, in accordance with the Declaration of Helsinki (59th WMA General Assembly, Seoul, October 2008), and in compliance with guidelines from the Ethical Committee and European Union legislation.
Generation of primary human MC
CD34+ derived human MC were generated from surplus autologous stem cell concentrates as previously described by Schmetzer at al.Citation37 Briefly, frozen stem cell concentrates were rapidly thawed at 37°C under sterile conditions, and poured in a large cell culture flask (Greiner, 661195). 20% human serum albumin clinical solution (HSA) (Sanquin), 6% hydroxyethyl starch clinical solution (Braun) and RMPI containing 10 U/ml Heparin (LEO pharma) were then added slowly and consecutively to the cell concentrate. Cells were then filtered through a cell dissociation sieve (Sigma, CD1-1KT) and incubated with 200 U.I./ml DNAse (Roche, 04536282001) for 15 min. After washing, cells were resuspended in PBS containing 4% HSA and incubated with Fc-Block (Miltenyi, 130–059-901) for 15 min, CD34+ positive selection cocktail (StemCell, 18056) for 15 min and nanoparticles for 10 min. Subsequently, CD34+ cells were sorted with an EasySep® Magnet (StemCell, 18000) according to the manufacturer’s protocol. Finally, sorted cells were resuspended in serum-free expansion medium (SFEM) (StemCell, 09650) supplemented with human LDL (50 μg/ml) (StemCell, 02698). On day 1, human recombinant IL-3 (100ng/ml) (Biolegend, 578006) and SCF (100ng/ml) (Miltenyi, 130–096-695) were added. Every three to four days, IL-3 and SCF were added to a final concertation of 20ng/ml. At the end of the second week, MC were maintained under 20ng/ml SCF with the withdrawal of IL-3. From day 17 on, cells were ready to use. They were further purified using a dead cell removal kit (Miltenyi, 130–090-101) followed by CD117 positive selection (Miltenyi, 130–091-332) according to the manufacturer’s protocol. The purity of human MC was assessed by flow cytometry based on the surface expression of CD117 (eBioscience, 17–1178-42)and FcεRIa (eBioscience, 25–5899-42) using a BD FACSCanto II (Becton Dickinson, Vianen, the Netherlands).
β-hexosaminidase assays
Human MC were activated with anti-human FcεRIa MAb (eBioscience, 25–5899-42) in varying concentrations of 1.56 – 25 μg/ml at 37°C for 1 hr. Cells were lysed with 5% Triton X-100 in order to quantify the total β-hexosaminidase (β-hex) content. Supernatant was collected and incubated with 200 μM 4-methylumbelliferyl-β-d-glucopyranoside (4-MUG) at 37 °C for 1 hr. Enzyme reaction was then terminated by adding 0.1M glycine buffer. The β-hex content was quantified by measuring fluorescence at λex360/em460 nm. The percentage of β-hex release was calculated as: (A − B)/(T − B) × 100%, where A is the amount of β-hex released from stimulated cells, B is that released from unstimulated cells, and T is total β-hex content released from the positive control.
Colon cancer cell lines
Human colon cancer cell lines, HT29 and Caco2, were obtained from American Type Tissue Culture Collection. HT29 were grown in McCoy medium (Gibco) supplemented with heat-inactivated 10% fetal calf serum (FCS), and 100 μg/ml pen/strep (penicillin and streptomycin, Gibco, 26600080). Caco2 were cultured in EMEM medium (Lonza, BE12-611F/12) supplemented with 10% FCS, 100 μg/ml pen/strep, 1% non-essential amino acids, 1% L-glutamine and 1% sodium pyruvate (Gibco, 11360–039). All cells were cultured in a humidified 37°C/5% CO2 incubator. Green fluorescent protein (GFP) expressing HT29 were generated by transfection with pMONO-neo-GFP plasmid containing GFP and neomycin resistance genes (Invivogen, pmonon-gfp) by electroporation (Nucleofector, Lonza, Belgium). GFP-transfected HT29 were then selected under Geneticin (Gibco, 10131035).
Preparation of conditioned medium
For the production of colon cancer (HT29- and Caco2-) conditioned medium, cells were grown to 100% confluency in standard medium. This medium was removed and replaced with serum-free medium for 48 hr. The conditioned medium was then collected, centrifuged and used for migration assays. For the production of human MC supernatant, 2 × 10Citation5/ml cells were suspended in the serum-free medium of colon cancer cells (McCoy or EMEM, respectively) supplemented with 1% BSA (Sigma, A4161) and 20ng/ml SCF for 24 hr. Subsequently, MC-conditioned supernatant was collected, centrifuged and used for proliferation assays.
Chemotaxis assay
The upper chamber of 5-μm transwell 96-well plate was loaded with CD34+ derived human MC in serum-free medium. The lower chamber was filled with HT29- or Caco2- conditioned medium with or without SCF blocking Ab (PeproTech, 500-P48) or CCL15 blocking Ab (R&D, AF628) or isotype Abs at concentrations of 1.25- 5μg/ml. After 4 hr, the filter inserts were removed and the number of MC migrating into the lower chamber was quantified by flow cytometry.
Cancer proliferation assay
2 × 10Citation3 cells/well colon cancer cells were seeded and grown in 96-well plate for 24 hr. The standard medium was removed and replaced with either serum-free medium containing human MC at various ratio or MC-conditioned supernatant. The cells were then cocultured for 72 hr. Followed by the removal of MC suspension, DNA synthesis of colon cancer cells was measured by BrdU ELISA kit (GE Healthcare, RPN250) according to the manufacturer’s protocol.
Colon cancer spheroid
Multicellular cancer spheroids were formed using the hanging drop method Citation63. Briefly, drops of 250 GFP-transfected HT29 cells in 20µl were made in standard medium and incubated upside-down for 4 days. Cancer spheroids were then embedded in extracellular matrix (ECM) as previously described Citation64. Shortly, ECM mixture was prepared on ice containing Matrigel (Corning, 356231) and non-pepsinized rat-tail collagen type I (2.3mg/ml) (Corning, 354249) at a ratio of 1:1 or 1:100. Spheroids suspended in 40 µl of pre-heated culture medium were mixed with 200 µl of 1:1 ECM (Matrigel: Collagen type I). 50 µl drops of spheroid-ECM mixtures were then placed in a 24-well plate previously coated with 1:100 ECM (Matrigel: Collagen type I) base layer. For full polymerization of the gel, plates were incubated at 37°C for 1hr. Subsequently, 1ml coculture medium with or without human MC (2 × 10Citation5/ml) was added. TLR2-stimulated MC was pre-treated with FSL-1 (1µg/ml) for 4 hr. MC were stained with cell tracker CMPTX dye (ThermoFisher, C34552) prior to the coculture. After 6-day coculture, GFP-HT29 spheroids were stained with Hoechst to visualize cell nuclei (Life technologies, H1399) and imaged using confocal microscopy (Yokogawa CV7000, Wako, San Diego, USA). Spheroid area and invasion were analyzed using ImageJ software.
Cytokine array
Medium was collected from cocultures of HT29 spheroids and human MC or from cultures of HT29 spheroids alone at the end of incubation. Samples were centrifuged (10,000 rpm, 2 min) to remove particulates and the medium was used for measuring cytokines by multiplexed protein detection using a human cytokine antibody array C1000 (RayBiotech, AAH-CYT-1000) according to the manufacturer’s instructions (the map of cytokine arrays is provided as supplemental table 1).
Elisa
Medium was collected from the coculture or the culture of HT29 spheroids or human MC alone at the end of incubation. Samples were centrifuged (10,000 rpm, 2 min) to remove particulates and the medium was used for quantification of Angiogenin, IL-8, MIF, TIMP-1, TIMP-2 and uPAR by ELISA (Thermo Scientific) according to the manufacturer’s instruction.
Transcriptome analysis of spheroid cultured mast cells
To obtain RNA samples from MC in the spheroid coculture, 1mg/ml collagenase/dispase (Sigma, 10269638001) was added to the ECM mixture and incubated at 37°C for 1hr. Cells were then washed with PBS supplemented with 1% BSA and subsequently stained with YO-PRO1 and antibodies for CD117 and FcεRIa. CD117 and FcεRIa double positive viable cells were sorted using BD Influx™ cell sorter (BD Biosciences, San Jose CA, USA). Control MC cultured in the EMC in absence of HT29 spheroid were stained and sorted in an identical way as HT29-cocultured MC. RNA of purified MC was isolated using PureLink RNA mini kit (ThermoFisher, 12183025), according to the manufacture’s protocol.
RNA samples of human MC were sequenced on an Illumina Nextseq500 platform according to the manufacture’s procedure by the Utrecht Sequencing Facility of the Utrecht University (http://www.useq.nl/). Sequencing libraries were generated using TruSeq Stranded mRNA poly A kit. Sequence reads were checked for quality by FastQC (v0.11.4) after which reads were aligned to GRCh37 using STAR (v2.4.2a) and read groups were added using Picard (v1.141). All samples passed QC and were subsequently processed using HTSeq-count (v0.6.1) on ENSEMBL gene definitions (GRCh37, release 74). R statistical software was used to identify deregulated genes. The P values were computed by Wald test and corrected by the Benjamini-Hochberg procedure. Transcript with a log2-transformed gene expression fold change (log2FC) > 0.2 and adjusted P value < 0.05 were deemed differentially expressed. Canonical pathways and MC marker genes were predicted by IPA software (Ingenuity Pathway Analysis, QIAGEN).
Statistical analysis
Statistical analyses were performed using Graphpad Prism 7 (version 7.03) statistical program, SPSS or R statistical software. Comparison of groups were assessed using the Student’s t test or ANOVA, where appropriate. P values < 0.05 were considered statistically significant.
Disclosure of interest
The authors report no conflict of interest.
Supplemental Material
Download Microsoft Video (AVI) (13.7 MB)Supplemental Material
Download MS Word (2 MB)Acknowledgments
We particularly thank Dr. Marcus Maurer and Dr. Oliver Schmetzer (Department of Dermatology and Allergy, Charité - Universitätsmedizin Berlin, Germany) for technical assistance in setting up primary human mast cell culture. We thank Ger Arkesteijn (Faculty of Veterinary Medicine, Utrecht University, NL) for providing professional assistance with the FACS sorting. We thank UMC Utrecht Bioinformatics Expertise Core for data analysis and data handling. The UMC Utrecht Bioinformatics Expertise Core is subsidized by the University Medical Center Utrecht, Center for Molecular Medicine.
Supplementary Material
Supplemental data for this article can be accessed here.
Additional information
Funding
References
- Moriarity A, O’Sullivan J, Kennedy J, Mehigan B, McCormick P. Current targeted therapies in the treatment of advanced colorectal cancer: a review. Ther Adv Med Oncol. 2016;8:276–293. doi: 10.1177/1758834016646734.
- Passardi A, Canale M, Valgiusti M, Ulivi P. Immune checkpoints as a target for colorectal cancer treatment. Int J Mol Sci. 2017;18(6).
- Boland PM, Ma WW. Immunotherapy for Colorectal Cancer. Cancers (Basel). 2017;9(5).
- Zhao B, Wang L, Qiu H, Zhang M, Sun L, Peng P, Yu Q, Yuan X. Mechanisms of resistance to anti-EGFR therapy in colorectal cancer. Oncotarget. 2017;8:3980–4000. doi: 10.18632/oncotarget.14012.
- Janakiram NB, Rao CV. The role of inflammation in colon cancer. Adv Exp Med Biol. 2014;816:25–52. doi: 10.1007/978-3-0348-0837-8_2.
- Coussens LM, Zitvogel L, Palucka AK. Neutralizing tumor-promoting chronic inflammation: a magic bullet? Science (New York, NY). 2013;339:286–291. doi: 10.1126/science.1232227.
- Varricchi G, Galdiero MR, Loffredo S, Marone G, Iannone R, Marone G, Granata F. Are mast cells masters in cancer? Front Immunol. 2017;8:424. doi: 10.3389/fimmu.2017.00424.
- Kalesnikoff J, Galli SJ. New developments in mast cell biology. Nat Immunol. 2008;9:1215–1223. doi: 10.1038/ni.f.216.
- Theoharides TC, Conti P. Mast cells: the Jekyll and Hyde of tumor growth. Trends Immunol. 2004;25:235–241. doi: 10.1016/j.it.2004.02.013.
- Acikalin MF, Oner U, Topcu I, Yasar B, Kiper H, Colak E. Tumour angiogenesis and mast cell density in the prognostic assessment of colorectal carcinomas. Digestive and Liver Disease: Official Journal of the Italian Society of Gastroenterology and the Italian Association for the Study of the Liver. 2005;37:162–169. doi: 10.1016/j.dld.2004.09.028.
- Ammendola M, Sacco R, Sammarco G, Donato G, Montemurro S, Ruggieri E, Patruno R, Marech I, Cariello M, Vacca A, et al. Correlation between serum tryptase, mast cells positive to tryptase and microvascular density in colo-rectal cancer patients: possible biological-clinical significance. PloS One. 2014;9:e99512. doi: 10.1371/journal.pone.0099512.
- Gulubova M, Vlaykova T. Prognostic significance of mast cell number and microvascular density for the survival of patients with primary colorectal cancer. J Gastroenterol Hepatol. 2009;24:1265–1275. doi: 10.1111/j.1440-1746.2007.05009.x.
- Malfettone A, Silvestris N, Saponaro C, Ranieri G, Russo A, Caruso S, Popescu O, Simone G, Paradiso A, Mangia A. High density of tryptase-positive mast cells in human colorectal cancer: a poor prognostic factor related to protease-activated receptor 2 expression. J Cell Mol Med. 2013;17:1025–1037. doi: 10.1111/jcmm.12073.
- Nielsen HJ, Hansen U, Christensen IJ, Reimert CM, Brünner N, Moesgaard F. Independent prognostic value of eosinophil and mast cell infiltration in colorectal cancer tissue. J Pathol. 1999;189:487–495. doi: 10.1002/(SICI)1096-9896(199912)189:4<487::AID-PATH484>3.0.CO;2-I.
- Suzuki S, Ichikawa Y, Nakagawa K, Kumamoto T, Mori R, Matsuyama R, Takeda K, Ota M, Tanaka K, Tamura T, et al. High infiltration of mast cells positive to tryptase predicts worse outcome following resection of colorectal liver metastases. BMC Cancer. 2015;15:840. doi: 10.1186/s12885-015-1584-3.
- Tan SY, Fan Y, Luo HS, Shen ZX, Guo Y, Zhao LJ. Prognostic significance of cell infiltrations of immunosurveillance in colorectal cancer. World Journal of Gastroenterology. 2005;11:1210–1214.
- Wang S, Li L, Shi R, Liu X, Zhang J, Zou Z, Hao Z, Tao A. Mast cell targeted chimeric toxin can be developed as an adjunctive therapy in colon cancer treatment. Toxins (Basel). 2016;8(3).
- Huang B, Lei Z, Zhang G-M, Li D, Song C, Li B, Liu Y, Yuan Y, Unkeless J, Xiong H, et al. SCF-mediated mast cell infiltration and activation exacerbate the inflammation and immunosuppression in tumor microenvironment. Blood. 2008;112:1269–1279. doi: 10.1182/blood-2008-03-147033.
- Shimizu Y, Dobashi K. CC-chemokine CCL15 expression and possible implications for the pathogenesis of IgE-related severe asthma. Mediators Inflamm. 2012;2012:475253. doi: 10.1155/2012/475253.
- Feder-Mengus C, Ghosh S, Reschner A, Martin I, Spagnoli GC. New dimensions in tumor immunology: what does 3D culture reveal? Trends Mol Med. 2008;14:333–340. doi: 10.1016/j.molmed.2008.06.001.
- Hirschhaeuser F, Menne H, Dittfeld C, West J, Mueller-Klieser W, Kunz-Schughart LA. Multicellular tumor spheroids: an underestimated tool is catching up again. J Biotechnol. 2010;148:3–15. doi: 10.1016/j.jbiotec.2010.01.012.
- Hanahan D, Weinberg RA. Hallmarks of cancer: the next generation. Cell. 2011;144:646–674. doi: 10.1016/j.cell.2011.02.013.
- Chen GY, Nunez G. Sterile inflammation: sensing and reacting to damage. Nat Reviews Immunol. 2010;10:826–837. doi: 10.1038/nri2873.
- Iwasaki A, Medzhitov R. Regulation of adaptive immunity by the innate immune system. Science (New York, NY). 2010;327:291–295. doi: 10.1126/science.1183021.
- Tang M, Diao J, Gu H, Khatri I, Zhao J, Cattral MS. Toll-like receptor 2 activation promotes tumor dendritic cell dysfunction by regulating IL-6 and IL-10 Receptor Signaling. Cell Rep. 2015;13:2851–2864. doi: 10.1016/j.celrep.2015.11.053.
- Schaefer L. Complexity of danger: the diverse nature of damage-associated molecular patterns. J Biol Chem. 2014;289:35237–35245. doi: 10.1074/jbc.R114.619304.
- Oldford SA, Haidl ID, Howatt MA, Leiva CA, Johnston B, Marshall JS. A critical role for mast cells and mast cell-derived IL-6 in TLR2-mediated inhibition of tumor growth. Journal of Immunology (Baltimore, Md. 1950;2010(185):7067–7076.
- Gounaris E, Erdman SE, Restaino C, Gurish MF, Friend DS, Gounari F, Lee DM, Zhang G, Glickman JN, Shin K, et al. Mast cells are an essential hematopoietic component for polyp development. Proc Natl Acad Sci U S A. 2007;104:19977–19982. doi: 10.1073/pnas.0704620104.
- Wedemeyer J, Galli SJ. Decreased susceptibility of mast cell-deficient Kit(W)/Kit(W-v) mice to the development of 1, 2-dimethylhydrazine-induced intestinal tumors. Lab Invest. 2005;85:388–396. doi: 10.1038/labinvest.3700232.
- Strouch MJ, Cheon EC, Salabat MR, Krantz SB, Gounaris E, Melstrom LG, Dangi-Garimella S, Wang E, Munshi HG, Khazaie K, et al. Crosstalk between mast cells and pancreatic cancer cells contributes to pancreatic tumor progression. Clinical Cancer Research: an Official Journal of the American Association for Cancer Research. 2010;16:2257–2265. doi: 10.1158/1078-0432.CCR-09-1230.
- Attarha S, Roy A, Westermark B, Tchougounova E. Mast cells modulate proliferation, migration and stemness of glioma cells through downregulation of GSK3beta expression and inhibition of STAT3 activation. Cell Signal. 2017;37:81–92. doi: 10.1016/j.cellsig.2017.06.004.
- Roy A, Libard S, Weishaupt H, Gustavsson I, Uhrbom L, Hesselager G, Swartling FJ, Pontén F, Alafuzoff I, Tchougounova E. Mast cell infiltration in human brain metastases modulates the microenvironment and contributes to the metastatic potential. Front Oncol. 2017;7:115. doi: 10.3389/fonc.2017.00115.
- Rudolph MI, Boza Y, Yefi R, Luza S, Andrews E, Penissi A, Garrido P, Rojas IG. The influence of mast cell mediators on migration of SW756 cervical carcinoma cells. J Pharmacol Sci. 2008;106:208–218.
- Melillo RM, Guarino V, Avilla E, Galdiero MR, Liotti F, Prevete N, Rossi FW, Basolo F, Ugolini C, De Paulis A, et al. Mast cells have a protumorigenic role in human thyroid cancer. Oncogene. 2010;29:6203–6215. doi: 10.1038/onc.2010.348.
- Khan MW, Keshavarzian A, Gounaris E, Melson JE, Cheon EC, Blatner NR, Chen ZE, Tsai F-N, Lee G, Ryu H, et al. PI3K/AKT signaling is essential for communication between tissue-infiltrating mast cells, macrophages, and epithelial cells in colitis-induced cancer. Clinical Cancer Research: an Official Journal of the American Association for Cancer Research. 2013;19:2342–2354. doi: 10.1158/1078-0432.CCR-12-2623.
- Guhl S, Babina M, Neou A, Zuberbier T, Artuc M. Mast cell lines HMC-1 and LAD2 in comparison with mature human skin mast cells–drastically reduced levels of tryptase and chymase in mast cell lines. Exp Dermatol. 2010;19:845–847. doi: 10.1111/j.1600-0625.2010.01103.x.
- Schmetzer O, Valentin P, Smorodchenko A, Domenis R, Gri G, Siebenhaar F, Metz M, Maurer M. A novel method to generate and culture human mast cells: peripheral CD34+ stem cell-derived mast cells (PSCMCs). J Immunol Methods. 2014;413:62–68. doi: 10.1016/j.jim.2014.07.003.
- Yu Y, Blokhuis BR, Garssen J, Redegeld FA. Non-IgE mediated mast cell activation. Eur J Pharmacol. 2016;778:33–43. doi: 10.1016/j.ejphar.2015.07.017.
- Inamoto S, Itatani Y, Yamamoto T, Minamiguchi S, Hirai H, Iwamoto M, Hasegawa S, Taketo MM, Sakai Y, Kawada K. Loss of SMAD4 promotes colorectal cancer progression by accumulation of myeloid-derived suppressor cells through the ccl15-ccr1 chemokine axis. Clinical Cancer Research: an Official Journal of the American Association for Cancer Research. 2016;22:492–501. doi: 10.1158/1078-0432.CCR-15-0726.
- Itatani Y, Kawada K, Fujishita T, Kakizaki F, Hirai H, Matsumoto T, Iwamoto M, Inamoto S, Hatano E, Hasegawa S, et al. Loss of SMAD4 from colorectal cancer cells promotes CCL15 expression to recruit CCR1+ myeloid cells and facilitate liver metastasis. Gastroenterology. 2013;145:1064–75.e11. doi: 10.1053/j.gastro.2013.07.033.
- Melstrom LG, Bentrem DJ, Salabat MR, Kennedy TJ, Ding XZ, Strouch M, et al. Overexpression of 5-lipoxygenase in colon polyps and cancer and the effect of 5-LOX inhibitors in vitro and in a murine model. Clinical Cancer Research: an Official Journal of the American Association for Cancer Research. 2008;14:6525–6530. doi:10.1158/1078-0432.CCR-07-4631.
- Sainz B Jr., Martin B, Tatari M, Heeschen C, Guerra S. ISG15 is a critical microenvironmental factor for pancreatic cancer stem cells. Cancer Res. 2014;74:7309–7320. doi: 10.1158/0008-5472.CAN-14-1354.
- Lin Q, Lim HS, Lin HL, Tan HT, Lim TK, Cheong WK, Cheah PY, Tang CL, Chow PKH, Chung MCM. Analysis of colorectal cancer glyco-secretome identifies laminin beta-1 (LAMB1) as a potential serological biomarker for colorectal cancer. Proteomics. 2015;15:3905–3920. doi: 10.1002/pmic.201500236.
- Li TT, Ogino S, Qian ZR. Toll-like receptor signaling in colorectal cancer: carcinogenesis to cancer therapy. World Journal of Gastroenterology. 2014;20:17699–17708. doi: 10.3748/wjg.v20.i47.17699.
- Lu CC, Kuo HC, Wang FS, Jou MH, Lee KC, Chuang JH. Upregulation of TLRs and IL-6 as a marker in human colorectal cancer. Int J Mol Sci. 2014;16:159–177. doi: 10.3390/ijms16010159.
- Varadaradjalou S, Féger F, Thieblemont N, Hamouda NB, Pleau J-M, Dy M, Arock M. Toll-like receptor 2 (TLR2) and TLR4 differentially activate human mast cells. Eur J Immunol. 2003;33:899–906. doi: 10.1002/eji.200323830.
- Che XH, Chen CL, Ye XL, Weng GB, Guo XZ, Yu WY, Tao J, Chen Y-C, Chen X. Dual inhibition of COX-2/5-LOX blocks colon cancer proliferation, migration and invasion in vitro. Oncol Rep. 2016;35:1680–1688. doi: 10.3892/or.2015.4506.
- Jensen SA, Vainer B, Bartels A, Brunner N, Sorensen JB. Expression of matrix metalloproteinase 9 (MMP-9) and tissue inhibitor of metalloproteinases 1 (TIMP-1) by colorectal cancer cells and adjacent stroma cells–associations with histopathology and patients outcome. European Journal Cancer (Oxford, England. 1990;2010(46):3233–3242.
- Song G, Xu S, Zhang H, Wang Y, Xiao C, Jiang T, Wu L, Zhang T, Sun X, Zhong L, et al. TIMP1 is a prognostic marker for the progression and metastasis of colon cancer through FAK-PI3K/AKT and MAPK pathway. J Exp Clin Cancer Res. 2016;35:148. doi: 10.1186/s13046-016-0427-7.
- Groblewska M, Mroczko B, Gryko M, Pryczynicz A, Guzinska-Ustymowicz K, Kedra B, Kemona A, Szmitkowski M. Serum levels and tissue expression of matrix metalloproteinase 2 (MMP-2) and tissue inhibitor of metalloproteinases 2 (TIMP-2) in colorectal cancer patients. Tumour Biology: Journal Int Soc Oncodevelopmental Biol Med. 2014;35:3793–3802. doi: 10.1007/s13277-013-1502-8.
- Boonstra MC, Verbeek FP, Mazar AP, Prevoo HA, Kuppen PJ, Van De Velde CJ, Vahrmeijer AL, Sier CF. Expression of uPAR in tumor-associated stromal cells is associated with colorectal cancer patient prognosis: a TMA study. BMC Cancer. 2014;14:269. doi: 10.1186/1471-2407-14-269.
- Gordon-Weeks AN, Lim SY, Yuzhalin AE, Jones K, Muschel R. Macrophage migration inhibitory factor: a key cytokine and therapeutic target in colon cancer. Cytokine Growth Factor Rev. 2015;26:451–461. doi: 10.1016/j.cytogfr.2015.03.002.
- Rossi FW, Prevete N, Rivellese F, Napolitano F, Montuori N, Postiglione L, Selleri C, De Paulis A. The Urokinase/Urokinase receptor system in mast cells: effects of its functional interaction with fMLF Receptors. Translational Medicine @ UniSa. 2016;15:34–41.
- Qiao L, Wong BCY. Role of Notch signaling in colorectal cancer. Carcinogenesis. 2009;30:1979–1986. doi: 10.1093/carcin/bgp236.
- D’Souza B, Meloty-Kapella L, Weinmaster G. Canonical and non-canonical notch ligands. Curr Top Dev Biol. 2010;92:73–129.
- Ribatti D, Crivellato E. Mast cells, angiogenesis, and tumour growth. Biochim Biophys Acta. 2012;1822(1):2–8.
- Ribatti D, Vacca A, Fau Nico B, Nico B, Fau Crivellato E, Crivellato E, Fau Roncali L, Roncali L, Dammacco F. The role of mast cells in tumour angiogenesis. Br J Haematol 2001;115:514–521.
- Detoraki A, Staiano RI, Granata F, Giannattasio G, Prevete N, de Paulis A, Ribatti D, Genovese A, Triggiani M, Marone G. Vascular endothelial growth factors synthesized by human lung mast cells exert angiogenic effects. J Allergy Clin Immunol. 2009;123:1142–9, 1149.e1-5.
- Abdel-Majid RM, Marshall JS. Prostaglandin E2 induces degranulation-independent production of vascular endothelial growth factor by human mast cells. Journal of Immunology (Baltimore, Md. 1950;2004(172):1227–1236.
- Nakanishi M, Rosenberg DW. Multifaceted roles of PGE(2) in inflammation and cancer(). Semin Immunopathol. 2013;35:123–137. doi: 10.1007/s00281-012-0342-8.
- Feng C, Beller EM, Bagga S, Boyce JA. Human mast cells express multiple EP receptors for prostaglandin E(2) that differentially modulate activation responses. Blood. 2006;107:3243–3250. doi: 10.1182/blood-2005-07-2772.
- Torres-Atencio I, Ainsua-Enrich E, De Mora F, Picado C, Martin M. Prostaglandin E2 prevents hyperosmolar-induced human mast cell activation through prostanoid receptors EP2 and EP4. PloS One. 2014;9:e110870. doi: 10.1371/journal.pone.0110870.
- Timmins NE, Nielsen LK. Generation of multicellular tumor spheroids by the hanging-drop method. Methods Mol Med. 2007;140:141–151.
- Berens EB, Holy JM, Riegel AT, Wellstein A. A cancer cell spheroid assay to assess Invasion in a 3D Setting. Journal of Visualized Experiments: JoVE. 2015. doi: 10.3791/53409.