
ABSTRACT
PDAC is one of the most heterogeneous cancers with low chemotherapeutic sensitivity due to a dense stroma, a weak vasculature and significant biological aggressivity. In cancer, suppressive immune checkpoints are often hyper-activated to ensure an effective evasion of tumor cells from immune surveillance. These immune checkpoints include in part, the B7/butyrophilin-like receptors such as butyrophilin sub-family 3A/CD277 receptors (BTN3A), the B and T lymphocyte attenuator (BTLA) belonging to the B7-like receptors and the programmed death protein (PD-1) with its ligand PD-L1. We evaluated the plasma level of these markers in 32 PDAC patients (learning cohort) by ad hoc developed ELISA’s and showed that there are highly correlated. We used ROC curves and univariate analysis to characterize their prognostic relevance in these patients and showed that their plasma level can serve as survival predictor. Plasma level thresholds that correlate with less than six months survival were established for sPD-1 (>8.6 ng/ml), sPD-L1 (>0.36 ng/ml), sBTLA (>1.91 ng/ml), sBTN3A1 (>6.98 ng/ml) and pan-sBTN3A (>6.92 ng/ml). These thresholds were applied in independent validation cohort composed by 27 new samples and could efficiently discriminate short versus long PDAC survivors. Our study reveals that monitoring the concentration of soluble forms of inhibitory immune checkpoints in plasma can help predict survival in PDAC patients and therefore improve their treatments.
Introduction
Pancreatic Ductal Adenocarcinoma (PDAC) is a major public health issue. It is predicted to reach the second leading cause of cancer-related death in Western countries by 2030.Citation1 Currently, surgery is the only chance for a prolonged survival but, unfortunately, only less than 20% of the PDAC patients are eligible. Despite the improvement in surgical techniques, there has been no major breakthrough in the therapeutic arsenal. In addition, PDAC is one of the most heterogeneous cancers with low chemotherapeutic sensitivity due to a dense desmoplastic stroma, a weak vasculature and significant biological aggressivity. Still today, the prognosis remains extremely dark with a 5-year survival rate around 7%.Citation2 Inflammation and immune evasion are two major hallmarks of cancer and are crucial steps for PDAC progression.Citation3 The immune checkpoint family, belonging to the immunoglobulin superfamily refers to transmembrane receptors and co-receptors involved in immune homeostasis to potentiate inflammation, autoimmunity but also tumor immunity.Citation4,Citation5 However, in cancer, suppressive immune checkpoints are often hyper-activated to ensure an effective evasion of tumor cells from immune surveillance.Citation6 These immune checkpoints include in part, the B7/butyrophilin-like receptors such as butyrophilin sub-family 3A/CD277 receptors (BTN3A),Citation7,Citation8 the B and T lymphocyte attenuator (BTLA) belonging to the B7-like receptorsCitation9,Citation10 and the programmed death protein (PD-1) with its ligands PD-L1 and PD-L2. PD-1/PD-L1 pathways blockade (e.g. Nivolumab, Pembrolizumab) has been widely studied in solids tumors and lymphomas and shows promising therapeutic effect particularly in melanomas and non-small cell lung cancer.Citation11,Citation12 However, their efficacy for other solid tumors such as PDAC remains controversial.Citation13 Other immune checkpoints such as the BTN3A sub-family, who play an important role in Vϒ9Vδ2 T-cells activation and regulation, have been described as therapeutic targets in cancer. BTN3A members have been recently shown to be prognostic factors in solid cancers.Citation8 On the other hand, the B and T lymphocyte attenuator (BTLA) have been shown to inhibit tumor-specific CD8 + T cell proliferation and their high expression correlates with a shorter survival in some solid tumors mainly of the gastrointestinal tract including gastric cancer.Citation9,Citation10 Despite considerable efforts, the complete role of these molecules in cancer immunotherapy and the specific role of soluble ectodomains of these receptors remain to be elucidated. Recently, the plasmatic soluble forms of sPD-1 and sPD-L1 have been shown to negatively correlate with survival in myeloma.Citation14 In the present study, we use specific antibodies to monitor the concentrations of soluble forms of PD-1, PD-L1, BTN3A sub-family (BTN3A1 and pan-BTN3A) and BTLA in plasma of PDAC patients, by ad hoc developed ELISAs. We showed that high plasma levels of these immune checkpoints correlate with poor outcome and can be used as prognostic factors in pancreatic adenocarcinomas.
Results
PDAC patients
Between 2012 and 2016, blood samples of 59 PDAC patients were collected. All patients were recruited under the Paoli-Calmette Institute clinical trial NCT01692873 (https://clinicaltrials.gov/show/NCT01692873) exclusively in case of pancreatic ductal adenocarcinoma diagnosis. From these 59 patients, a total of 32 randomized samples compose the learning cohort. The overall survival median of this cohort is 6.9 months (95% CI (4.4–10.19)) that is very close to the worldwide reference OS median of between 6 and 8 months for this type of patients under palliative chemotherapy.Citation15 We split the learning cohort into two subgroups according to the 6 months OS cut-off. Patients who died of disease before six months were named short-term survival patients (STS, n = 16) and those who died after six months were named long-term survival patients (LTS, n = 16). The threshold levels given by the ELISAs for each tested biomarker were validated in independent validation cohort composed by 27 PDAC patients. All the patient’s characteristics are provided in and for the learning and validation cohort, respectively. Eighty-five percent of patients (50/59) received palliative treatments consisting of gemcitabine (n = 20), gemcitabine–capecitabine (GEMZAR®/XELODA®) combination treatments (n = 2) or FOLFIRINOX combination (n = 28).
Table 1. Clinical characteristics from learning cohort.
Table 2. Clinical characteristics from the validation cohort.
The levels of sPD-1, sPD-l1, Pan-sBTN3A and sBTLA are highly correlated in PDAC patients
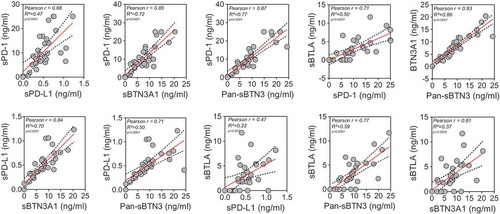
In this study, five specific ELISA tests were utilized to measure plasma levels of sPD-L1, sPD-1, Pan-sBTN3A, sBTN3A1 and sBTLA. Median values were 8.93 ng/ml for sPD-1 (range 0 to 25 ng/ml), 0.44 ng/ml for sPD-L1 (range 0 to 1.23 ng/ml), 7.56 ng/ml for sBTN3A1 (range 0 to 20.41 ng/ml), 8.39 ng/ml for pan-sBTN3A (range 0 to 24.33 ng/ml) and 2.22 ng/ml for sBTLA (range 0 to 11.68 ng/ml). Note that 10/32 patients from the learning cohort presented values below the limit of detection for sBTLA. As shown in , there is a close correlation in the levels of all immune checkpoint soluble forms. As expected, the best correlation (rp = 0.93, p = 3.2 10−14) is observed between sBTN3A1 and the pan-sBTN3A levels. The soluble forms of PD-1 and PD-L1 share a strong correlation (rp = 0.68, p = 1.6 10–5) as already shown in another study on advanced pancreatic cancer patients.Citation16 In all cases, we observed positive correlation between all tested markers.
Figure 1. Correlation between plasma sBTN3A levels (assessed with “pan-sBTN3A” ELISA or “sBTN3A1-specific” ELISA), sPD-1, sPD-L1 and sBTLA in PDAC patients (learning cohort, n = 32). Data are shown in ng/ml. According to the Gaussian distribution of data, the correlation was established using the parametric Pearson correlation coefficient (r).
Plasma levels of sBTN3A1, pan-sBTN3A, sBTLA, sPD-1 and sPD-L1 negatively correlate with overall survival in PDAC patients
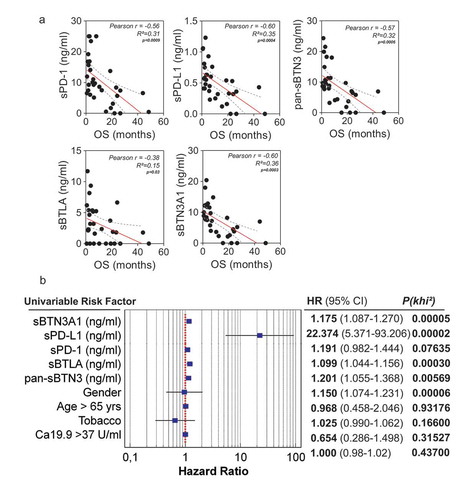
As previously shown, high expressions of PD-1 and PD-L1 are associated with poor prognosis in various types of solid tumors and lymphomas.Citation12,Citation14,Citation17 Moreover, the soluble forms of these factors have been associated with shorter outcome in many types of solid tumors such as digestive solid tumors and lung cancer.Citation16,Citation18,Citation19 However, the association between shorter outcome and high level of sPD-1 and sPD-L1 has been poorly investigated in patients with pancreatic adenocarcinoma. In order to correlate the levels of soluble forms of all immune checkpoints investigated in this study with overall patient’s survival, we first used the linear Pearson correlation model. We observed that sPD-1 and sPD-L1 levels negatively correlate with OS in advanced pancreatic cancer patients ()) (rp = −0.56, p value < 0.0009 and rp = −0.6, p value = 0.0004, respectively). Surprisingly, the same observation was made with the pan-sBTN3A family, sBTN3A1 and BTLA (rp = −0.57, p value = 0.0006; rp = −0.6, p value = 0.0003 and rp = −0.38, p value = 0.03, respectively). We then applied a univariate cox regression model, including other well-known prognostic factors such as CA19.9 plasma level. As shown in ), all soluble immune checkpoint monitored in this study are predictive survival markers in PDAC patients.
Figure 2. Correlation between plasma levels of immune checkpoints (sPD-1, sPD-L1, sBTLA, sBTN3A1and pan-sBTN3A) and PDAC patient overall survival. In Figure 2A, a significant inverse correlation was found between sPD-1 (p < 1.10–4), sPD-L1 (p = 4.10–3), sBTN3A1 (p = 3.10–3), pan-sBTN3A (p = 6.10–4), sBTLA (p = 3.10–2) and patient overall survival (OS). The correlation was established using the parametric Pearson correlation coefficient (r). In Figure 2B, the prognostic relevance of each marker was assessed by a univariate survival analysis using the Cox regression model.
Determination of the optimal cut-off for each marker to classify short term versus long term PDAC survivors
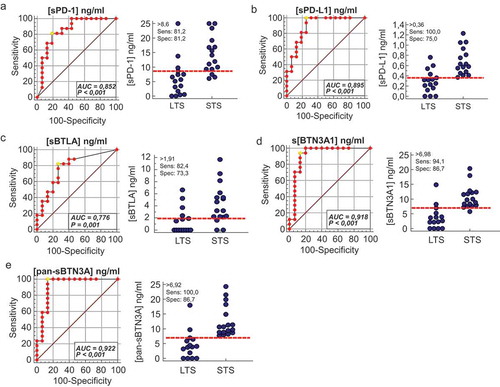
We used ROC curve analysisCitation20 to determine for each marker the optimal cut-off that discriminates short-versus long-term survivors. As shown in A-F (left panels), the optimal cut-off sPD-1 is 8.6 ng/ml (AUC = 0.85, p value < 0.001), 0.36 ng/ml for sPD-L1 (AUC = 0.89, p value < 0.001), 1.91 ng/ml for sBTLA (AUC = 0.78, p value = 0.001), 6.98 ng/ml for sBTN3A1 (AUC = 0.918, p value < 0.001) and 6.92 ng/ml for pan-sBTN3A (AUC = 0.922, p value < 0.001). The plasma levels of each marker are plotted in the right panels for long term and short-term survivors, the red dashed lines indicate the threshold level of each marker. Note that soluble forms of PD-L1 and BTN3A1 share the most important predictive power.
Figure 3. Receiver operating characteristics (ROC) curve analysis of plasma level for sPD-1, sPD-L1, sBTN3A1, pan-sBTN3A and sBTLA. For each marker, ROC curves were plotted for sensitivity and specificity of survival classification (left panels). The yellow circle shows the optimal values of specificity and sensitivity for optimal threshold values (Youden index associated criteria). The plasma levels of each marker were plotted for STS and LTS patients (right panels). The red dashed lines represent the optimal thresholds obtained by ROC analysis. (AUC: area under the curve).
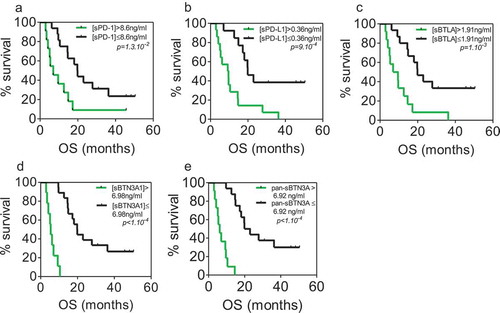
Clinical characteristics of patients with high plasma concentrations of immune checkpoints
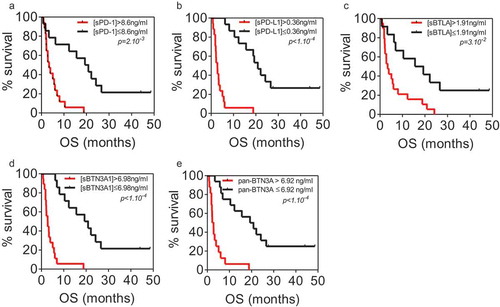
We classified, for each marker tested, the patients with low and high plasma levels for each immune checkpoint, using cut-offs determined beforehand with ROC curves. We plotted the overall survival for these patients by Kaplan Meier curves (). For each biomarker analyzed (panels A to E), we observe strong significant differences in overall survival medians between patients with plasma concentrations above and under thresholds. As expected, the strongest difference in overall survival was observed with sPD-L1 as marker. Patients with high level of sPD-L1 (>0.36 ng/ml) have a median survival of 2.8 months compared to 20.8 months for patients with low level of sPD-L1 (log-rank p value <0.0001). The same observation was made for sBTN3A1 and pan-sBTN3A (2.8 vs 20.0 months for sBTN3A1, log-rank p value <0.0001 and 2.5 vs 20.0 months for pan-sBTN3A, log-rank p value < 0.0001). In the same way, patients with high level of soluble PD-1 (>8.6 ng/ml) have an overall survival median of 3.4 months versus 20.0 months for patients with low level of PD-1 (log-rank p value = 0.0002). Concerning sBTLA, patients with high level (>1.91 ng/ml) have an overall survival median of 3.4 months versus 17.4 months for patients with low level of sBTLA (log-rank p value = 0.0035).
Figure 4. Kaplan Meier analysis of overall survival in patients from learning cohort with high and low plasma levels of sPD-1 (a), sPD-L1 (b), sBTLA (c), sBTN3A1 (d) and pan-sBTN3A (e).
Validation cohort
We used 27 independent blood samples from PDAC patients in order to confirm the correlation levels between each marker tested. In this cohort, the median values were 8.02 ng/ml for sPD-1 (range 2.07 to 25 ng/ml), 0.36 ng/ml for sPD-L1 (range 0.14 to 1.57 ng/ml), 5.63 ng/ml for sBTN3A1 (range 0 to 40 ng/ml), 6.49 ng/ml for pan-sBTN3A (range 0 to 36.29 ng/ml) and 1.99 ng/ml for sBTLA (range 0 to 19.15 ng/ml). As shown in , all tested biomarkers present a close and significant correlation between their plasmatic levels. As expected, we found a significative anti-correlation between survival and high expression level in plasma for each marker (). This emphasizes our previous observation made in the learning cohort ()). We next applied the previously determined threshold levels in learning cohort by the ROC curves approach. As shown in , these thresholds can efficiently discriminate short versus long-term PDAC survivors in the validation cohort. Patients with a high level of sPD-1 (>8.6 ng/ml) have a median survival of 6.98 compared to 19.82 months for patients with low level of sPD-1 (log-rank p value = 3.10−3). Concerning patients with high level of sPD-L1 (>0.36), their median survival is 9.41 versus 19.87 months for patients with low level of sPD-L1 (log-rank p value = 7.10−4). The same observation was made for sBTN3A1 and pan-sBTN3A (5.38 vs 19.82 months for sBTN3A1, log-rank p value < 1.10–4 and 6.16 vs 21.41 months for pan-sBTN3A, log-rank p value < 1.10–3). Finally, the same observation was made for sBTLA (8.27 vs 19.87 months, log-rank p value < 1.10–4).
Figure 5. Correlation between plasma sBTN3A levels (assessed with “pan-sBTN3A” ELISA or “sBTN3A1-specific” ELISA), sPD-1, sPD-L1 and sBTLA in PDAC patients from the validation cohort (n = 27).
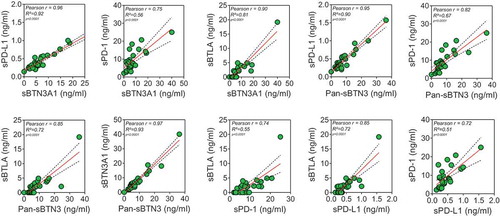
Figure 6. Correlation between plasma levels sPD-1, sPD-L1, sBTLA, sBTN3A1 and pan-sBTN3A) and PDAC patient overall survival from the validation cohort (n = 27). a to e: A significant inverse correlation was found between sPD-1 (r = −0.59; p = 4.10–3), sPD-L1 (r = −0.6; p = 3.10–4), sBTN3A1 (r = −0.51; p = 4.10–3), pan-sBTN3A (r = −0.55; p = 3.10–3), sBTLA (r = −0.45; p = 2.10–2) and patient overall survival. The correlation was established using the parametric Pearson correlation coefficient (r) according to the Gaussian distribution of data (not shown).
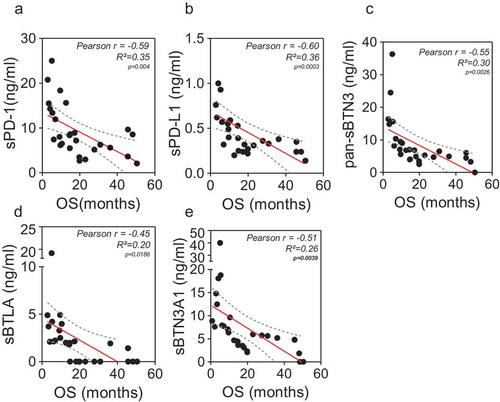
Figure 7. Kaplan–Meier analysis of overall survival in patients from validation cohort with plasma levels above and below the previously determined thresholds of sPD-1 (a), sPD-L1 (b), sBTLA (c), sBTN3A1 (d) and pan-sBTN3A (e).
Discussion
In the present study, we show that plasma levels of the soluble forms of immune checkpoints PD-1, PD-L1, the BTN3A family and BTLA are strongly correlated in pancreatic cancer patients. This is strongly suggestive of a common origin and regulation of these markers in the blood of patients with pancreatic adenocarcinoma. We also found a negative correlation between patients overall survival and plasma levels of each marker. We used ROC curve and univariate cox regression analysis in the learning cohort in order to characterize the prognostic relevance of each marker in PDAC patients. Thresholds were established for sPD-1 (>8.6 ng/ml), sPD-L1 (>0.36 ng/ml), sBTLA (>1.91 ng/ml), sBTN3A1 (>6.98 ng/ml) and pan-sBTN3A (>6.92 ng/ml). These thresholds were validated in an independent cohort of 27 blood samples from PDAC patients and could efficiently discriminate short versus long-term survivors. All patients with very short overall survival show plasma levels above thresholds, as presented in and (learning cohort) and (validation cohort).
The PD-1/PD-L1 axis blockade showed encouraging results in phase II/III clinical trialsCitation11,Citation12,Citation21 for treatment of several solid tumors. However, the efficacy of such treatment (alone or in combination) in patients with pancreatic tumors is quite limited.Citation21–Citation24 Currently, only one study has monitored the concentrations of soluble forms of sPD-1 and sPD-L1 in advanced pancreatic cancer.Citation16 The authors observe significant correlations between the two concentrations but, in contradiction to our study, report no prognostic relevance of these markers in patients with non-resectable pancreatic cancer. Such discrepancy suggests that the choice of the study model and of the methodology employed is critical. In this study, we chose to detect soluble markers in plasma instead of serum because levels detected in serum are 10 times lower than in plasma from the same blood sampling, as described in the Material and Methods section. In addition, some factors might interfere with the determination of the concentration of these factors.Citation25,Citation26 Despite a recent meta-analysis showing that sPD-L1 is an adverse outcome prognostic marker either in serum or plasma fraction of patients with diverse solid tumors,Citation17 we presume that test performed on plasma are more reliable than in serum. Proteins from the butyrophilin 3A subfamily are promising stress-regulated markers recently described in pancreatic cancer immune surveillance. The BTN3A isoforms are overexpressed in pancreatic tumors and involved in the antitumor function of Vγ9Vδ2 cytolytic T-cells.Citation7 The increases in BTN3A transcript levels are correlated with increased concentrations in plasma of the soluble forms of these markers release of soluble forms being apparently triggered by metalloproteinase cleavage. In this work we demonstrated that the concentration of soluble BTN3A is higher in patients with pancreatic cancer than in those with chronic calcifying pancreatitis or intraductal papillary mucinous neoplasms, suggesting that the soluble forms of pan-BTN3A and the specific BTN3A1 isoform are prognostic markers in patients with pancreatic cancer. The B and T lymphocyte attenuator (BTLA/CD272) belongs to the CD28 Ig superfamily and is a type I transmembrane co-signaling receptor.Citation27 This molecule is expressed at high level in resting immune cells including T-cells.Citation28 In cancer patients, BTLA/CD272 is overexpressed in neoplastic cells from chronic lymphocytic leukemiaCitation29 and in melanomas.Citation30 In melanoma patients, BTLA/CD272 is overexpressed in tumor antigen-specific CD8 + T cells. Alike PD-1, BTLA controls T cell immune functions and thus participates in the immune evasion process.Citation9,Citation31 Concurrent blockade of PD1 and BTLA release immune exhaustion in melanoma patients tumor-specific T cells (Fourcade et al., cancer research 2012) Hence, he inhibition of BTLA with blocking antibodies is a potential antitumoral therapeutic approach. Finally, together with sPD-1, sPD-L1, sBTN3A, the soluble form of sBTLA can be used as an adverse prognostic marker for patients with unresectable pancreatic cancer.
In conclusion, our study reveals that monitoring the concentration of soluble forms of inhibitory immune checkpoints in plasma can help predict survival in PDAC patients and suggest that the evolution of soluble checkpoint levels may reflect therapeutic efficacy. More studies are needed to further characterize the release of these soluble forms from tumors and/or stromal cells.
Materials and methods
Patients
Three expert clinical centers (Paoli-Calmettes Institute, Hospital Nord and Hospital La Timone) from Marseille participated in this study after receiving ethics review board approval. A total of 59 diagnosed patients with pancreatic adenocarcinoma were included in this project led by the Paoli-Calmettes Institute (clinical trial NCT01692873). Consent forms of informed patients were collected and registered in a central database. Thirty two samples were used to establish threshold plasma level for each biomarker of interest (learning cohort). These thresholds were confirmed in another independent cohort of 27 patients (validation cohort). All patients were followed from diagnosis until their death or the last follow-up date. Full annotated clinical characteristics were listed in a central database. To be noted is that in the validation cohort were included only patients with locally advanced or metastatic but not patients with a localized disease, whereas in the validation cohort 55% of patients presented a localized PDAC. We confirm that the present study was performed in accordance with REMARK guidelines and the Declaration of Helsinki.
Determination of soluble PD-L1, PD1, pan-btn3a, BTN3A1 and BTLA concentrations in plasma
ELISAs for pan-BTN3A and BTN3A1 are not commercially available. Because some discrepancies were observed in monitoring the three other proteins when using commercial kits obtained from different sources, we decided to have ELISAs of the 5 markers produced by DYNABIO S.A. (Parc de Luminy, Marseille France) according to our specifications. These specifications included (i) verification by tandem mass spectrometry of the antigen sequence, (ii) optimization of the assay by testing all combinations of available monoclonal antibodies in capture and detection, targeting maximal signal/background ratio and sensitivity. Combinations of two or more antibodies in coating and/or detection were also tested to improve performances, (iii) checking sample compatibility (serum vs plasma, interference of the matrix), (iv) ensure that assay can be run at room temperature for easy handling and robustness. The mAbs were made in D. Olive laboratory immunizing mice with recombinant PD-1, PD-L-1, BTN3A1, BTN3A and BTLA molecules. The hybridomas were screened for the ability to bind to recombinant PD-1, PD-L1, BTN3A1, BTN3A and BTLA molecules. They are all of IgG1 isotype.
All five ELISAs follow the same schedule: All steps are run at room temperature. Plates are coated overnight with the antibody selected for capture then washed. Remaining binding sites are blocked to minimize background. All next steps end with plate washing. For the PD-L1 assay, all steps are conducted under shaking. Samples to be tested are incubated for 3 h. Then, the biotinylated antibody selected for detection is incubated for 30 min, followed by incubation for 15 min with the avidin–peroxidase conjugate. Finally, the substrate TMB is incubated for 15 min, the reaction stopped with H2SO4 and the OD read at 450 nm. Concentrations are established by comparison with a range obtained with known concentrations of the recombinant antigen. All recombinant antigens except PD-L1 (obtained from R&D, cat# 156 B7) were home-synthesized.
Studies comparing concentrations of all 5 markers measured in serum and plasma from the same blood collection showed that apparent concentrations in serum were at least three to five times less than in plasma as shown in supplementary Figure 1. This observation shows that clotting results in the apparent loss of a large part of the assayed proteins. Because the mechanism of such loss is unknown, determination of protein concentrations in serum might be affected by factors other than the clinical status of the patient. As consequence, use of serum samples could be misleading and should be avoided. All samples assayed in this study were plasmas. We also observed in all 5 ELISAs an interference of the plasma matrix, which becomes negligible when plasma samples are diluted at least 1/5. In the present study, all plasma samples were at least diluted 1/5 before assay.
Details on the five ELISAs are as follows:
Blood samples
The samples were obtained, under consent, at the time of the EUS-FNA biopsy procedure or prior to surgery for a patient with localized and operable tumor. According to inclusion criteria, all patients were naïve of any chemotherapeutic treatment during blood sampling. Total blood fractions were processed within 4 h from the sampling and centrifuged at 2,200 g during 15 min at 4°C in presence of EDTA. The supernatants (plasma fraction) were aliquoted in cryotubes and stored at −80°C until processing.
Statistical analysis
Correlation analysis was performed using the Pearson correlation test according to the Gaussian distribution of data. Overall survival analysis was performed using the Kaplan––Meier method and log-rank test. Univariate analysis of survival was performed using the Cox-regression model. The receiver operating characteristic (ROC) curves were generated for each marker. The areas under the curves (AUC) were assessed to evaluate each marker performance for discriminating short from long-term survivors. SPSS PASW 23.0 (SPSS Inc. Chicago, IL, USA) software was used for regression analysis. ROC curves were generated using the MedCalc software for Windows, version 18.2.1 (MedCalc Software, Ostend, Belgium). GraphPad Prism 5.01 (GraphPad software Inc. La Jolla, CA, USA) was used for correlation and Kaplan-Meier survival analysis. P values < 0.05 were considered significant.
Acknowledgments
This work was supported by La Ligue Contre le Cancer, INCa, Canceropole PACA, DGOS (labellisation SIRIC), Fondation de France and INSERM to JI, Fondation pour la Recherche Médicale and INSERM to DO. BB and ASC are supported by the Fondation de France.
Disclosure of potential conflicts of interest
No potential conflicts of interest were disclosed.
Supplemental Material
Download Zip (89.1 KB)Supplementary material
Supplemental data for this article can be accessed here.
References
- Chiaravalli M, Reni M, O’Reilly EM. Pancreatic ductal adenocarcinoma: state-of-the-art 2017 and new therapeutic strategies. Cancer Treat Rev. 2017;60:32–43. doi:10.1016/j.ctrv.2017.08.007.
- Wang LM, Silva MA, D’Costa Z, Bockelmann R, Soonawalla Z, Liu S, O’Neill E, Mukherjee S, McKenna WG, Muschel R, et al. The prognostic role of desmoplastic stroma in pancreatic ductal adenocarcinoma. Oncotarget. 2016;7:4183–94. doi:10.18632/oncotarget.6770.
- Martinez-Bosch N, Vinaixa J, Navarro P. Immune evasion in pancreatic cancer: from mechanisms to therapy. Cancers (Basel). 2018; 10(1). pii: E6. doi: 10.3390/cancers10010006.
- Tocheva AS, Mor A. Checkpoint inhibitors: applications for autoimmunity. Curr Allergy Asthma Rep. 2017;17:72. doi:10.1007/s11882-017-0740-z.
- Li B, Severson E, Pignon JC, Zhao H, Li T, Novak J, Jiang P, Shen H, Aster JC, Rodig S, et al. Comprehensive analyses of tumor immunity: implications for Cancer immunotherapy. Genome Biol. 2016;17(1):174. doi: 10.1186/s13059-016-1028-7.
- Pardoll DM. The blockade of immune Slide checkpoints in cancer immunotherapy. Nat Rev Cancer. 2012;12:252–64. doi:10.1038/nrc3239.
- Benyamine A, Le Roy A, Mamessier E, Gertner-Dardenne J, Castanier C, Orlanducci F, Pouyet L, Goubard A, Collette Y, Vey N, et al. BTN3A molecules considerably improve Vγ9Vδ2T cells-based immunotherapy in acute myeloid leukemia. OncoImmunology. 2016;5:e1146843–e. doi:10.1080/2162402X.2016.1146843.
- Benyamine A, Loncle C, Foucher E, Blazquez JL, Castanier C, Chrétien AS, Modesti M, Secq V, Chouaib S, Gironella M, et al. BTN3A is a prognosis marker and a promising target for Vγ9Vδ2 T cells based-immunotherapy in pancreatic ductal adenocarcinoma (PDAC). OncoImmunology. 2017;7:e1372080–e. doi:10.1080/2162402X.2017.1372080.
- Derré L, Rivals JP, Jandus C, Pastor S, Rimoldi D, Romero P, Michielin O, Olive D, Speiser DE. BTLA mediates inhibition of human tumor-specific CD8+ T cells that can be partially reversed by vaccination. J Clin Invest. 2010;120:157–67. doi:10.1172/JCI40070.
- Lan X, Li S, Gao H, Nanding A, Quan L, Yang C, Ding S, Xue Y. Increased BTLA and HVEM in gastric cancer are associated with progression and poor prognosis. OncoTargets Ther. 2017;10:919–26. doi:10.2147/OTT.S128825.
- Tsai KK, Daud AI. The role of anti-PD-1/PD-L1 agents in melanoma: progress to date. Drugs. 2015;75:563–75. doi:10.1007/s40265-015-0376-z.
- Meng X, Liu Y, Zhang J, Teng F, Xing L, Yu J. PD-1/PD-L1 checkpoint blockades in non-small cell lung cancer: new development and challenges. Cancer Lett. 2017;405:29–37. doi:10.1016/j.canlet.2017.06.033.
- Feng M, Xiong G, Cao Z, Yang G, Zheng S, Song X, You L, Zheng L, Zhang T, Zhao Y. PD-1/PD-L1 and immunotherapy for pancreatic cancer. Cancer Lett. 2017;407:57–65. doi:10.1016/j.canlet.2017.08.006.
- Huang S-Y, Lin -H-H, Lin C-W, Li -C-C, Yao M, Tang J-L, Hou H-A, Tsay W, Chou S-J, Cheng C-L, et al. Soluble PD-L1: A biomarker to predict progression of autologous transplantation in patients with multiple myeloma. Oncotarget. 2016;7:62490–502. doi:10.18632/oncotarget.11519.
- Heinemann V, Haas M, Boeck S. Systemic treatment of advanced pancreatic cancer. Cancer Treat Rev. 2012;38:843–53. doi:10.1016/j.ctrv.2011.12.004.
- Kruger S, Legenstein M-L, Rösgen V, Haas M, Modest DP, Westphalen CB, Ormanns S, Kirchner T, Heinemann V, Holdenrieder S, et al. Serum levels of soluble programmed death protein 1 (sPD-1) and soluble programmed death ligand 1 (sPD-L1) in advanced pancreatic cancer. OncoImmunology. 2017;6:e1310358–e. doi:10.1080/2162402X.2017.1310358.
- Wang Q, Liu F, Liu L. Prognostic significance of PD-L1 in solid tumor: an updated meta-analysis. Medicine (United States). 2017;96:e6369–e.
- Guo X, Wang J, Jin J, Chen H, Zhen Z, Jiang W, Lin T, Huang H, Xia Z, Sun X. High serum level of soluble programmed death ligand 1 is associated with a poor prognosis in hodgkin lymphoma. Translational Oncology. 2018;11:779–85. doi:10.1016/j.tranon.2018.03.012.
- Takeuchi M, Doi T, Obayashi K, Hirai A, Yoneda K, Tanaka F, Iwai Y. Soluble PD-L1 with PD-1-binding capacity exists in the plasma of patients with non-small cell lung cancer. Immunology Letters. 2018;196:155–60. doi:10.1016/j.imlet.2018.01.007.
- Hajian-Tilaki K. Receiver operating characteristic (ROC) curve analysis for medical diagnostic test evaluation. Caspian J Int Med. 2013;4:627–35.
- Gong J, Chehrazi-Raffle A, Reddi S, Salgia R, Feng M, Xiong G, Cao Z, Yang G, Zheng S, Song X, et al. Development of PD-1 and PD-L1 inhibitors as a form of cancer immunotherapy: A comprehensive review of registration trials and future considerations. J Immun Ther Cancer. 2018;6:8. doi:10.1186/s40425-018-0316-z.
- Wang J, Reiss KA, Khatri R, Jaffee E, Laheru D. Immune therapy in GI malignancies: A review. J Clin Oncol. 2015;33:1745–53. doi:10.1200/JCO.2015.60.7879.
- Kunk PR, Bauer TW, Slingluff CL, Rahma OE. From bench to bedside a comprehensive review of pancreatic cancer immunotherapy. J Immun Ther Cancer. 2016;4:14. doi:10.1186/s40425-016-0119-z.
- Zheng L. PD-L1 expression in pancreatic cancer. J Natl Cancer Inst. 2017;109(6). doi: 10.1093/jnci/djw304. Print 2017 Jan.
- Alsaif M, Guest PC, Schwarz E, Reif A, Kittel-Schneider S, Spain M, Rahmoune H, Bahn S. Analysis of serum and plasma identifies differences in molecular coverage, measurement variability, and candidate biomarker selection. Proteomics Clin Appl. 2012;6:297–303. doi:10.1002/prca.201100061.
- O’Neal WK, Anderson W, Basta PV, Carretta EE, Doerschuk CM, Barr RG, Bleecker ER, Christenson SA, Curtis JL, Han MK, et al. Comparison of serum, EDTA plasma and P100 plasma for luminex-based biomarker multiplex assays in patients with chronic obstructive pulmonary disease in the SPIROMICS study. J Transl Med. 2014;12:9. doi:10.1186/1479-5876-12-9.
- Watanabe N, Gavrieli M, Sedy JR, Yang J, Fallarino F, Loftin SK, Hurchla MA, Zimmerman N, Sim J, Zang X, et al. BTLA is a lymphocyte inhibitory receptor with similarities to CTLA-4 and PD-1. Nat Immunol. 2003;4(7):670–679. Epub 2003 Jun 8.
- Sedy JR, Gavrieli M, Potter KG, Hurchla MA, Lindsley RC, Hildner K, Scheu S, Pfeffer K, Ware CF, Murphy TL, et al. B and T lymphocyte attenuator regulates T cell activation through interaction with herpesvirus entry mediator. Nat Immunol. 2005;6(1):90–98. Epub 2004 Nov 28.
- M’Hidi H, Thibult ML, Chetaille B, Rey F, Bouadallah R, Nicollas R, Olive D, Xerri L. High expression of the inhibitory receptor BTLA in T-follicular helper cells and in B-cell small lymphocytic lymphoma/chronic lymphocytic leukemia. Am J Clin Pathol. 2009;132:589–96. doi:10.1309/AJCPPHKGYYGGL39C.
- Haymaker CL, Wu RC, Ritthipichai K, Bernatchez C, Forget MA, Chen JQ, Liu H, Wang E, Marincola F, Hwu P, et al. BTLA marks a less-differentiated tumor-infiltrating lymphocyte subset in melanoma with enhanced survival properties. OncoImmunology. 2015;4:e1014246–e. doi:10.1080/2162402X.2015.1014246.
- Baitsch L, Baumgaertner P, Devêvre E, Raghav SK, Legat A, Barba L, Wieckowski S, Bouzourene H, Deplancke B, Romero P, et al. Exhaustion of tumor-specific CD8+T cells in metastases from melanoma patients.