
ABSTRACT
Ovarian cancer (OC) has an overall modest number of mutations that facilitate a functional immune infiltrate able to recognize tumor mutated antigens, or neoantigens. Although patient-derived xenografts (PDXs) can partially model the tumor mutational load and mimic response to chemotherapy, no study profiled a neoantigen-driven response in OC PDXs. Here we demonstrate that the genomic status of the primary tumor from an OC patient can be recapitulated in vivo in a PDX model, with the goal of defining autologous T cells activation by neoantigens using in silico, in vitro and in vivo approaches. By profiling the PDX mutanome we discovered three main clusters of mutations defining the expansion, retraction or conservation of tumor clones based on their variant allele frequencies (VAF). RNASeq analyses revealed a strong functional conservation between the primary tumor and PDXs, highlighted by the upregulation of antigen presenting pathways. We tested in vitro a set of 30 neoantigens for recognition by autologous T cells and identified a core of six neoantigens that define a potent T cell activation able to slow tumor growth in vivo. The pattern of recognition of these six neoantigens indicates the pre-existence of anti-tumor immunity in the patient. To evaluate the breadth of T cell activation, we performed single cell sequencing profiling the TCR repertoire upon stimulation with neoantigenic moieties and identified sequence motifs that define an oligoclonal and autologous T cell response. Overall, these results indicate that OC PDXs can be a valid tool to model OC response to immunotherapy.
Introduction
Nearly 22,000 women are diagnosed with ovarian cancer (OC) annually in the US, with up to 70% of the patients dying from the disease .Citation1 As early detection is nearly impossible, most of the cases are diagnosed at advanced stage when tumor cells are already disseminated throughout the peritoneal cavity, often accompanied by malignant ascites .Citation2 At this stage, the disease is highly heterogeneous with metastases lesions offering a mutational load that differs in magnitude and content from the one in the primary site .Citation3 For these patients, chemotherapy and targeted therapy are rarely curative. With a five years survival rate lower than 30%, Citation4 there is an unmet need for improving upon current targeted therapeutic and immunotherapeutic approaches. On this note, the utilization of murine models of OC can offer a precise in vivo system to study, develop and test experimental therapeutics.
T cells are the main effectors of the adaptive immune responses to cancer and have been used in the clinic for targeting tumor cells through adoptive T cell therapy (ACT). ACT requires the isolation of T cells from the host followed by ex-vivo expansion and reinfusion into the patient. The approach of creating neoantigen-specific T cells has been successfully used in clinical trials for melanomaCitation5,Citation6 and neoantigen reactive CD8 + T cells were identified in patients with non-small cell lung cancer and
positively correlated with response to checkpoint inhibition therapy.Citation7,Citation8 Although a number of immunotherapies have been tested in ovarian cancer,Citation9–Citation13 T cell therapy is in its infancy and only recently investigators started to elucidate the importance of the mutational profile for OC patients. While it has been suggested that the modest mutational load in OC impedes efficient immunotherapies, Citation14 recent reports indicate that T cells from OC patients recognize mutated antigensCitation15 and infiltrating lymphocytes define an immune landscape consistent with positive prognosis in OC patients,Citation16–Citation18 suggesting the presence of a tumor-specific immune infiltrate.
Patient derived xenografts (PDX) elegantly recapitulate primary tumor behavior closely mirroring therapeutic response and resistance, however, while they can model in vivo the effect of chemotherapy and targeted therapy, their utility in profiling the response to immunotherapy is limited due to the lack of a functional immune system.Citation19,Citation20 To circumvent this hurdle, humanized models have been proposed by transplanting CD34+ cells in mice to reconstruct hematopoietic lineages, and consequently, a functional immune system.Citation21 Although appealing to immunotherapy-based studies, this approach remains cumbersome as it depends upon availability of autologous human hematopoietic stem cells (HSCs), which are collected from the bone marrow, and growth factors used for HSCs expansion can also promote tumor revascularization, Citation22 thus altering the effect of the administered therapies. These challenges indicate that there are well-defined technical and biological limitations in profiling anti-tumor immune responses in vivo that so far limited the ability to perform well-rounded immunotherapeutic studies in patient-derived models.
In lieu of these findings, in this proof of concept study we demonstrate that PDXs generated from an OC tumor contain mutational antigens, or neoantigens, inherited from the primary site, that are recognized by autologous T cells. By utilizing in silico, in vitro and in vivo approaches we profiled the primary OC tumor, PDXs and neoantigen-specific T cells, demonstrating that OC neoantigens, conserved in the PDX samples, promote a potent autologous oligoclonal T cell response.
Results
Ovarian cancer PDXs maintain the patient’s mutational and functional profiles
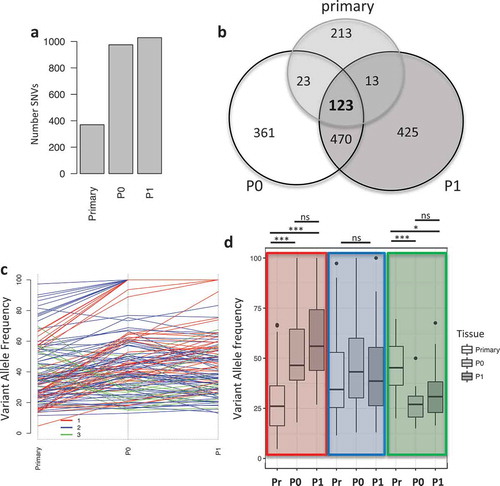
A tumor biopsy from an ovarian cancer patient at Roswell Park was used to establish a patient derived xenograft (PDX) model to be used for molecular profiling. The original tumor was processed and grafted subcutaneously in immunodeficient mice (indicated as P0 passage), and the resulting tumor masses were surgically excised, processed and re-grafted in tumor naïve immunodeficient mice (indicated as P1). The tumor mutational load was evaluated via whole exome sequencing (WES) (Figure S1A) and analyzed utilizing three different variant callers (see Material and Methods). We identified a total of 372, 975 and 1029 mutations in the primary tumor, P0 and P1 PDX passages, respectively (); the increased mutational load in PDX tumors was observed in other PDX models, Citation23–Citation26 moreover, we hypothesize that it is caused by relief from immune selection, present in the patient but absent in immunocompromised mice, which therefore allows for the expansion of mutated clones. We then used the variant allele frequency (VAF) of 123 shared single nucleotide variants (SNVs) to identify clusters of SNVs to infer tumor evolution in vivo (). Using Pearson correlation, we identified three main clusters containing: mutations with increased VAF in vivo (cluster 1, red, n = 40), mutations with constant VAF in vivo (cluster 2, blue, n = 69) and mutations with reduced VAF in vivo (cluster 3, green, n = 14) (). Differences in VAF between the primary tumor and P0 and P1 in cluster 1 and 3 were significant (ANOVA with post-hoc Tukey correction, Table S1), while no significant changes were observed between P0 and P1 or in any condition in cluster 2 (). We then investigated the relatedness of the three tumors at the functional level. We performed whole transcriptome analysis via RNASeq and evaluated pathway activation via single
Figure 1. Mutational landscape in primary tumor and PDXs. a) Barplot indicating the number of mutations in the different samples. b) Venn diagram showing the unique and common mutations in primary and PDX samples. c) Line plot showing the changes in the variant allele frequency (VAF) of mutations common between the primary, P0 and P1 tumors. Colors indicate the mutational cluster calculated via Pearson correlation. Red (cluster 1), blue (cluster 2) and green (cluster 3). d) Boxplot showing the changes in variant allele frequency (VAF) within each sample across the clusters. Highlighted in colors are the clusters and from left to right each cluster shows VAF for primary (Pr), P0 and P1. (*, p < 0.05, ***, p < 0.001, ns = non significant).
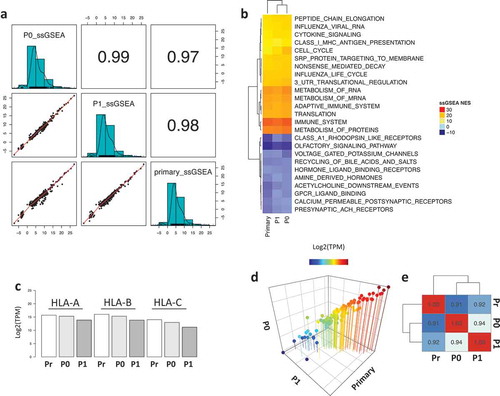
sample gene set enrichment analysis (ssGSEA). The three samples showed a strong positive correlation across the quantified functional profiles (). Interestingly, the most highly enriched pathways by enrichment score are related to immune functions such as MHC Class I antigen processing, cytokine signaling, immune system and metabolism of proteins and mRNA (), with the tumors retaining HLA-A, HLA-B and HLA-C expression over time (). Lastly, the PDX tumors maintained a constant expression of a panel of 110 transporter associated with antigen processing (TAP) genes (, File S1), demonstrating that the status of the antigen presenting machinery was conserved.
Figure 2. Functional enrichment analysis of the primary and PDX samples. a) Correlation plot of the ssGSEA normalized enrichment scores (NES) across the samples. b) Heatmap representing the top and bottom enriched pathways scored by ssGSEA. c) Barplot showing the expression of HLA molecules (HLA-A, HLA-B and HLA-C) across the samples. d) 3D scatter plot of the expression levels of 110 TAP-related genes showing strong correlation across samples. e) Heatmap showing the correlation coefficient of the TAP processing genes across all samples.
Overall these results suggest that, while the changes in clonality observed could be the results of the tumor being challenged by the murine microenvironment, tumors still maintain the same functional profiles present in the primary sample.
Autologous T cells recognize tumor antigens
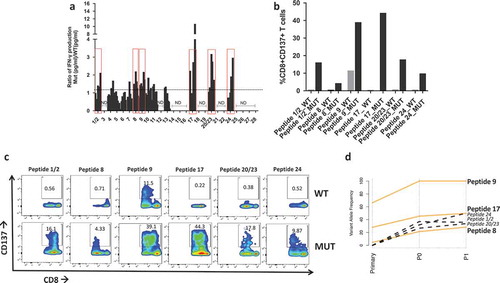
Of the 975 SNVs in P0, 183 were nonsynonymous mutations (, File S2) and were utilized to derive the amino acid sequences of mutated (MUT) peptides, or neoantigens, and wild type (WT) counterpart. Since a key step for antigen recognition is the presentation by the HLA complex onto the surface of antigen presenting cells (APC), where T cells will recognize the antigen(s), MUT and WT peptides were then fetched to NetMHC to predict binding affinity to the patient’s HLAs. Results show that 28 MUT peptides had a predicted affinity for the HLA lower than 500 nM (Table S2). These peptides were ranked based on the specificity of the neoantigens over WT peptides () and selected for in vitro testing. In order to validate the ability of neoantigens to bind and activate T cells, patient’s autologous CD8 + T cells were isolated from PBMCs and cocultured with either WT or mutated peptide-stimulated APCs prior to evaluating IFNγ production via ELISA. Six out of the 30 peptides stimulated higher IFNγ production in CD8 + T cells co-cultured with the mutated peptides when compared with the WT peptides (). We further characterized T cell activation via flow cytometry using the CD137/41BB activation marker .Citation27–Citation29 Six samples had higher CD8+/CD137+ T cells upon stimulation with neoantigens when compared with the WT peptides () and no cross activation of CD4+ T cellsCitation30 was observed (Figure S2). We then evaluated the presence of the six reactive neoantigenic mutations in the primary tumor and the P1 PDX passage. All six mutations were detected in the P1 passage and three out of six (in the NAV1, TRO and CLEC10A genes) were also present in the primary tumor (). Two of the mutations in the primary tumor (NAV1 and TRO) were initially detected only by one caller and following manual review of the raw mutation calls, they were also present in a second caller and therefore included in the analysis. The lack of three of the mutations in the primary tumor could be caused by the sequenced and grafted chunks not coming from the very same specimen although coming from the same patient. To better understand the evolution of the three mutations common across all samples we investigated what SNV cluster they belong to. All three mutations are members of cluster 1, showing increased VAF in the PDXs compared to the primary tumor (), suggesting that clones with these three mutations acquired a proliferative and adaptive advantage in vivo.
Table 1. Sequence analysis of P0 and P1 tumors showing the same neoantigenic mutations being detected in the two passages in NSG mouse models. *, detected only by one caller.
Figure 3. Mutational load in P0 tumors. a) Total number of single nucleotide variants (SNVs) identified in our PDX model (973 total), highlighting the total number of non-synonymous mutations (184). b) Predicted HLA binding affinity in nM of potential neoantigens compared to the wild type peptides. Predictions were obtained using NetMHCpan 4.0.
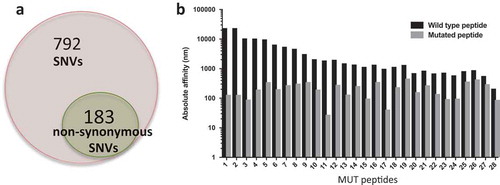
Figure 4. Neoantigen recognition by autologous T cells in-vitro. a) Ratio of IFN-γ production in patient’s T cells at different time points upon coculture with mutated (MUT) or WT peptide-stimulated autologous APCs. Y axis indicates the ratio IFN-γ Mut(pg/ml)/IFN-γ WT(pg/ml) measured via ELISA. Peptides with a ratio > 1 are highlighted in red boxes and utilized for subsequent experiments. ND = no IFN-γ production detected. b) Flow cytometry analysis of CD137 + T cells expressed as percent of activated CD8 + T cells after overnight stimulation with 10 µm mutated (MUT) or WT peptides. c) Flow plots of CD137+/CD8 + T cells in response to coculture with APC pulsed with mutated (MUT) or WT peptides. d) Line plot showing the changes in variant allele frequency of the six neoantigenic mutations common across the primary, P0 and P1 tumors. Orange lines represent mutations present in all samples, black dotted mutations indicate those present in P0 and P1 but absent (VAF = 0) in the primary tumor.
Peptide-pulsed autologous T cells mediate immune response in vivo
Since patient’s autologous T cells can recognize tumor-derived neoantigens with high specificity in-vitro, we sought to evaluate whether autologous T cells can also be activated by peptides contained in tumor lysate. CD8+ T cells-depleted antigen presenting cells (APCs) were pulsed with tumor lysate from P0 and cocultured with patient’s autologous CD8+ T cells or HLA-A2+ T cells from healthy donors, as negative control, prior analysis via flow cytometry. Results show a significant increase in the percentage of CD8+/CD137+ and IFN-γ producing lymphocytes in response to exposure to tumor lysate, while healthy donor’s T cells fail to activate (). These results indicate that ovarian PDX tumors retain the tumor antigenic and neoantigenic moieties recognized by patient’s autologous T cells.
Figure 5. T cell response to neoantigens in vivo. a) Flow plot of CD137+/CD8+ T cells (top) and IFNγ+/CD8 + T cells (bottom) after coculturing patient’s T cells with tumor lysate from P0 (right side), no lysate (left side) or P0 tumor lysate incubated with HLA-A2+ healthy donor’s PBMCs (Negative control). b) Barplot showing the percentage of CD137+/CD8+ T cells (left) and IFN©+/CD8 + T cells (right) stimulated by tumor lysate (*, p < 0.05; **, p < 0.01, ANOVA with Tukey post-hoc correction). c) Flow plot showing CD3 + T cells in the blood two weeks after ACT with peptide naïve T cells (ACT NP) or T cells stimulated with a cocktail of mutated peptides (ACT Mut). d) Quantification of the CD3 + T cells in the blood two weeks post ACT. *, p < 0.05 (Student’s t-test). e) Growth curve of subcutaneous tumors in mice that received ACT using T cells primed with neoantigens (red line, ACT NP) or no peptide (black line, ACT Mut). (*, p < 0.05; ANOVA with Tukey post-hoc correction).
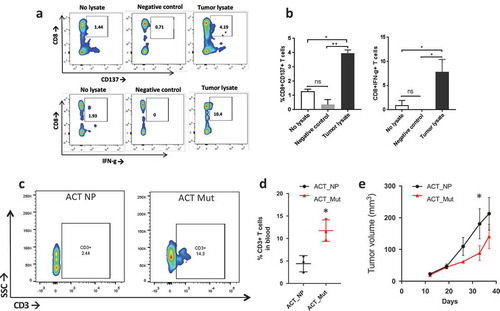
To evaluate whether peptide-pulsed PBMCs have anti-tumor effect in-vivo, we utilized the established PDXs as models for adoptive T cell therapy (ACT). Subcutaneously grafted mice received ACT when tumor reached 50 mm3 in volume using autologous PBMCs stimulated with the pool of immunogenic neoantigens or no peptides. Two weeks post-ACT we evaluated the presence of CD3+ lymphocytes in the mouse blood and found that mice that received ACT with neoantigen-stimulated PBMCs had higher blood levels of CD3+ cells than the no peptide group (). Furthermore, tumor growth was significantly delayed in mice that received ACT with neoantigen-pulsed PBMCs (). At the end point, we analyzed CD3+ infiltration in the tumor and blood. Results show a modest, although significant, increase in CD3+ cells in the tumor (Figure S3) but no significant differences across the groups in the blood (data not shown).
TCR profile of neoantigen recognizing T cells
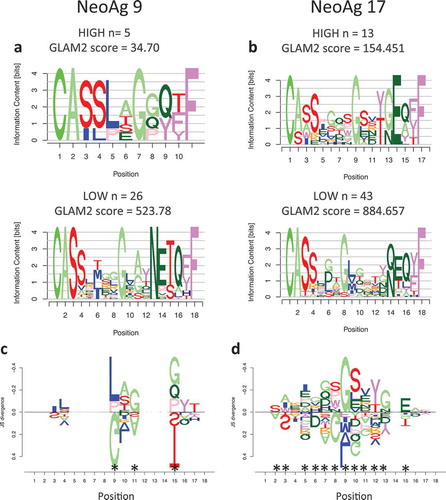
To evaluate whether the response observed in vitro and in vivo is driven by clonal or oligoclonal T cell activation, we profiled the TCR repertoire at the single cell level. APCs were pulsed with the two neoantigens that demonstrated the strongest T cell activation in-vitro (peptides 9 and 17) and cocultured with patient’s autologous T cells, followed by cell sorting selecting activated T cells, as per CD8+/CD137+ expression (Figure S4), and deep sequencing. Since multiple clonotypes were identified per each neoantigen, we hypothesized that in an oligoclonal response the TCRs that recognize neoantigens with high specificity will be detected at higher frequency and will present common traits, different from those detected at low frequency and indicative of background noise. We therefore investigated neoantigen specificity by separating highly represented CDR3 clonotypes (HIGH frequency) from clonotypes present in only one cell (LOW frequency). The two groups of sequences were used to generate motifs () that were compared to assess potential differences in amino acid motifs. Results show a significant difference between the most and least frequent clonotypes () indicating that multiple TCR clonotypes recognized the same neoantigen and expanded upon epitope recognition.
Figure 6. Motif analysis of TCR expanded by neoantigens. a) Sequence motifs of the CDR3 regions for the most frequent clones (HIGH) and the least frequent ones (LOW) expanded upon coculture with APC stimulated by neoantigen 9 or neoantigen 17 (b). c) DiffLogo analysis showing the differences between the HIGH and LOW motifs for TCR specific for neoantigen 9 or 17 (b). The x-axis indicates the antigen position, the y-axis indicates the difference (as JS divergence) between the two different motifs. Asterisks indicate locations that are significantly different between the HIGH and LOW motifs.
Discussion
Patient derived xenograft (PDX) models are a powerful tool in cancer research and offer unique insights into tumor behavior in vivo. In this manuscript we investigated the persistence of neoantigenic moieties in a PDX model derived from an ovarian cancer patient, and their recognition by patient’s autologous T cells. While a limitation of this study is the utilization of samples from a single patient, we offer a deep in silico, in vitro and in vivo characterization of this model as proof of concept that ovarian cancer PDXs can be used for neoantigen research. Whole exome sequencing analyses demonstrate that while tumors evolve in vivo they still contain private and shared non-synonymous mutations that give rise to immunogenic neoantigens, a subset of which is directly inherited from the primary tumor. Liu et al. established intraperitoneal PDX models of OC that have close macroscopic and molecular resemblances with the primary samples .Citation31 Sequencing analysis of two of these PDXs showed a close overlap with one sample (86/82 mutations) but smaller overlap in the second PDX (61/82 mutations), suggesting that albeit changes in the mutational load, OC PDXs are faithful models of patient-derived tumor cells. Differences in mutational load between primary and PDX tumors were also observed in melanoma, lung, gastric and pancreatic cancer studies .Citation23–Citation26 Lung PDXs presented a higher mutational load in the PDX compared to the primary tumor and although retaining a high percentage of the initial mutations, the variant allele frequency of a subset of the SNVs in the PDX was increased,Citation23 mirroring the behavior of the mutations within cluster 1 in our study. In order to optimize the genetic resemblances between the primary and grafted samples, Xie et al. evaluated the mutational load of PDXs established following rapid autopsies from patients with pancreatic adenocarcinoma.Citation25 While PDXs retained a high percentage of the mutations in the primary samples, the overlap was still not complete and variant allele frequency was heterogeneous across samples, with a trend of higher frequency in PDX samples.Citation25 This observation too is in line with our results. We also hypothesize that the lower mutational burden observed in the primary tumor is due to the immune selection that prevents neoantigenic clones to expand in the patient. Once the tumor is passaged in immunocompromised mice, immune selection is lost, therefore allowing for growth and expansion of the clones containing mutations in the SSC4D, DDX60L and OR51B4 genes. This hypothesis is corroborated further by the activation of patients autologous T cells by the neoantigens residing in those three genes, demonstrating pre-existing immunity against peptides 1/2 (SSC4D), 20/23 (DDX60L) and 24 (OR51B4).
In our study, the mutational cluster with the higher number of mutations was cluster 2 (n = 69), which comprises SNVs with conserved variant allele frequency, indicating strong conservation between primary and PDX tumors. Moreover, the functional congruency between the samples was demonstrated further by leveraging whole transcriptome data, which revealed a strong positive correlation of pathway enrichment values across the samples. Interestingly, the top enriched pathways are immune-related, suggesting an active antigen presenting machinery, maintained by the expression of HLA and TAP processing genes.
Previous studies showed how private somatic mutations have been successfully exploited as neoantigens to develop immunotherapies in metastatic melanoma and lung cancers, Citation5,Citation8,Citation32 suggesting that genetic alterations that are not over-represented across a population are clinically useful for personalized T cell therapy. Although ovarian cancer is considered to have an overall low mutational load, Citation14,Citation33 we identified multiple nonsynonymous SNVs that ultimately formed immunogenic neoantigens. Autologous patient’s T cells are uniquely stimulated by neoantigenic peptides and can be activated by tumor lysate in vitro, highlighting a pre-existing anti-tumor immunity. Furthermore, experiments with PDX mice suggest that ACT with neoantigens-stimulated PBMCs can be utilized to mediate tumor growth inhibition in vivo. Although we were limited by the number of patient’s PBMCs available, which limited the number of mice we could use, we still observed a significant reduction in tumor growth, suggesting that T cells targeting mutated peptides can be recognized by neoantigen-primed T cells, which can effectively home to the tumor site and kill cancer cells. While these tumors did not grow intraperitoneally (data not shown), this subcutaneous PDX model retained a modest vascular structure, which likely contributes to T cells homing to the tumor and favors tumor antigen recognition by T cells (Figure S6). In the attempt to dissect the components of the observed neoantigen-specific T cell response, we profiled the TCR repertoire at the single cell level and performed computational analyses that revealed TCR sequence specificity driving an oligoclonal T cell response. The elegant multiplicity of TCRs recognizing shared antigens was previously reportedCitation34–Citation37 and here we demonstrate an oligoclonal CD8+/CD137+ T cell response against two shared neoantigens, 9 and 17, defined by epitope-specific CDR3 motifs. These results demonstrate that this ovarian cancer patient already possessed the necessary T cells repertoire to mediate antitumor immunity in-vitro and in-vivo. Consequently, a potential clinical intervention for this patient could focus on exploiting neoantigen-specific ACT in combination with PD1/PDL-1 or CTLA4 blockade to maximize the anti-tumor response and establish a strong and long-lasting tumor control. Currently, immunotherapy in OC is very preliminary and a number FDA approved targeted therapies are used in the clinic, including Olaparib and Bevacizumab to inhibit PARPCitation38–Citation40 and VEGF, Citation41–Citation43 respectively. Although there is an initial objective clinical response in patients who received targeted therapy, these approaches are not fully curative and patients develop resistanceCitation44,Citation45 or trade off a reduced quality of life.Citation43 Here we report a personalized immunotherapeutic approach to ovarian cancer that exploits the patient’s own mutanome to mediate antitumor immunity, suggesting that neoantigen-based immunotherapy can be a viable clinical intervention for patients who fail to respond to conventional chemotherapy and targeted therapy.
Overall, this is a proof of concept study highlighting the opportunity of exploiting the pre-existing T cell repertoire in ovarian cancer patients to target the tumor’s genomic alterations and maximize the potentials of a positive clinical outcome.
Material and methods
Mice and establishment of patient derived xenograft (PDX)
NOD Scid gamma (NSG) mice, which lack of B cells, T cells, NK cells and complement, were obtained from an in-house bred of Jackson Lab strain (NOD.Cg-Prkdcscid Il2rgtm1Wjl/SzJ). Patient derived xenograft (PDX) tumors were established by grafting subcutaneously (SQ) tumor cells obtained from a primary tumor of one ovarian cancer patient at Roswell Park Comprehensive Cancer Center. For all passages, tumor cells (3 x 10⁶/mouse) were grafted SQ in in 20% matrigel (Corning, #354234) and monitored weekly. The first passage in the mouse is defined as P0 and other passages are counted incrementally. Tumors were digested using tumor dissociation kit (Miltenyi Biotech, 130–096–730) as per manufacturing instructions and red blood cells were lysed by incubation with 0.8% Ammonium chloride solution (STEMCELL technologies, 07800) for 10 min on ice. Cells were further washed twice with 1XPBS before being engrafted SQ in P2 mice using 20% matrigel. The presence of the immunogenic mutations was tested via WES.
Whole exome sequencing and variant calls
DNA was isolated using the Gentra Puregene Tissue kit (Qiagen, 158667). DNA libraries for whole exome sequencing (WES) were prepared with the Illumina True Seq library kit (Illumina) and sequencing runs completed on the Illumina HiSeq 2500 platform at the Roswell Park Cancer Institute (RPCI) Genomic Shared Resources (GSR). Post QC, raw reads were mapped to the hg38 human reference genome utilizing the Burrows-Wheeler Aligner (BWA)Citation46 with the following parameters: bwa mem -t 12 -M hg38.fa WES_R1.fastq.gz WES_R2.fastq.gz > BWA.sam. Since both murine and human sequences were detected, we identified ambiguous reads by aligning reads to the murine mm10 genome and then removed from the analyses reads that had unique high-quality matches and zero mismatches to mm10 and not to hg38. To overcome problems caused by artifacts from library preparation and sequencing, results were filtered with the Picard tool (Broad Institute) to create read groups and mark and remove mapped duplicate reads. Output files from both RNASeq and WES were analyzed using three different algorithms for variant calls: MuTect, Citation47 BambinoCitation48 and Strelka .Citation49 The code used for those tools are reported in the supplementary_coding.txt file. SNVs identified from two or more callers were sued for further analyses. SNVs were annotated with SnpEff Citation50 and nonsynonymous SNVs that cause a deleterious amino acid change in the final protein product were retained. Per each variant detected we then calculated the variant allele frequency (VAF), intended as the frequency of reads that detected variant nucleotides within the total number of reads. This metric is used to identify clusters of mutations using Pearson’s.Citation51,Citation52,Citation53
RNA sequencing
Whole transcriptome sequencing was run on the primary, P0 and P1 passages. RNA libraries (TruSeq RNA Library Prep kit, Illumina) were prepared and ran on the Illumina HiSeq 2500 by the RPCI GSR. Post QC, samples were aligned to the human reference genome and transcripts per million (TPM) reads were obtained with Kallisto .Citation54 Gene level counts were obtained using the tximport packageCitation55 in R .Citation56
Immunogenicity prediction
HLA type was predicted from NGS data using HLAminer .Citation57 The 25- mer sequences were queried to identify immunogenic 8–11mers using NetMHC v4.0 .Citation58 Top ranking mutated peptides with affinity from NetMHC < 500 nM and higher immunogenicity than the WT sequence were further filtered based on expression levels from RNASeq (TPM > 1). Lastly, results were blasted to exclude cross reactivity with germline peptides. Mutated peptides that do not have significant overlap with germline sequences (Evalue > 0.05, identity < 100%) were used for in-vitro testing. Neoantigen validation in-vitro: The ability of T cells to recognize neoepitopes was evaluated by coculturing peptide pulsed autologous antigen presenting cells (APCs) and T cells and by subsequent analysis of IFNγ production via ELISA. Peptides corresponding to the predicted immunogenic neoantigens were purchased from Peptide2.0 and reconstituted following the manufacturer’s instructions. CD8 + T cells were isolated from PBMCs using magnetic beads (Invitrogen, 11333D) and CD8 negative fraction of autologous PBMCs were used as APCs and plated at the concentration of 5 × 10⁴ cells/well in a 96 well/plate, pulsed with WT or mutated peptides at a concentration of 10 uM in X-vivo media (Lonza, 04–418Q) overnight (12–14 h) at 37oC. Target cells were washed and resuspended in RPMI 1640 (Gibco,11875–093) supplemented with 5% human serum (Gemini Bio-products, 100–512), IL-2 (Roche, 11147528001) (10 U/ml) and IL-7 (R and D systems, 207-IL) (5 ng/ml) and immediately cocultured with CD8 + T cells at a ratio of 1:5. After 48 h, culture supernatant was collected at regular intervals and IFN-g measured by ELISA by the Immune Analyses Facility at Roswell Park Cancer Institute. At the end of 19th day of coculture, CD8+ T cells were re-stimulated with mutated of WT peptide and after 24 hours, expression of T cell activation marker, 4–1BB/CD137 (eBioscience, 12–1379–42) was assessed by flow cytometry at the Flow and Image Cytometry Core facility at Roswell Park. Briefly, cells were pelleted, washed and resuspended in appropriate antibodies (CD8a:Biolegend, 301032, Biolegend, 317306, CD4/OKT4: Biolegend, 317416) for 20 min in the dark at 4oC. Cells were washed with FACS buffer (1X PBS (pH 7.4) with 2% FBS) and resuspended in FACS buffer before acquiring on BD LSRIIA flow cytometer. Flow cytometry data was analyzed using the FlowJo software. Mutated peptides with a ratio IFNγ-mutated/IFNγ-WT > 1 and higher CD8+/CD137+ population than the WT peptide were deemed immunogenic.
Adoptive T cell transfer (ACT) in-vivo
ACT was performed when tumors reached approximately 50 mm3 by injecting intravenously (IV) T cells stimulated in-vitro with 10 µM of the mutated or WT peptides. Briefly, PBMCs from the patient were washed and incubated with a cocktail of immunogenic mutated peptides at 10 µM/sample overnight (12–14 h) at 37oC, 5% CO2 and expanded using OKT3 (50 ng/ml) (CD3/OKT3: eBioscience, 16–0037–85) for 48 hours. After expansion, cells were washed and resuspended in AIM V (Gibco, 0870112DK) supplemented with 5% human serum (Gemini Bio- products, 100–512) and IL-2 (Roche, 11147528001) (100 U/ml) for 12 days. Before ACT, cells pulsed mutated peptide were restimulated overnight (12–14 h). Cells were then washed and 5 × 10⁶ cells/mouse were injected intravenously. Mice were divided in two treatment groups: 1) ACT with PBMCs stimulated with the MUT peptides, 2) ACT with peptide-naïve PBMCs. Tumors were monitored weekly via caliper measurements and volume was calculated using the following formula: [(dim(short))2]*[(dim(long))2]*0.5324. Statistical difference in tumor size between the groups was calculated using ANOVA with post-hoc correction and a significance threshold of 0.05.
Generation of PDX tumor lysate
Tumor lysate from PDX mice was prepared with 5 cycles of freeze-taw. The protein concentration in the supernatant was determined using pierce BCA protein assay kit (ThermoScientific, 23225) and 60 µg of lysate was used to stimulate the patient’s APCs in X-Vivo media for overnight 12–14 hours and next day cocultured with patient CD8 + T cells, or HLA-A2+ healthy donors T cells, for seven days. T cells were restimulated 24 hours before subjected to analysis of T cell activation markers, CD137 and IFN-, by flow cytometry.
Flow cytometry analysis
After ACT, T cells were analyzed in the circulation after 2 and 4 weeks post ACT whereas infiltration of T cells to the tumor site was examined at end point. Briefly 200 µl of blood was collected in EDTA collection tubes from retro-orbital sinus of each mouse and RBCs were lysed using 0.8% ammonium chloride solution. Cells were washed twice and incubated with appropriate antibodies before being acquired by flow cytometry for analysis of T cells in the circulation of PDX model. For T cell analysis at the tumor site, tumor samples were digested using tumor dissociation kit and RBCs were lysed if required. The cells were incubated with appropriate antibodies for analysis by flow cytometry.
TCR sequencing
TCR Sequencing was done by the SUNY University of Buffalo Genomics core utilizing the 10X Genomics platform. Briefly: Raw data were analyzed with the CellRanger Software (10X Genomics) to produce high-confidence, cellular contigs. Contigs with ‘NA’ in the CDR3 column and/or ‘FALSE’ in the ‘productive’ column were removed. The latter is a binary value predicting whether the transcript translates to a protein with a CDR3 region. Four TCRβ clonotypes were identical between the two experiments and were removed from both datasets due to potential contamination error. Frequency of all TCRβ clonotypes was counted adjusting for duplicate cell barcodes with the same clonotypes, so as to not double-count clonotypes. Clonotypes were then separated into ‘high’ frequency if their cell count was n ≥ 3 and ‘low’ frequency if their cell count was n = 1. For experiment 9, the number of sequences in the high set was 13, and in the low set 43. For experiment 17 the number of sequences in the high set was 5, and in the low set 26. Since CDR3 sequences contain variable insertions and deletions, we used the gapped motif discovery GLAM2 (Gapped Local Alignment of Motifs)Citation59 to identify motifs in the high and low clonotype sets for each experiment, respectively. GLAM2 was run on the MEME Suite webserver (v.5.0.1)Citation60 with default settings. The highest-scoring motifs were selected for each experiment and high/low set of CDR3 sequences. The small number (n = 5) of sequences in the low 9 experiment resulted in a low top score for the GLAM2 alignment. To ensure that this score was significant, we ran 100 trials of GLAM2 using randomly permuted low 9 sequences. We estimated the probability density function (PDF) of the resulting distribution of scores using kernel density estimation. For the kernel density estimation, the R function stats::density was used with bandwidth set to ‘bw.SJ’, the Sheather-Jones bandwidth estimatorCitation61 and remaining default parameters. The estimated PDF of the permuted set of low 9 sequences is overlayed over a density histogram of the GLAM2 scores from the randomized sequences in Figure S5. Note that the distribution density falls to 0 before the GLAM2 score reaches 30, indicating that the estimated GLAM2 score of the low 9 experiment (34.70) does not come from the distribution estimated to represent the random scores. Motifs for the high and low clonotypes were aligned and compared in each experiment using DiffLogo .Citation62 For the alignment, the first and last four amino acids were held fixed, since they represent the highest scoring locations for significant motifs using an ungapped analysis as follows. In order to ascertain subregions of the sequences that were most conserved between each other, we used the MEME (Multiple EM for Motif Elicitation) algorithmCitation63 on each of the high and low clonotype sequences in experiments 19 and 9, respectively. The MEME Suite webserver (v.5.0.1) was used to run the MEME algorithm with parameters ‘Site Distribution’ set to ‘Any number of repetitions’, a minimum motif width of 4, and the remainder of the parameters set to default. The results for the top two MEME motifs for each set of sequences is shown in Figures. The low sets for each experiment show a top motif with the last four amino acids of the sequences providing the highest information content, and a second motif with the first four amino acids providing the highest information content. The high sets only have one significant motif (the top motif for experiment 19), but they show the same amino acid locations (first and last four) as being maximally conserved between the sequences. We thus chose to hold those constants during our alignment of the high and low motifs that were generated by the GLAM2 algorithm. Results for DiffLogo are shown only in the amino acid locations For the alignment, the first and last four amino acids were held fixed, since they represent the highest scoring locations for significant motifs using an ungapped analysis that are aligned.
Abbreviations
| ACT | = | Adoptive T-Cell Transfer |
| HLA | = | Human Leukocyte Antigen |
| IFNγ | = | Interferon gamma |
| MUT | = | Mutated peptide |
| PBMCs | = | Peripheral Blood Mononuclear Cells |
| PDX | = | Patient Derived Xenograft |
| SNV | = | Single Nucleotide Variant |
| WES | = | Whole Exome Sequencing |
| WT | = | Wild Type |
Authors contributions
SB, KO and RK conceived the study. SB, AK and VJ performed the bioinformatics analyses. RYH
established the first PDX model. MYW and SM prepared the following PDXs. MYW performed the in- vitro and in-vivo experiments and the immunogenicity predictions. MYW and TT performed the immunophenotyping experiments. SB, MYW, KO and RK defined the experimental approaches and analyses. All authors reviewed the results, wrote and approved the final version of the paper.
Disclosure of potential conflicts of interest
The authors have no competing interests to disclose.
Consent for publication
Consent for publication is included in the approved clinical protocol
Data availability
All raw and processed data are available upon publication
Ethics approval and consent to participate
Patient samples were collected under a clinical protocol approved by the Institutional Review Board (I215512) at Roswell Park Comprehensive Cancer Center in Buffalo NY.
Supplemental Material
Download PDF (5.1 MB)Acknowledgments
The authors want to thank Anthony Miliotto for curating the RP Ovarian biobank where the samples came from, the RP genomic shared resources (GSR) and Biostatistics and Bioinformatics core the for the support in the NGS analyses.
Supplementary Material
Supplemental data for this article can be accessed on the publisher’s website.
Additional information
Funding
Related Research Data
References
- Siegel RL, Miller KD, Jemal A. Cancer statistics, 2015. CA Cancer J Clin. 2015;65(1):5–29. doi:10.3322/caac.21254.
- Naora H, Montell DJ. Ovarian cancer metastasis: integrating insights from disparate model organisms. Nat Rev Cancer. 2005;5(5):355–366. doi:10.1038/nrc1611.
- Hoogstraat M, de Pagter MS, Cirkel GA, van Roosmalen MJ, Harkins TT, Duran K, Kreeftmeijer J, Renkens I, Witteveen PO, Lee CC, et al. Genomic and transcriptomic plasticity in treatment-naive ovarian cancer. Genome Res. 2014;24(2):200–211. doi:10.1101/gr.161026.113.
- Kipps E, Tan DS, Kaye SB. Meeting the challenge of ascites in ovarian cancer: new avenues for therapy and research. Nat Rev Cancer. 2013;13(4):273–282. doi:10.1038/nrc3432.
- Gros A, Parkhurst MR, Tran E, Pasetto A, Robbins PF, Ilyas S, Prickett TD, Gartner JJ, Crystal JS, Roberts IM, et al. Prospective identification of neoantigen-specific lymphocytes in the peripheral blood of melanoma patients. Nat Med. 2016;22(4):433–438. doi:10.1038/nm.4051.
- Carreno BM, Magrini V, Becker-Hapak M, Kaabinejadian S, Hundal J, Petti AA, Ly A, Lie W-R, Hildebrand WH, Mardis ER, et al. Cancer immunotherapy. A dendritic cell vaccine increases the breadth and diversity of melanoma neoantigen-specific T cells. Science. 2015;348(6236):803–808. doi:10.1126/science.aaa3828.
- McGranahan N, Furness AJ, Rosenthal R, Ramskov S, Lyngaa R, Saini SK, Jamal-Hanjani M, Wilson GA, Birkbak NJ, Hiley CT, et al. Clonal neoantigens elicit T cell immunoreactivity and sensitivity to immune checkpoint blockade. Science. 2016;351(6280):1463–1469. doi:10.1126/science.aaf1490.
- Rizvi NA, Hellmann MD, Snyder A, Kvistborg P, Makarov V, Havel JJ, Lee W, Yuan J, Wong P, Ho TS, et al. Cancer immunology. Mutational landscape determines sensitivity to PD-1 blockade in non-small cell lung cancer. Science. 2015;348(6230):124–128. doi:10.1126/science.aaa1348.
- Baek S, Kim YM, Kim SB, Kim CS, Kwon SW, Kim Y, Kim HS, Lee H. Therapeutic DC vaccination with IL-2 as a consolidation therapy for ovarian cancer patients: a phase I/II trial. Cell Mol Immunol. 2015;12(1):87–95. doi:10.1038/cmi.2014.40.
- Buzzonetti A, Fossati M, Catzola V, Scambia G, Fattorossi A, Battaglia A. Immunological response induced by abagovomab as a maintenance therapy in patients with epithelial ovarian cancer: relationship with survival-a substudy of the MIMOSA trial. Cancer Immunol Immunother. 2014;63(10):1037–1045. doi:10.1007/s00262-014-1569-0.
- Odunsi K, Matsuzaki J, James SR, Mhawech-Fauceglia P, Tsuji T, Miller A, Zhang W, Akers SN, Griffiths EA, Miliotto A, et al. Epigenetic potentiation of NY-ESO-1 vaccine therapy in human ovarian cancer. Cancer Immunol Res. 2014;2(1):37–49. doi:10.1158/2326-6066.CIR-13-0126.
- Kandalaft LE, Chiang CL, Tanyi J, Motz G, Balint K, Mick R, Coukos G. A phase I vaccine trial using dendritic cells pulsed with autologous oxidized lysate for recurrent ovarian cancer. J Transl Med. 2013;11:149. doi:10.1186/1479-5876-11-149.
- Suzuki S, Shibata K, Kikkawa F, Nakatsura T. Significant clinical response of progressive recurrent ovarian clear cell carcinoma to glypican-3-derived peptide vaccine therapy: two case reports. Hum Vaccin Immunother. 2014;10(2):338–343. doi:10.4161/hv.27217.
- Martin SD, Brown SD, Wick DA, Nielsen JS, Kroeger DR, Twumasi-Boateng K, Holt RA, Nelson BH, Ashkar AA. Low mutation burden in ovarian cancer may limit the utility of neoantigen-targeted vaccines. PLoS One. 2016;11(5):e0155189. doi:10.1371/journal.pone.0155189.
- Bobisse S, Genolet R, Roberti A, Tanyi JL, Racle J, Stevenson BJ, Iseli C, Michel A, Le Bitoux M-A, Guillaume P, et al. Sensitive and frequent identification of high avidity neo-epitope specific CD8+ T cells in immunotherapy-naive ovarian cancer. Nat Commun. 2018;9(1):1092. doi:10.1038/s41467-018-03301-0.
- Goode EL, Block MS, Kalli KR, Vierkant RA, Chen W, Fogarty ZC, Gentry-Maharaj A, Toloczko A, Hein A, Bouligny AL, et al., Ovarian Tumor Tissue Analysis C. Dose-response association of CD8+ tumor-infiltrating lymphocytes and survival time in high- grade serous ovarian cancer. JAMA Oncol. 2017;3(12):e173290. doi:10.1001/jamaoncol.2017.3290.
- Wang Q, Lou W, Di W, Wu X. Prognostic value of tumor PD-L1 expression combined with CD8(+) tumor infiltrating lymphocytes in high grade serous ovarian cancer. Int Immunopharmacol. 2017;52:7–14. doi:10.1016/j.intimp.2017.08.017.
- Li J, Wang J, Chen R, Bai Y, Lu X. The prognostic value of tumor-infiltrating T lymphocytes in ovarian cancer. Oncotarget. 2017;8(9):15621–15631. doi:10.18632/oncotarget.14919.
- Lai Y, Wei X, Lin S, Qin L, Cheng L, Li P. Current status and perspectives of patient-derived xenograft models in cancer research. J Hematol Oncol. 2017;10(1):106. doi:10.1186/s13045-017-0470-7.
- Choi Y, Lee S, Kim K, Kim SH, Chung YJ, Lee C. Studying cancer immunotherapy using patient-derived xenografts (PDXs) in humanized mice. Exp Mol Med. 2018;50(8):99. doi:10.1038/s12276-018-0115-0.
- Jespersen H, Lindberg MF, Donia M, Soderberg EMV, Andersen R, Keller U, Ny L, Svane IM, Nilsson LM, Nilsson JA. Clinical responses to adoptive T-cell transfer can be modeled in an autologous immune-humanized mouse model. Nat Commun. 2017;8(1):707. doi:10.1038/s41467-017-00786-z.
- Voloshin T, Gingis-Velitski S, Bril R, Benayoun L, Munster M, Milsom C, Man S, Kerbel RS, Shaked Y. G-CSF supplementation with chemotherapy can promote revascularization and subsequent tumor regrowth: prevention by a CXCR4 antagonist. Blood. 2011;118(12):3426–3435. doi:10.1182/blood-2010-11-320812.
- Hao C, Wang L, Peng S, Cao M, Li H, Hu J, Huang X, Liu W, Zhang H, Wu S, et al. Gene mutations in primary tumors and corresponding patient-derived xenografts derived from non-small cell lung cancer. Cancer Lett. 2015;357(1):179–185. doi:10.1016/j.canlet.2014.11.024.
- Garman B, Anastopoulos IN, Krepler C, Brafford P, Sproesser K, Jiang Y, Wubbenhorst B, Amaravadi R, Bennett J, Beqiri M, et al. Genetic and genomic characterization of 462 melanoma patient-derived xenografts, tumor biopsies, and cell lines. Cell Rep. 2017;21(7):1936–1952. doi:10.1016/j.celrep.2017.10.052.
- Xie T, Musteanu M, Lopez-Casas PP, Shields DJ, Olson P, Rejto PA, Hidalgo M, Rooman I. Whole exome sequencing of rapid autopsy tumors and xenograft models reveals possible driver mutations underlying tumor progression. PLoS One. 2015;10(11):e0142631. doi:10.1371/journal.pone.0142631.
- Choi YY, Lee JE, Kim H, Sim MH, Kim KK, Lee G, Kim H-I, An JY, Hyung WJ, Kim C-B, et al. Establishment and characterisation of patient-derived xenografts as paraclinical models for gastric cancer. Sci Rep. 2016;6:22172. doi:10.1038/srep22172.
- Litjens NH, de Wit EA, Baan CC, Betjes MG. Activation-induced CD137 is a fast assay for identification and multi-parameter flow cytometric analysis of alloreactive T cells. Clin Exp Immunol. 2013;174(1):179–191. doi:10.1111/cei.12152.
- Wolfl M, Kuball J, Eyrich M, Schlegel PG, Greenberg PD. Use of CD137 to study the full repertoire of CD8+ T cells without the need to know epitope specificities. Cytometry A. 2008;73(11):1043–1049. doi:10.1002/cyto.a.20594.
- Zhu Y, Chen L. CD137 as a biomarker for tumor-reactive T cells: finding gold in the desert. Clin Cancer Res. 2014;20(1):3–5. doi:10.1158/1078-0432.CCR-13-2573.
- Yan ZH, Zheng XF, Yi L, Wang J, Wang XJ, Wei PJ, Jia H-Y, Zhou L-J, Zhao Y-L, Zhang H-T. CD137 is a useful marker for identifying CD4(+) T cell responses to mycobacterium tuberculosis. Scand J Immunol. 2017;85(5):372–380. doi:10.1111/sji.12541.
- Liu JF, Palakurthi S, Zeng Q, Zhou S, Ivanova E, Huang W, Zervantonakis IK, Selfors LM, Shen Y, Pritchard CC, et al. Establishment of patient- derived tumor xenograft models of epithelial ovarian cancer for preclinical evaluation of novel therapeutics. Clin Cancer Res. 2017;23(5):1263–1273. doi:10.1158/1078-0432.CCR-16-1237.
- Pasetto A, Gros A, Robbins PF, Deniger DC, Prickett TD, Matus-Nicodemos R, Douek DC, Howie B, Robins H, Parkhurst MR, et al. Tumor- and neoantigen-reactive T-cell receptors can be identified based on their frequency in fresh tumor. Cancer Immunol Res. 2016;4:734–743. doi:10.1158/2326-6066.CIR-16-0001.
- Alexandrov LB, Nik-Zainal S, Wedge DC, Aparicio SA, Behjati S, Biankin AV, Bignell GR, Bolli N, Borg A, Børresen-Dale A-L, et al. Signatures of mutational processes in human cancer. Nature. 2013;500(7463):415–421. doi:10.1038/nature12477.
- Boesteanu A, Brehm M, Mylin LM, Christianson GJ, Tevethia SS, Roopenian DC, Joyce S. A molecular basis for how a single TCR interfaces multiple ligands. J Immunol. 1998;161:4719–4727.
- Simon P, Omokoko TA, Breitkreuz A, Hebich L, Kreiter S, Attig S, Konur A, Britten CM, Paret C, Dhaene K, et al. Functional TCR retrieval from single antigen-specific human T cells reveals multiple novel epitopes. Cancer Immunol Res. 2014;2(12):1230–1244. doi:10.1158/2326-6066.CIR-14-0108.
- Wooldridge L, Ekeruche-Makinde J, van den Berg HA, Skowera A, Miles JJ, Tan MP, Dolton G, Clement M, Llewellyn-Lacey S, Price DA, et al. A single autoimmune T cell receptor recognizes more than a million different peptides. J Biol Chem. 2012;287(2):1168–1177. doi:10.1074/jbc.M111.289488.
- Gee MH, Han A, Lofgren SM, Beausang JF, Mendoza JL, Birnbaum ME, Bethune MT, Fischer S, Yang X, Gomez-Eerland R, et al. Antigen identification for orphan T cell receptors expressed on tumor-infiltrating lymphocytes. Cell. 2018;172(3):549–63 e16. doi:10.1016/j.cell.2017.11.043.
- Martinek I, Haldar K, Gaitskell K, Bryant A, Nicum S, Kehoe S, Morrison J. DNA-repair pathway inhibitors for the treatment of ovarian cancer. Cochrane Database Syst Rev. 2010 Jun 16;(6):CD007929.
- Meng XW, Koh BD, Zhang JS, Flatten KS, Schneider PA, Billadeau DD, Hess AD, Smith BD, Karp JE, Kaufmann SH. Poly(ADP-ribose) polymerase inhibitors sensitize cancer cells to death receptor-mediated apoptosis by enhancing death receptor expression. J Biol Chem. 2014;289(30):20543–20558. doi:10.1074/jbc.M114.549220.
- Scott CL, Swisher EM, Kaufmann SH. Poly (ADP-ribose) polymerase inhibitors: recent advances and future development. J Clin Oncol. 2015;33(12):1397–1406. doi:10.1200/JCO.2014.58.8848.
- Stockler MR, Hilpert F, Friedlander M, King MT, Wenzel L, Lee CK, Joly F, de Gregorio N, Arranz JA, Mirza MR, et al. Patient-reported outcome results from the open-label phase III AURELIA trial evaluating bevacizumab-containing therapy for platinum-resistant ovarian cancer. J Clin Oncol. 2014;32(13):1309–1316. doi:10.1200/JCO.2013.51.4240.
- Bowtell DD, Bohm S, Ahmed AA, Aspuria PJ, Bast RC Jr., Beral V, Berek JS, Birrer MJ, Blagden S, Bookman MA, et al. Rethinking ovarian cancer II: reducing mortality from high-grade serous ovarian cancer. Nat Rev Cancer. 2015;15(11):668–679. doi:10.1038/nrc4019.
- Stark D, Nankivell M, Pujade-Lauraine E, Kristensen G, Elit L, Stockler M, Hilpert F, Cervantes A, Brown J, Lanceley A, et al. Standard chemotherapy with or without bevacizumab in advanced ovarian cancer: quality-of-life outcomes from the International Collaboration on Ovarian Neoplasms (ICON7) phase 3 randomised trial. Lancet Oncol. 2013;14(3):236–243. doi:10.1016/S1470-2045(12)70567-3.
- Bixel K, Hays JL. Olaparib in the management of ovarian cancer. Pharmgenomics Pers Med. 2015;8:127–135. doi:10.2147/PGPM.S62809.
- Garcia A, Singh H. Bevacizumab and ovarian cancer. Ther Adv Med Oncol. 2013;5(2):133–141. doi:10.1177/1758834012467661.
- Li H, Durbin R. Fast and accurate short read alignment with Burrows-Wheeler transform. Bioinformatics. 2009;25(14):1754–1760. doi:10.1093/bioinformatics/btp324.
- Cibulskis K, Lawrence MS, Carter SL, Sivachenko A, Jaffe D, Sougnez C, Gabriel S, Meyerson M, Lander ES, Getz G. Sensitive detection of somatic point mutations in impure and heterogeneous cancer samples. Nat Biotechnol. 2013;31(3):213–219. doi:10.1038/nbt.2514.
- Edmonson MN, Zhang J, Yan C, Finney RP, Meerzaman DM, Buetow KH. Bambino: a variant detector and alignment viewer for next-generation sequencing data in the SAM/BAM format. Bioinformatics. 2011;27(6):865–866. doi:10.1093/bioinformatics/btr032.
- Saunders CT, Wong WS, Swamy S, Becq J, Murray LJ, Cheetham RK. Strelka: accurate somatic small-variant calling from sequenced tumor-normal sample pairs. Bioinformatics. 2012;28(14):1811–1817. doi:10.1093/bioinformatics/bts271.
- Cingolani P, Platts A, Wang le L, Coon M, Nguyen T, Wang L, Land SJ, Lu X, Ruden DM. A program for annotating and predicting the effects of single nucleotide polymorphisms, SnpEff: sNPs in the genome of Drosophila melanogaster strain w1118; iso-2; iso-3. Fly (Austin). 2012;6(2):80–92. doi:10.4161/fly.19695.
- Koboldt DC, Zhang Q, Larson DE, Shen D, McLellan MD, Lin L, Miller CA, Mardis ER, Ding L, Wilson RK. VarScan 2: somatic mutation and copy number alteration discovery in cancer by exome sequencing. Genome Res. 2012;22(3):568–576. doi:10.1101/gr.129684.111.
- Seshan VE, Olshen A. DNAcopy: DNA copy number data analysis. R package version 1.56.0. 2018.
- Miller CA, White BS, Dees ND, Griffith M, Welch JS, Griffith OL, Vij R, Tomasson MH, Graubert TA, Walter MJ, et al. SciClone: inferring clonal architecture and tracking the spatial and temporal patterns of tumor evolution. PLoS Comput Biol. 2014;10(8):e1003665. doi:10.1371/journal.pcbi.1003665.
- Bray NL, Pimentel H, Melsted P, Pachter L. Near-optimal probabilistic RNA-seq quantification. Nat Biotechnol. 2016;34(5):525–527. doi:10.1038/nbt.3519.
- Soneson C, Love MI, Robinson MD, Shah U, Olech E, Lomeo R, Singh V, Busch H, Strandberg MJ, Strandberg K, et al. Differential analyses for RNA-seq: transcript-level estimates improve gene-level inferences. F1000Res. 2015;4:1521. doi:10.12688/f1000research.7192.2.
- Team RDC. R: A language and environment for statistical computing. 2008.
- Warren RL, Choe G, Freeman DJ, Castellarin M, Munro S, Moore R, Holt RA. Derivation of HLA types from shotgun sequence datasets. Genome Med. 2012;4(12):95. doi:10.1186/gm396.
- Andreatta M, Nielsen M. Gapped sequence alignment using artificial neural networks: application to the MHC class I system. Bioinformatics. 2016 Feb 15;32(4):511–517.
- Frith MC, Saunders NF, Kobe B, Bailey TL. Discovering sequence motifs with arbitrary insertions and deletions. PLoS Comput Biol. 2008;4(4):e1000071. doi:10.1371/journal.pcbi.1000071.
- Bailey TL, Williams N, Misleh C, Li WW. MEME: discovering and analyzing DNA and protein sequence motifs. Nucleic Acids Res. 2006;34(WebServer issue):W369–73. doi:10.1093/nar/gkl198.
- Sheather SJ, Jones MC. A reliable data-based bandwidth selection method for kernel density estimation. J R Stat Soc Series B (Statistical Methodology). 1991;53:683–690.
- Nettling M, Treutler H, Grau J, Keilwagen J, Posch S, Grosse I. DiffLogo: a comparative visualization of sequence motifs. BMC Bioinformatics. 2015;16:387. doi:10.1186/s12859-015-0462-y.
- Bailey TL, Elkan C. Fitting a mixture model by expectation maximization to discover motifs in biopolymers. Proc Int Conf Intell Syst Mol Biol. 1994;2:28–36.