
ABSTRACT
Successful immunotherapy for melanoma depends on the recruitment of effector CD8+ T cells to the tumor microenvironment. Factors contributing to T cell regulation in melanoma have recently been recognized, including the stimulator of interferon genes (STING). Agents that can activate STING or enhance T cell infiltration into established tumors have become an important focus for further clinical development. Talimogene laherparepvec (T-VEC) is an oncolytic herpes simplex virus, type 1 (HSV-1) encoding granulocyte-macrophage colony stimulating factor (GM-CSF) and is approved for the treatment of melanoma and has shown therapeutic activity in murine tumors known to express high levels of STING. The mechanism of action for T-VEC has not been fully elucidated but is thought to include induction of immunogenic cell death (ICD) and activation of host anti-tumor immunity. Thus, we sought to investigate how T-VEC mediates anti-tumor activity in a melanoma model. To determine if T-VEC induced ICD we established the relative sensitivity of a panel of melanoma cell lines to T-VEC oncolysis. Following T-VEC infection in vitro, melanoma cell lines released of HMGB1, ATP, and translocated ecto-calreticulin. To identify potential mediators of this effect, we found that melanoma cell sensitivity to T-VEC was inversely related to STING expression. CRISPR/Cas9-STING knockout was also associated with increased T-VEC cell killing. In the D4M3A melanoma, which has low expression of STING and is resistant to PD-1 blockade therapy, T-VEC was able to induce therapeutic responses in both injected and non-injected tumors and demonstrated recruitment of viral- and tumor-antigen specific CD8+ T cells, and induction of a pro-inflammatory gene signature at both injected and non-injected tumors. These data suggest that T-VEC induces ICD in-vitro and promotes tumor immunity and can induce therapeutic responses in anti-PD-1-refractory, low STING expressing melanoma.
Introduction
Tumor immunotherapy has changed the therapeutic landscape for an increasing number of patients with cancer.Citation1 Yet, many patients do not respond to treatment and the mechanisms of innate and acquired drug resistance are incompletely understood.Citation2 Solid tumors are generally characterized by the presence or absence of tumor-infiltrating lymphocytes.Citation3 Indeed, studies in metastatic melanoma patients treated with programmed cell death 1 (PD-1) inhibitors revealed an association between T-cell infiltration and clinical response to immune checkpoint blockade.Citation4 The homeostatic mechanisms regulating the development of this so-called T cell-inflamed tumor microenvironment are being elucidated and appear to depend on patterns of intracellular signaling within tumor cells as well as innate features of the host immune system. The presence of high tumor cell mutation burden, enriched neoantigen T cell repertoire, availability of tissue resident basic leucine zipper ATF-like transcription factor 3 (Batf3)+ dendritic cells (DCs) and expression of an interferon-related pro-inflammatory gene expression profile have correlated with improved therapeutic responses to immunotherapy.Citation5–Citation9
Recently, the cyclic guanosine monophosphate (GMP)–adenosine monophosphate (AMP) synthase (cGAS) and stimulatory of interferon genes (STING) complex has been implicated as a key intracellular regulator of host T cell recruitment to the tumor microenvironment in melanoma.Citation10 cGAS is a DNA sensor that responds to genotoxic cell stress by binding to abnormal DNA in neoplastic cells and activating STING, which serves as an adaptor protein that triggers innate immunity through type I interferon gene expression, release of chemokines CXCL9 and CXCL10, and ultimately recruitment of T cells.Citation10,Citation11 While cGAS-STING signaling explains the presence of tumor-infiltrating T cells, this pathway also enhances expression of several counter-regulatory immune parameters, including expression of PD-1 ligand 1 (PD-L1), accumulation of CD4+FoxP3+ regulatory T cells, and production of indoleamine 2,3-dioxygenase (IDO), all factors that inhibit host anti-tumor immunity.Citation6,Citation12 Thus, effective immunotherapy requires both T cell recruitment to the tumor microenvironment and suppression of the homeostatic counter-regulatory pathways. This explains why the presence of T cells, per se, is insufficient to mediate tumor regression in the absence of immune checkpoint inhibition. In addition, re-establishing cGAS-STING activation in tumors with deficient type 1 interferon responses has been suggested as an important strategy for converting lymphoid-deficient tumors (i.e., “cold” tumors) into T cell-inflamed tumors (i.e., “hot” tumors).Citation13,Citation14
Oncolytic viruses are viral vectors that preferentially replicate in tumor cells, inducing immunogenic cell death (ICD) and promoting host anti-tumor immune responses.Citation13 The preferential replication in tumor cells is based on several features, including deficiencies in tumor cell anti-viral machinery elements and defective type 1 interferon signaling as compared to normal, non-neoplastic cells.Citation15 Additionally, oncolytic viruses are thought to enhance ICD through release of danger-associated molecular pattern (DAMP) factors and soluble tumor-associated antigens that cooperate to induce innate and adaptive immune responses, although this has not been confirmed for most oncolytic viruses.Citation13 The ability of oncolytic viruses to recruit T cells to the tumor microenvironment and promote ICD with release of tumor-associated antigens suggests that oncolytic immunotherapy is especially well suited for converting T-cell-deficient tumors into T cell-inflamed tumor microenvironments, which should further enhance systemic immunotherapy.Citation16
The first oncolytic virus approved in the U.S. for the treatment of cancer is talimogene laherparepvec (T-VEC), an attenuated herpes simplex virus, type 1 (HSV-1) encoding granulocyte-macrophage colony stimulating factor (GM-CSF), which was approved based on an improvement in durable and objective response rates in patients with advanced melanoma.Citation17 Treatment with T-VEC has also been associated with infiltration by melanoma-specific CD8+ T cells.Citation18 Furthermore, HSV-1 is known to trigger cGAS-STING and initiate strong type 1 interferon production.Citation19 In addition, Batf3+ DC is known to be especially competent at presentation of HSV-1-related antigens.Citation20 Thus, oncolytic viruses, such as T-VEC, might provide a more natural way to utilize innate elements of the anti-viral response to kill tumor cells in a more immunogenic manner while promoting systemic anti-tumor immunity. A better understanding of how oncolytic viruses induce ICD might also suggest new targets for combination therapy in melanoma and potentially other tumors permissive to oncolytic virus infection.Citation21
Thus, in this report, we sought to explore the molecular factors involved with T-VEC-mediated ICD in melanoma cells and determine which intracellular factors are important for promoting viral replication and promoting anti-tumor immunity. We hypothesized that T-VEC would induce ICD through release of defined DAMPs and would promote T cell recruitment to established melanomas through type 1 interferon-related factors, including CXCL9 and CXCL10, as well as a pro-inflammatory gene signature profile. In addition, we found that specific components of the anti-viral machinery, such as STING, were critical for both T-VEC permissive replication and induction of host anti-tumor immunity. Tumors which have low levels of STING show minimal response to anti-PD-1 therapy but respond to T-VEC treatment. Further, T-VEC treatment induced a systemic anti-tumor specific CD8+ T cell response and increased immune inflammatory gene signature both in injected and contralateral tumors, leading to regression of un-injected tumors. These data support the role of T-VEC in tumors with low STING levels and confirms how T-VEC mediates melanoma ICD and triggers innate and adaptive anti-tumor immunity.
Materials and methods
Cell lines
Human melanoma cell lines SK-MEL-2, SK-MEL-5, SK-MEL-28, M14, and LOX-IMVI were obtained from ATCC (Manassas, VA). Cells were cultured in monolayers using RPMI supplemented with 10% heat-inactivated bovine serum (Thermo Fisher Scientific), 10mM L-glutamine (Corning), and 0.5% penicillin G-streptomycin sulfate (Corning). Cells were detached using 0.25% trypsin EDTA (Corning) for passaging and were cultured at 37°C in 5% CO2. The murine melanoma cell line D4M3A was generated from Tyr::CreER; BrafCA; Ptenlox/lox miceCitation22 and kindly provided by Dr. David Mullins (Dartmouth University, Hanover, NH). D4M3A cells were cultured as described in Jenkins et al., 2014. All cells used in experiments were low-passage and were confirmed to be mycoplasma-free (LookOut mycoplasma kit; Sigma). During cell viability assays, cells were plated in 96-well plates and treated with T-VEC after 12–16 hr. Cell viability was measured using MTS assay and cell viability measured according to the manufacturer’s instructions (MTS Cell Proliferation Colorimetric Assay Kit, Biovision, Milpitas, CA).
Oncolytic virus
Talimogene laherparepvec (T-VEC) is a modified strain of herpes simplex type 1 virus (HSV-1). In T-VEC two copies of the ICP 34.5 neurovirulence genes are deleted to limit neurotoxicity and promote selective tumor cell replication. In place of the ICP34.5 genes, two copies of the human GM-CSF gene have been engineered to promote dendritic cell infiltration and maturation. The HSV-1 ICP47 gene, which inhibits the transporter associated with antigen processing and presentation, is also deleted to promote antigen processing and presentation. T-VEC is commercially available and was purchased from the Rutgers Cancer Institute Pharmacy.
Danger-associated molecular pattern (DAMP) factor analysis
SK-MEL-28 cells (5 × 10⁵) were mock infected or treated with 1 MOI T-VEC and cell supernatants collected at 24 and 48 h. Cell culture supernatants were passed through 40 μm filters, further centrifuged at 5000 rpm for 10 min at 4°C. High mobility group box 1 (HMGB1) in cell supernatants were detected using an Enzyme-linked immunosorbent assay (ELISA) kit according to the manufacturer’s (Chondrex) instructions. Adenosine triphosphate (ATP) levels in cell supernatants at indicated times were detected using a standard ATP determination kit according to the manufacturer’s (ThermoFisher) instructions. For surface calreticulin expression, SK-MEL-28 cells (1 × 10⁵) were plated in a 6-well chamber slide and treated the next day with phosphate buffer saline (mock) or 1 MOI of T-VEC and stained with anti-calreticulin (CALR) antibody (1:100) and incubated at 4°C overnight, then washed twice with PBS. FITC-anti-Rb antibody was used as a secondary antibody (1:200), incubated for 2 h at room temperature. Finally, cells were coverslipped using nuclear reactive dye and images taken using an Olympus fluorescent microscope.
Western blotting
Total cell lysates obtained from human melanoma cell lines were lysed and 40 µg of lysate was loaded onto an SDS-PAGE gel, electrophoresed, and transferred to a PVDF membrane. Antibodies against Protein Kinase R (PKR) (1:500), Stimulator of Interferon Genes (STING) (1:1000), Cyclic GMP-AMP synthase (cGAS) (1:500), Vinculin (1:1000) and GAPDH (protein control) (1:1000) (Cell Signaling Technologies) were used.
shRNA and CRISPR studies
For shRNA studies, LOX-IMVI cells (3 × 10⁵) were plated in a 6-well plate and 12–16 h. later cells were infected with 10 MOI of lentiviral vector of either PKR, STING or scrambled shRNA from Santa Cruz biotechnology. After 36–48 h, cells were washed with PBS and replaced with normal media containing 0.5 μg/ml of puromycin and selected for 5 days. Western blot analysis was performed on cells that passed puromycin selection to confirm the knock down of targeted gene(s). CRISPR studies were performed using Santa Cruz CRISPR-HDR system according to the manufacturer's guidelines. In short, LOX-IMVI cells (3 × 10⁵) were plated in a 6-well plate and 12–16 h. later cells were transfected with the CRISPR plasmid and HDR plasmid using Liopfectamine 300. After 8–12 h, supernatant was replaced with normal media and grown to 50–60% confluence. Cell selection was performed in 0.5 μg/ml of puromycin for 5 days and single cell clones were isolated using fluorescence-activated cell sorting (FACS).
Mouse treatment studies
Male C57BL/6J mice (stock:000664) were used at 8–9 weeks of age. All mice were obtained from Jackson Labs (Farmington, CT). For tumor growth studies, melanoma tumors were generated by injecting D4M3A cells (3 × 10⁵) in PBS to generate flank tumors. In bilateral flank tumor studies D4M3A cells (3 × 10⁵) were injected on both right and left flanks at the same time. When tumors reached 9–12 mm2 in area mice were randomly divided into groups and administered T-VEC (6 × 10⁶) plaque forming units (PFU) or sterile water via intratumoral (i.t.) injection. Murine anti-PD-1 (rat clone RMP1-14; 15 mg/kg), and isotype control antibodies, rat IgG2a (clone LTF-2; 15 mg/kg), were obtained from BioXcell. For mouse anti-PD-1 studies, B6 mice (n = 5/group) were implanted subcutaneously in the right flank with 3 × 10⁵ D4M3A murine melanoma cells on day 0 and treated with 15 mg/kg of anti-PD-1 antibody via subcutaneous (s.c.) injection on days 8, 10, 12, and 14. Mock group received rat IgG2a isotype control. For T-VEC treatment studies, B6 mice (n = 5/group) were implanted subcutaneously in the right flank with 3 × 10⁵ D4M3A murine melanoma cells on day 0 and treated with 6 × 10⁶ PFU of T-VEC or mock on days 8, 10, 12, and 14. For bilateral flank tumor studies, B6 mice (n = 9/group) were implanted subcutaneously in both right and left flanks with 3 × 10⁵ D4M3A murine melanoma cells on day 0 and treated with 6 × 10⁶ PFU of T-VEC or mock on days 8, 9,10, 12, 13, and 14. Tumors were measured using calipers, and tumor area was calculated by multiplying the greatest length with width. Mice were euthanized before they reach 400 mm2. All experiments were conducted in compliance with Rutgers University animal care and usage committee guidelines.
Flow cytometry analysis
For cell surface receptor analysis, cells (1 × 10⁶) were collected from cultures and the FC receptors were blocked with human Fc block (10 μg/ml) (BD biosciences) for 10 min. Cells were then washed twice with FACS buffer (2% FBS in PBS) and stained with either isotype controls or antibodies against Herpes Virus Entry Mediator (HVEM), nectin-1 and nectin-2 and flow cytometry was performed using LSRII flow cytometer (BD Biosciences) and data analyzed using FlowJo software (v.10.4; Tree Star).
For multiplex cytokine array, (5 × 10⁵ cells) were plated and either treated with 1 MOI of T-VEC or mock and cell culture supernatants were collected and passed through 40 μm filters, and further centrifuged at 5000 rpm for 10 min at 4°C. Cytokine array was performed using Biolegend LEGENDplex™ Human Anti-Virus Response Panel according to the manufacturer’s guidelines. Flow cytometry was performed using LSRII flow cytometer (BD Biosciences), and data were analyzed using LEGENDplex™ software V8.
For tumor microenvironment analysis, tumors from treated mice were harvested on day 29, mechanically dissociated using a gentleMacs Octo Dissociator (Miltenyi), incubated with collagenase (1 mg/ml, Sigma Aldrich) and DNase I (10 U/ml; Promega) for 45 min with rocking at 37°C. Tumors were dissociated again and then passed through a 40 μm screen, and finally re-suspended in FACS buffer. Staining for flow cytometry was performed as previously described.Citation21 In brief, tumor-infiltrating cells were stained with fluorochrome-conjugated anti-mouse antibodies, as well as appropriate isotype control antibodies. Fixable live/dead viability Kit (Invitrogen) was used to stain dead cells. Intracellular staining was performed following the intracellular staining protocol (BioLegend). Antigen-specific CD8+ T cell determination was performed using Fluorochrome-conjugated MHC-I dextramers (Immudex) for HSV-1 gB, murine gp100 or murine TRP2 according to manufacturer’s guidelines. For single-color compensation controls, spleens from naïve B6 mice were treated with ACK Lysis Buffer (Sigma Aldrich) to lyse red blood cells, and single cells were stained with each fluorescent-conjugated antibody. Flow cytometry was performed using LSRII flow cytometer (BD Biosciences) and data were analyzed using FlowJo software (v.10.4; Tree Star). Fluorescent minus one (FMO) controls were used as needed to distinguish the true positive vs. negative stained cell populations.
Gene expression analysis
Total RNA was isolated from tumors using a Qiagen RNAeasy kit. Gene expression analysis was performed using the NanoString PanCancer Immune panel as previously described Citation21. In brief, 50–100 ng of total RNA per sample was mixed with a 3′-biotinylated capture probe and a 5′-reporter probe tagged with a fluorescent barcode from the custom gene expression code set. Probes and target transcripts were hybridized at 65°C for 16 h. Hybridized samples were run on the prep station platform as recommended by the manufacturer’s protocol. The samples were scanned at maximum scan resolution on the nCounter Digital Analyzer. Data were processed using nSolver Analysis Software and the nCounter Advanced Analysis module. For gene expression analysis, data were normalized using the geometric mean of housekeeping genes selected by the GeNorm algorithm.Citation23 Gene expression signatures were analyzed using Nsolver advanced analysis software (4.0) according to the manufacturer’s guidelines. For heatmap generation, normalized data was scaled, and average linkage performed using cluster 3.0 and heat maps were generated using JavaTree.
Statistical analyses
All statistical analyses were performed using GraphPad Prism software version 7.0a. Survival data were analyzed by Kaplan-Meier survival curves, and comparisons were performed by Log Rank test. Cell viability data, flow cytometric data and immunohistochemistry counts were compared using an unpaired student’s t-test (two-tailed) or one-way ANOVA when multiple comparisons were done. P values of less than 0.05 were considered significant. *p < 0.05, **p < 0.01, ***p < 0.001, ****p < 0.0001.
Results
Human melanoma cell lines are permissive to T-VEC infection and oncolysis
We first sought to identify how T-VEC mediates melanoma cell lysis and to address this we tested cell viability following increasing doses of T-VEC in a panel of established melanoma cell lines. Melanoma cell lines were seeded in 96-well plates and treated with T-VEC at the indicated multiplicity of infection (MOI) and an MTS assay was performed on infected SK-MEL-2, SK-MEL-5, SK-MEL-28, M14, and LOX-IMVI cells. Cell viability was measured 5 days after T-VEC treatment using MTS assay (–E). The SK-MEL-5 cell line () exhibited the highest sensitivity to T-VEC induced death, while LOX-IM-VI cells () were relatively resistant to T-VEC. The sensitivity of LOX-IMVI, M14, and SK-MEL cell lines to T-VEC infection was significantly different at low doses (0.03 MOI) (). To determine if the differential lysis across the cell lines was due to difference in HSV-1 cell entry receptors, expression levels of the HSV entry receptors, herpes virus entry mediator (HVEM) and nectin-1, and low affinity nectin-2, which can affect sensitivity to oHSV,Citation24,Citation25 were determined in all cell lines. We found that while nearly all melanoma cell lines expressed at least one of the HSV-1 entry receptors, the sum of fold increase in H-VEM and nectin-1 expression was relatively lower in LOX-IMVI cells compared to other cell lines (Suppl Figure 2).
Figure 1. Human melanoma cell lines exhibit differential sensitivity to T-VEC-mediated lysis in vitro. Cells (5 × 10³) were seeded on 96-well plates and treated with T-VEC at the indicated multiplicity of infection (MOI) and MTS assay performed on day 5 post T-VEC infection to measure cell viability of (A) SK-MEL-2 (B) SK-MEL-5 (C) SK-MEL-28 (D) M14 and (E) LOX-IMVI at 5 days post T-VEC treatment. (F) Cell viability at 5 days post 0.3 MOI T-VEC treatment for selected cell lines. Each experiment was performed two or more times and similar results were obtained. Data are presented as mean ± SEM, and statistical differences between groups were measured by one way ANOVA. **p < 0.01, ***p < 0.001, ****p < 0.0001.
T-VEC infection induces DAMP release from melanoma cell lines
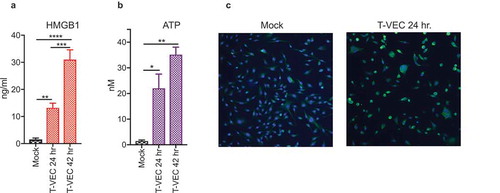
The induction of immunogenic cell death (ICD) is associated with the release of damage-associated molecular patterns (DAMPs). Although generally accepted that oncolytic viruses induce DAMP release, we sought to test whether T-VEC promoted DAMP release in human melanoma cell line following infection. To test this, we selected the moderately sensitive SK-MEL-28 cell line for analysis, and infected cell monolayers with T-VEC at MOI of 1 (or mock infected) and collected cell supernatants at 24 and 48 h after infection to assess surrogate DAMP markers of ICDCitation26 First, the levels of the high mobility group box 1 (HMGB1) was assessed by ELISA and was significantly increased at 24 h compared to mock-infected cells and increased even further at 48 h (). Next, the levels of adenosine triphosphate (ATP) were assessed in cell supernatants and found to be significantly elevated at 24 h compared to mock-infected cells and levels increased further at 48 h (). Finally, the presence of ecto-calreticulin was evaluated at 24 h and presence of ecto-calreticulin was noted by immunostaining with an antibody against calreticulin (CALR; green) and a nuclear stain (DAPI; blue) as shown in . These data suggest that T-VEC induces the release of DAMPs during lysis of melanoma tumor cells, suggestive of ICD.
Figure 2. T-VEC induces immunogenic cell death and release of DAMPs. (A–B) SK-MEL-28 cells (5 × 10⁵) were mock infected or treated with 1 MOI T-VEC and cell supernatants collected at 24 and 48 h post infection. (A) Bar graph indicating levels of high mobility group box 1 (HMGB1) in cell supernatants at indicated times. (B) Bar graph indicating the level of adenosine triphosphate (ATP) in cell supernatants at indicated times. (C) SK-MEL-28 cells (1 × 10⁵) were plated in a 6-well chamber slide and treated the next day with phosphate buffer saline (mock; left panel) or 1 MOI of T-VEC (right panel) and stained with anti-calreticulin (CALR) antibody (green) and nuclear stain (DAPI; blue) 24 h post-T-VEC treatment. Each experiment was performed two times with similar results. Data are presented as mean ± SEM, and statistical differences between groups were measured by student’s t-test. *p < 0.05, **p < 0.01, ***p < 0.001, ****p < 0.0001.
Anti-viral machinery elements are deficient in some melanoma cell lines
The preferential replication of oncolytic viruses in tumor cells is thought to occur in part, because of deficiencies in anti-viral machinery in tumor cells. The characterization of the anti-viral machinery in melanoma cells, however, has not been extensively evaluated. We hypothesized that alterations in anti-viral machinery proteins were necessary for T-VEC replication in melanoma cell lines. HSV-1 is detected in host cells by two major anti-viral pathways, the Protein Kinase R (PKR) and cGAS/STING pathways.Citation27 The levels of PKR and cGAS/STING expression in the various melanoma cell lines was determined and compared to T-VEC cytolytic activity. Using immunoblotting, we observed that the SK-MEL-5 cell line exhibited relatively lower level expression of PKR, STING, and cGAS proteins (), whereas the LOX-IMVI cells exhibited the highest protein levels of PKR and STING. The undetectable PKR and cGAS/STING in the SK-MEL-5 cell line and low levels of STING in SK-MEL-2 was associated with increased sensitivity to T-VEC-mediated lysis (). In contrast, the PKR and cGAS/STING high LOX-IMVI cells were relatively resistant to T-VEC-mediated lysis and required MOI of 1 or greater for activity (). Together these data suggest that PKR, cGAS and STING may contribute to resistance to T-VEC lysis in LOX-IMVI cell line.
Figure 3. Melanoma cell lines display variable levels of anti-viral machinery elements. Total cell lysates were collected from the indicated cell lines (2 × 10⁶) and 40 µg of lysate was loaded onto an SDS-PAGE gel and transferred to a PVDF membrane. Antibodies against protein kinase R (PKR), cyclic-GMP-AMP synthase (cGAS) and stimulator of interferon genes (STING) were used in immunoblotting assay as described in Methods. Immunoblots of PKR (A), cGAS and STING. GAPDH is loading control.
STING contributes to T-VEC resistance in human Melanoma cells
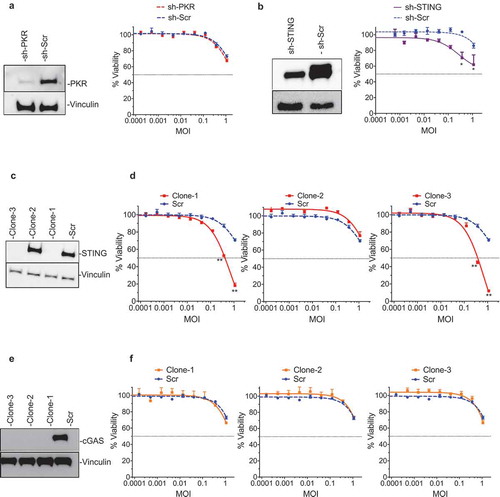
In order to confirm which anti-viral machinery factor elements were responsible for resistance to T-VEC-mediated lysis, the LOX-IMVI cell line was used to generate a series of gene knockout clones. First, a LOX-IMVI-shPKR cell line was generated and clones exhibited low levels of PKR expression compared to LOX-IMVI-shScr (-left panel). However, no significant differences in T-VEC sensitivity were observed between LOX-IMVI shSCr and LOX-IMVI-shPKR cells (-right panel). To test the role of STING in mediating resistance to T-VEC sensitivity, we generated LOXIMVI-shSTING and CRISPR knock-out cell lines. shSTING reduced STING protein levels by over 50% (-left panel) and had only a modest effect on T-VEC cytotoxicity compared to the scrambled control (-right panel). Using CRISPR-Cas9 technology we generated three clones of LOX-IMVI cells, with clone1 and clone3 exhibiting a complete knock out of STING protein (). Both these clones, but not clone2 or scrambled control, were now sensitive to T-VEC at higher MOIs ().
Figure 4. STING mediates resistance to T-VEC-mediated lysis in melanoma cells. (A) Immunoblot showing PKR protein levels from LOXIMVI-scr and LOXIMVI-shPKR cell lysates (left panel) and cell viability 5 days post-T-VEC treatment (right panel). (B) Immunoblot showing STING protein levels from LOXIMVI-scr and LOXIMVI-shSTING cell lysates (left panel) and cell viability 5 days post-T-VEC treatment (right panel). (C) Immunoblot showing STING protein levels from LOXIMVI-CRISPR-scr and LOXIMVI-CRISPR-STING clones 1, 2 and 3 cell lysates. (D) MTS assay measuring cell viability of LOXIMVI-CRISPR-scr and LOXIMVI-CRISPR-STING clones 1, 2 and 3 cell lines at 5 days post-T-VEC treatment. (E) Immunoblot showing cGAS protein levels from LOXIMVI-CRISPR-scr and LOXIMVI-CRISPR-cGAS clones 1, 2 and 3 cell lysates. Vinculin is loading control. (F) MTS assay measuring cell viability of LOXIMVI-CRISPR-scr and LOXIMVI-CRISPR-cGAS clones 1, 2 and 3 cell lines at 5 days post-T-VEC treatment. Each experiment was performed two times with similar results. Data are presented as mean ± SEM, and statistical differences between groups were measured by student’s t-test. *p < 0.05, **p < 0.01.
STING deficiency alters cytokine release induced by T-VEC infection
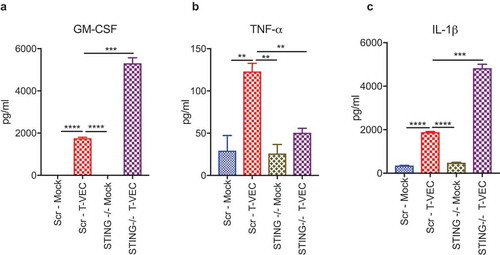
We demonstrated that loss of STING can increase sensitivity to T-VEC in LOX-IMVI cells (). Since activation of STING leads to the release of several cytokines, including type 1 interferons and tumor necrosis factor alpha (TNFα) secretion that mediate anti-viral responses,Citation29 we tested the hypothesis that STING expression was required for cytokine release in the LOX-IMVI cell line following T-VEC infection. To observe the changes in cytokine profile, we treated LOX-IMVI CRISPR-scr and LOX-IMVI-CRISPR-STING-clone1 cells with T-VEC (MOI 1) and collected supernatants 24 h later. We utilized a multiplex human anti-viral immune response array to determine the cytokine profile. There was a significant increase in levels of GM-CSF during T-VEC treatment in LOX-IMVI-CRISPR-STING-clone 1 (), due to the expression of GM-CSF by the virus and suggestive of better viral replication. T-VEC also induced TNFα, which was reduced to mock-infection levels in STING knockout cells (). Finally, we saw a significant increase in levels of interleukin 1 beta (IL-1β) after T-VEC, which was further increased in the knockout cells (). We did not observe significant differences in the production of other cytokines in the panel between the STING knock-out and regular LOX-IMVI cells during T-VEC treatment as shown in Suppl. Table 1. Thus, STING expression appears to contribute for production of cytokines associated with inflammation and induction of innate immunity following T-VEC infection of melanoma cell lines.
Figure 5. STING deficiency alters cytokine profiles following T-VEC treatment. LOXIMVI-CRISPR-scr and LOXIMVI-CRISPR-cGAS clone 1 cells (5 × 10⁵) were plated in 6-well plates and infected with 1 MOI of T-VEC or mock. After 20 h, cell supernatants were collected and measured for cytokine release as described in Methods. Bar graphs show the levels of (A) GM-CSF, (B) TNFα and (C) IL-1β. Each experiment was performed twice with similar results. Data are presented as mean ± SEM, and statistical differences between groups were measured by student’s t-test. **p < 0.01, ***p < 0.001, ****p < 0.0001.
T-VEC treatment induces tumor regression in an anti-PD-1 refractory STINGlo murine melanoma model
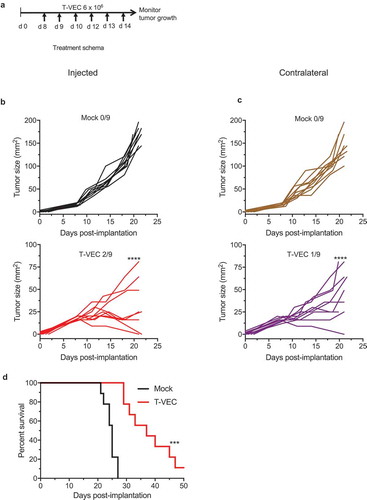
We sought to determine if T-VEC could overcome enhance anti-tumor immunity in vivo compared to checkpoint blockade. To test this, we implanted T-VEC susceptible BRAF V600E mutant D4M3A melanoma tumors in C57/BL6J mice (Suppl Figure 1). Once tumors were palpable, mice were mock-treated, treated with T-VEC or treated with murine αPD-1 antibody as described in Methods. STINGlo D4M3A melanoma tumors did not respond to PD-1 blockade as no significant differences were observed between mock treated mice (Suppl Figure 3A) and mice treated with PD-1 blockade (Suppl Figure 3B). This was consistent with previous reports showing D4M3A cell line does not respond to PD-1 blockade.Citation30 We did, however, observe significant tumor growth reduction in T-VEC treated mice (Suppl Figure 2C). T-VEC treatment significantly reduced tumor growth and completely eliminated tumors in 1/5 treated mice, while treatment with αPD-1 antibody had no significant effect on tumor growth. To determine if T-VEC treatment was associated with systemic anti-tumor activity, we implanted D4M3A tumors in both the right and left flanks of C57/BL6J mice. T-VEC was injected into the right flank palpable tumors according to the study schema shown in . T-VEC treatment significantly reduced tumor volume in both injected and un-injected contralateral tumors compared to mock treated mice (). T-VEC was associated with complete regression in 3/9 injected tumors and 1/9 un-injected tumors. T-VEC treatment also significantly enhanced survival of mice compared to mock treatment (). These data indicate that T-VEC induced anti-tumor activity in vivo in STINGlo melanoma tumors that are resistant to PD-1 blockade.
Figure 6. T-VEC has therapeutic activity in STING^lo melanoma in vivo. (A) Schema of treatment studies in vivo. (B) Individual tumor growth curves of injected tumors of mice treated with mock (top panel; black curves) or T-VEC (bottom panel; red curves). (C) Individual tumor growth curves of contralateral tumors of mock-treated (top panel; brown curves) or T-VEC treated mice (bottom panel; purple curves). Mean tumor area of Mock injected (169.4 mm2) was compared to mean tumor area of Mock un-injected (144 mm2), mean tumor area of T-VEC-injected (15.33 mm2) and mean tumor area of T-VEC-un-injected (47 mm2) at day 21 (D) Kaplan-Meier survival curves from animals. Each experiment was performed twice with similar results. Statistical differences between groups were compared on day 21 by student’s t-test and for survival was performed by Log Rank test. ***p < 0.001, ****p < 0.0001.
T-VEC induces anti-viral and systemic anti-tumor immunity in melanoma
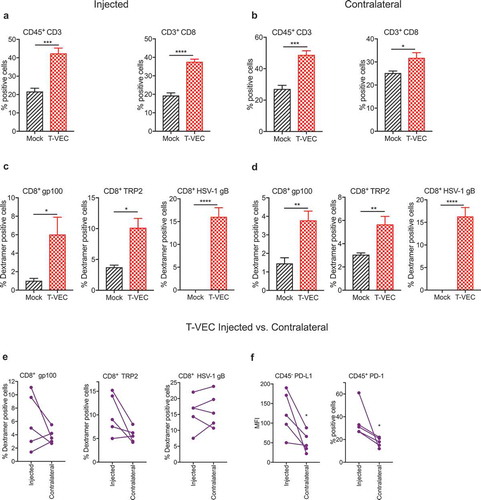
We investigated whether T-VEC treatment of melanoma tumors induced viral or tumor-associated antigen-specific CD8+ T cell responses. We implanted D4M3A melanoma tumors in C57BL/6J mice and were treated as described in Methods. Tumors were harvested on day 29, and flow cytometry analysis revealed significant increases in the frequency of CD3+ and CD8+ T cells in both injected () and contralateral (un-injected) tumors () following T-VEC treatment. We also observed a significant increase in levels of melanoma antigen gp100- and TRP2-specific and HSV-1 glycoprotein-B (gB)-specific CD8+ T cells in injected () and contralateral tumors (). We next compared the levels of antigen-specific CD8+ T cells in the injected vs. contralateral tumors of individual mice and observed that melanoma antigen-specific CD8+ T cells were present in relatively higher numbers in injected lesions compared to contralateral tumors while the levels of HSV-1 gB-specific CD8+ T were similar (). The level of PD-L1 expression on tumor cells and percentage of CD45+ cells expressing PD-1 was significantly higher in injected compared to un-injected tumors (). These data suggest that T-VEC treatment induces both melanoma-specific and HSV-1-specific CD8+ T cells in injected and contralateral STINGlo melanoma tumors.
Figure 7. T-VEC treatment induces host immunity in STING^lo melanoma model. Mice (n = 5/group) were implanted subcutaneously in the right flank with 3 × 10⁵ D4M3A cells on day 0 and treated with 6 × 10⁶ pfu T-VEC or mock injection on days 17, 20, 23, 25 and 27. Tumors were harvested on day 29, and flow cytometry was performed using fluorochrome-conjugated antibodies as described in Methods. (A) Bar graph indicating percentage of CD45+CD3+ T cells and CD3+CD8+ T cells from T-VEC and mock injected tumors and (B) contralateral tumors. (C) Bar graph indicating the percentage of CD8+ T cells specific for murine gp100 or TRP2 and HSV-1 glycoprotein B (HSV-1 gB), respectively, from T-VEC and mock injected tumors and (D) contralateral tumors. (E) Line graphs indicating percentage of CD8+ T cells specific for indicated antigens from either T-VEC injected or contralateral tumors. (F) PD-L1 expression of CD45− cells (left panel) and percentage of CD45+PD-1+ cells (right panel) from T-VEC injected and contralateral tumors. Each experiment was performed two or more times with similar results. Data are presented as mean ± SEM, and statistical differences between groups were measured by student’s t-test. ***p < 0.001, ****p < 0.0001.
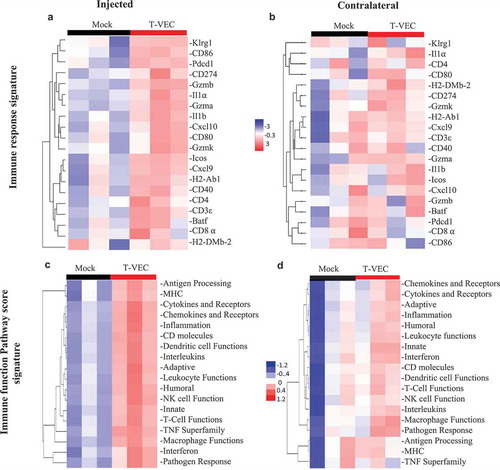
To further evaluate T-VEC induced systemic pro-inflammatory responses in STINGlo melanoma, gene expression analysis was performed on RNA derived from tumors treated with T-VEC. The NanoString PanCancer immune gene expression panel was applied to tumors derived from both injected and contralateral tumor sites (Suppl. Figure 4). Gene expression analysis revealed upregulation of genes involved in: antigen presentation (H2-DMb-2, H2-AbI), costimulation (CD80, ICOS), chemokines (Cxcl10, Cxc19), and genes involved with CD8+ T cell activation (CD8⍺, GZMa, GZMb, and Pdcd1) in both injected () and un-injected contralateral tumors (). We also analyzed gene expression changes in commonly involved immune response pathways and found that T-VEC treatment caused pronounced upregulation of these genes in injected lesions (), with a smaller increase in the contralateral tumors (). Together, these data support the ability of T-VEC to induce systemic inflammation and induce the recruitment of viral-specific and melanoma-associated antigen-specific T cells to melanoma cells even when intracellular STING is low.
Figure 8. T-VEC treatment induces a systemic pro-inflammatory gene signature in STING-deficient tumors in vivo. Mice (n = 3/group) were treated as outlined in Figure 8. Tumors were harvested on day 29, and total RNA was isolated and Nanostring analysis performed using the pancancer immune gene profiling kit as described in Methods. (A) Heatmap showing gene expression levels of genes involved in Immune response signature in the injected tumors and (B) contralateral tumors. (C) Heatmap showing Immune function Pathway score signature in the injected tumors and (D) contralateral tumors.
Discussion
Oncolytic viruses are emerging as a new class of immunotherapeutic agents for cancer treatment. Clinical proof-of-concept has been provided in patients with advanced melanoma who demonstrated improved objective and durable response rates when treated with talimogene laherparepvec (T-VEC), an oncolytic HSV-1 encoding GM-CSF.Citation17 In addition, there is emerging evidence that the combination of T-VEC and immune checkpoint blockade may be beneficial with improved therapeutic responses without increased toxicity.Citation16,Citation31 While these clinical data have been encouraging, the basic mechanisms by which T-VEC, and other oncolytic viruses, mediate anti-tumor activity is incompletely understood. We have previously reported that T-VEC also induces tumor cell apoptosis, following infection.Citation21 In this report, we sought to further define how T-VEC induces cell death, which intracellular factors might influence T-VEC permissiveness in melanoma cells, and whether T-VEC can induce antitumor immune responses in tumors with low expression of STING, which usually correlates to lack of response to immune checkpoint blockade.Citation10
Pre-clinical studies have suggested a multi-modal mechanism of action in which oncolytic viruses promote tumor regression through direct ICD and secondary induction of host anti-tumor immunity.Citation13 Our data confirm that T-VEC does induce ICD with the corresponding release of danger associated molecular pattern (DAMP) factors, including HMGB1, ATP, and ecto-calreticulin. While traditional ICD has focused on DAMP release, which was confirmed in vitro, we also demonstrated that T-VEC could induce an immune response and induce tumor regression of established murine melanoma in vivo. The release of type I interferons due to viral infection has been shown to include TNF-α production,Citation32 as well as infiltration of CD8+ T cells and increased pro-inflammatory gene expression. In our model, we observed these effects in both injected and un-injected tumors in mice. We also demonstrated an increase in PD-1 expression following in vivo treatment with T-VEC, highlighting the natural counter-regulatory mechanism wherein viral-induced type 1 interferons inhibit T cells through engagement of the PD-1/PD-L1 pathway. While this may limit the therapeutic activity of oncolytic viruses, it also provides strong biologic rational for combining T-VEC with PD-1/PD-L1 blockade. While these data are important for understanding how T-VEC contributes to the anti-tumor response, other oncolytic viruses may mediate host anti-tumor immunity through other mechanisms. For example, in a recent report of an oncolytic Newcastle disease virus (NDV) in lung cancer cell lines, NDV induced DAMP release as seen with T-VEC but autophagy also played an important role in mediating cell death.Citation33 As the field develops, it will be critical to confirm how tumor cells die with each oncolytic virus to better identify relevant clinical indications and optimize combination approaches.
The initial response to HSV-1 infection occurs when viral DNA is “sensed” by elements of the anti-viral machinery.Citation34 Indeed, one of the reasons for selective tumor cell replication for many DNA-based oncolytic viruses is due to deficiencies in anti-viral machinery elements.Citation35,Citation36 Using a panel of human melanoma cell lines with variable sensitivity to T-VEC infection, we observed an inverse correlation between STING expression and T-VEC permissiveness. We did not find any impact of PKR or cGAS on T-VEC-mediated killing suggesting that STING may be particularly important. Recent studies have also identified STING expression as an integral intracellular factor in promoting lymphocyte recruitment to tumors and supporting sensitivity to immunotherapy.Citation10 In tumor cells, STING may be triggered by aberrant tumor cell DNA, which then activates cytokines that coordinate with extrinsic STING to induce antigen presentation and trigger host anti-tumor immunity. This pathway has been targeted by STING agonists as a strategy for restoring local T cell recruitment and immunotherapy sensitivity, although clinical trials are still in early development.Citation14 While it was somewhat surprising that cGAS did not demonstrate an independent association with T-VEC-mediated lysis, this might relate to direct STING activation by viral RNA formed during HSV-1 replication via the RIG-I and MAVS pathways or it may be related to the ability of viral DNA to directly activate STING.Citation34 In addition to STING, other signaling pathways may also be involved in mediating immune activation following T-VEC infection of tumor cells and further studies are needed to better define how T-VEC induces local immunity following intratumoral delivery. Our data, however, do support the concept of using T-VEC and other DNA viruses as a strategy to alter the local tumor microenvironment when STING expression is low.
To further evaluate the role of STING in mediating T-VEC-related ICD we developed a STING knockout LOX-IMVI cell line became more permissive to T-VEC infection in the absence of STING. Interestingly, while T-VEC was able to induce TNFα and IL-1β, loss of STING was associated with less TNFα production but significantly increased IL-1β release. TNFα has been shown to be released in response to STING activation; thus, it is not surprising that TNF is reduced in STING KO cell lines.Citation37 We do not fully understand why IL-1β is increased but could speculate that when STING is low the virus will be able to replicate better and thus other innate immune sensors may be able to compensate and induce innate immunity compensatory mechanisms are likely important. Increased IL-1β production might be due to increased inflammatory effects due to enhanced cell killing. In addition to STING, it is also possible that additional intracellular factors may be involved in mediating initial cytokine release induced by T-VEC. Further studies are needed to better understand the implications of altered cytokine release in promoting anti-tumor immunity and immunotherapy.
In order to examine immune responses in an immune-competent melanoma model, we used the D4M3A cell line which has very low STING expression and is resistant to treatment with anti-PD-1 immune checkpoint inhibitor. In this model employing a bilateral tumor design, T-VEC was able to induce a strong anenestic response with regression of injected and un-injected tumors with improved survival. In addition, we demonstrated the accumulation of viral- and tumor antigen-specific T cells within injected and un-injected lesions. While we do not definitively understand the mechanism by which the gB-specific CD8+ T cells get recruited to the contralateral tumor, this effect has been consistently observed (see ). One explanation could be the presence of cross-reactive antigenic epitopes shared between HSV-1 and the tumor but a preliminary review did not identify any putative shared sequences. Another explanation is that the contralateral tumor may express chemokines that result in the recruitment of recently primed CD8+ T cells. This can also be attributed to regulatory mechanisms that can suppress the circulation of self-tumor antigen-specific CD8+ T cells.Citation38,Citation39 In addition, increased pro-inflammatory gene expression was detected in all tumors suggesting a systemic anti-tumor immune response had been generated. This included numerous genes associated with multiple aspects of immune cell function, including antigen presentation, innate immunity, and T cell activation and recruitment. This supports the concept that T-VEC could overcome innate STING deficiency within the melanoma cells to promote ICD and anti-tumor immunity. It is important to note that while T-VEC exhibited immune infiltration to both injected and non-injected lesions, these responses can even be augmented by using T-VEC and other combinations as previously described.Citation21 These data are also supported by results of a recent phase I trial of T-VEC and pembrolizumab, which demonstrated 62% objective response rate in melanoma patients treated with the combination.Citation16 In this small trial, patients harboring tumors without PD-L1 expression responded. While PD-L1 expression has not completely correlated with therapeutic activity to checkpoint blockade in melanoma, this may be significant when considering other cancers where PD-L1 expression may be important for clinical activity with checkpoint blockade.
In summary, we have shown that T-VEC induces immunogenic cell death, DAMP release, cytokine production and induction of inflammatory gene expression. STING also emerged as a critical factor in mediating melanoma cell sensitivity to T-VEC infection, killing, and immune activation. This observation might also support STING expression as a predictive biomarker of T-VEC response, although this requires clinical validation. Previous studies have shown that oncolytic HSV-1 can mediate the regression of STING-low tumor cells.Citation35 It is possible that T-VEC may mediate anti-tumor responses through different pathways in STING expressing and STING low/deficient tumors. A better understanding of how T-VEC kills melanoma cells and promotes systemic anti-tumor immunity should promote more rational combination studies and could help identify patients with tumors most likely to respond to treatment with oncolytic viruses.
Disclosure of Potential Conflicts of Interest
H.L. Kaufman serves as chief medical officer at Replimune, Inc. S.D. Rabkin is an inventor on patents relating to oncolytic HSV owned by Georgetown University and Massachusetts General Hospital that have been licensed to Amgen, for which he receives royalties, and has received honoraria from Replimune. This work was partially supported by NIH grant R01CA160762 to S.D. Rabkin.
Supplemental Material
Download PDF (3.5 MB)Supplementary material
Supplemental data for this article can be accessed on the publisher’s website.
Additional information
Funding
Related Research Data
References
- Ribas A, Wolchok JD. Cancer immunotherapy using checkpoint blockade. Science. 2018;359:1350–1355. doi:10.1126/science.aar4060.
- Sharma P, Hu-Lieskovan S, Wargo JA, Ribas A. Primary, adaptive, and acquired resistance to cancer immunotherapy. Cell. 2017;168:707–723. doi:10.1016/j.cell.2017.01.017.
- Gajewski TF, Louahed J, Brichard VG. Gene signature in melanoma associated with clinical activity: a potential clue to unlock cancer immunotherapy. Cancer J. 2010;16:399–403. doi:10.1097/PPO.0b013e3181eacbd8.
- Vilain RE, Menzies AM, Wilmott JS, Kakavand H, Madore J, Guminski A, Liniker E, Kong BY, Cooper AJ, Howle JR, et al. Dynamic changes in PD-L1 expression and immune infiltrates early during treatment predict response to PD-1 blockade in melanoma. Clin Cancer Res. 2017;23:5024–5033. doi:10.1158/1078-0432.CCR-16-0698.
- Colli LM, Machiela MJ, Myers TA, Jessop L, Yu K, Chanock SJ. Burden of nonsynonymous mutations among TCGA cancers and candidate immune checkpoint inhibitor responses. Cancer Res. 2016;76:3767–3772. doi:10.1158/0008-5472.CAN-16-0170.
- Erdag G, Schaefer JT, Smolkin ME, Deacon DH, Shea SM, Dengel LT, Patterson JW, Slingluff CL Jr. Immunotype and immunohistologic characteristics of tumor-infiltrating immune cells are associated with clinical outcome in metastatic melanoma. Cancer Res. 2012;72:1070–1080. doi:10.1158/0008-5472.CAN-11-3218.
- Yi M, Qin S, Zhao W, Yu S, Chu Q, Wu K. The role of neoantigen in immune checkpoint blockade therapy. Exp Hematol Oncol. 2018;7:28. doi:10.1186/s40164-018-0120-y.
- Spranger S, Dai D, Horton B, Gajewski TF. Tumor-residing Batf3 dendritic cells are required for effector T cell trafficking and adoptive T cell therapy. Cancer Cell. 2017;31:711–723. doi:10.1016/j.ccell.2017.04.003.
- Ayers M, Lunceford J, Nebozhyn M, Murphy E, Loboda A, Kaufman DR, Albright A, Cheng JD, Kang SP, Shankaran V, et al. IFN-gamma-related mRNA profile predicts clinical response to PD-1 blockade. J Clin Invest. 2017;127:2930–2940. doi:10.1172/JCI91190.
- Woo SR, Fuertes MB, Corrales L, Spranger S, Furdyna MJ, Leung MY, Duggan R, Wang Y, Barber GN, Fitzgerald KA, et al. STING-dependent cytosolic DNA sensing mediates innate immune recognition of immunogenic tumors. Immunity. 2014;41:830–842. doi:10.1016/j.immuni.2014.10.017.
- Li T, Chen ZJ. The cGAS-cGAMP-STING pathway connects DNA damage to inflammation, senescence, and cancer. J Exp Med. 2018;215:1287–1299. doi:10.1084/jem.20180139.
- Harlin H, Meng Y, Peterson AC, Zha Y, Tretiakova M, Slingluff C, McKee M, Gajewski TF. Chemokine expression in melanoma metastases associated with CD8+ T-cell recruitment. Cancer Res. 2009;69:3077–3085. doi:10.1158/0008-5472.CAN-08-2281.
- Bommareddy PK, Shettigar M, Kaufman HL. Integrating oncolytic viruses in combination cancer immunotherapy. Nat Rev Immunol. 2018;18:498–513. doi:10.1038/s41577-018-0014-6.
- Corrales L, Glickman LH, McWhirter SM, Kanne DB, Sivick KE, Katibah GE, Woo SR, Lemmens E, Banda T, Leong JJ, et al. Direct activation of STING in the tumor microenvironment leads to potent and systemic tumor regression and immunity. Cell Rep. 2015;11:1018–1030. doi:10.1016/j.celrep.2015.04.031.
- Kaufman HL, Kohlhapp FJ, Zloza A. Oncolytic viruses: a new class of immunotherapy drugs. Nat Rev Drug Discov. 2015;14:642–662. doi:10.1038/nrd4663.
- Ribas A, Dummer R, Puzanov I, VanderWalde A, Andtbacka RHI, Michielin O, Olszanski AJ, Malvehy J, Cebon J, Fernandez E, et al. Oncolytic virotherapy promotes intratumoral T cell infiltration and improves anti-PD-1 immunotherapy. Cell. 2017;170:1109–1119. e10. doi:10.1016/j.cell.2017.08.027.
- Andtbacka RH, Kaufman HL, Collichio F, Amatruda T, Senzer N, Chesney J, Delman KA, Spitler LE, Puzanov I, Agarwala SS, et al. Talimogene laherparepvec improves durable response rate in patients with advanced melanoma. J Clin Oncol. 2015;33:2780–2788.
- Kaufman HL, Kim DW, DeRaffele G, Mitcham J, Coffin RS, Kim-Schulze S. Local and distant immunity induced by intralesional vaccination with an oncolytic herpes virus encoding GM-CSF in patients with stage IIIc and IV melanoma. Ann Surg Oncol. 2010;17:718–730. doi:10.1245/s10434-009-0809-6.
- Reinert LS, Lopusna K, Winther H, Sun C, Thomsen MK, Nandakumar R, Mogensen TH, Meyer M, Vaegter C, Nyengaard JR, et al. Sensing of HSV-1 by the cGAS-STING pathway in microglia orchestrates antiviral defence in the CNS. Nat Commun. 2016;7:13348. doi:10.1038/ncomms13348.
- Bedoui S, Whitney PG, Waithman J, Eidsmo L, Wakim L, Caminschi I, Allan RS, Wojtasiak M, Shortman K, Carbone FR, et al. Cross-presentation of viral and self antigens by skin-derived CD103+ dendritic cells. Nat Immunol. 2009;10:488–495. doi:10.1038/ni.1724.
- Bommareddy PK, Aspromonte S, Zloza A, Rabkin SD, Kaufman HL. MEK inhibition enhances oncolytic virus immunotherapy through increased tumor cell killing and T cell activation. Sci Transl Med. 2018;10. doi:10.1126/scitranslmed.aao4496.
- Jenkins MH, Steinberg SM, Alexander MP, Fisher JL, Ernstoff MS, Turk MJ, Mullins DW, Brinckerhoff CE. Multiple murine BRaf(V600E) melanoma cell lines with sensitivity to PLX4032. Pigment Cell Melanoma Res. 2014;27:495–501. doi:10.1111/pcmr.12220.
- Vandesompele J, De Preter K, Pattyn F, Poppe B, Van Roy N, De Paepe A, Speleman F. Accurate normalization of real-time quantitative RT-PCR data by geometric averaging of multiple internal control genes. Genome Biol. 2002;3:RESEARCH0034. doi:10.1186/gb-2002-3-7-research0034.
- Yu Z, Adusumilli PS, Eisenberg DP, Darr E, Ghossein RA, Li S, Liu S, Singh B, Shah JP, Fong Y, et al. Nectin-1 expression by squamous cell carcinoma is a predictor of herpes oncolytic sensitivity. Mol Ther. 2007;15:103–113. doi:10.1038/sj.mt.6300009.
- Friedman GK, Bernstock JD, Chen D, Nan L, Moore BP, Kelly VM, Youngblood SL, Langford CP, Han X, Ring EK, et al. Enhanced sensitivity of patient-derived pediatric high-grade brain tumor xenografts to oncolytic HSV-1 virotherapy correlates with nectin-1 expression. Sci Rep. 2018;8:13930. doi:10.1038/s41598-018-32353-x.
- Kepp O, Senovilla L, Vitale I, Vacchelli E, Adjemian S, Agostinis P, Apetoh L, Aranda F, Barnaba V, Bloy N, et al. Consensus guidelines for the detection of immunogenic cell death. Oncoimmunology. 2014;3:e955691. doi:10.4161/21624011.2014.955691.
- Zhang J, Zhao J, Xu S, Li J, He S, Zeng Y, Xie L, Xie N, Liu T, Lee K, et al. Species-specific deamidation of cGAS by herpes simplex virus UL37 protein facilitates viral replication. Cell Host Microbe. 2018;24:234–248. e5. doi:10.1016/j.chom.2018.07.004.
- Cai X, Chiu YH, Chen ZJ. The cGAS-cGAMP-STING pathway of cytosolic DNA sensing and signaling. Mol Cell. 2014;54:289–296. doi:10.1016/j.molcel.2014.03.040.
- Barber GN. STING: infection, inflammation and cancer. Nat Rev Immunol. 2015;15:760–770. doi:10.1038/nri3921.
- Deken MA, Gadiot J, Jordanova ES, Lacroix R, van Gool M, Kroon P, Pineda C, Geukes Foppen MH, Scolyer R, Song JY, et al. Targeting the MAPK and PI3K pathways in combination with PD1 blockade in melanoma. Oncoimmunology. 2016;5:e1238557. doi:10.1080/2162402X.2016.1238557.
- Chesney J, Puzanov I, Collichio F, Singh P, Milhem MM, Glaspy J, Hamid O, Ross M, Friedlander P, Garbe C, et al. Randomized, open-label phase II study evaluating the efficacy and safety of talimogene laherparepvec in combination with ipilimumab versus ipilimumab alone in patients with advanced, unresectable melanoma. J Clin Oncol. 2018;36:1658–1667. doi:10.1200/JCO.2017.73.7379.
- Minami M, Kita M, Yan XQ, Yamamoto T, Iida T, Sekikawa K, Iwakura Y, Imanishi J. Role of IFN-gamma and tumor necrosis factor-alpha in herpes simplex virus type 1 infection. J Interferon Cytokine Res. 2002;22:671–676. doi:10.1089/10799900260100150.
- Ye T, Jiang K, Wei L, Barr MP, Xu Q, Zhang G, Ding C, Meng S, Piao H. Oncolytic Newcastle disease virus induces autophagy-dependent immunogenic cell death in lung cancer cells. Am J Cancer Res. 2018;8:1514–1527.
- Ma Z, Damania B. The cGAS-STING defense pathway and its counteraction by viruses. Cell Host Microbe. 2016;19:150–158. doi:10.1016/j.chom.2016.01.010.
- Xia T, Konno H, Barber GN. Recurrent loss of STING signaling in melanoma correlates with susceptibility to viral oncolysis. Cancer Res. 2016;76:6747–6759. doi:10.1158/0008-5472.CAN-16-1404.
- Barber GN, Gual Pimenta de Queiroz NM, Xia T, Konno H. Ovarian cancer cells commonly exhibit defective STING signaling which affects sensitivity to viral oncolysis. Mol Cancer Res. 2018. doi:10.1158/1541-7786.MCR-18-0504. [Epub ahead of print]
- Weiss JM, Guerin MV, Regnier F, Renault G, Galy-Fauroux I, Vimeux L, Feuillet V, Peranzoni E, Thoreau M, Trautmann A, et al. The STING agonist DMXAA triggers a cooperation between T lymphocytes and myeloid cells that leads to tumor regression. Oncoimmunology. 2017;6:e1346765. doi:10.1080/2162402X.2017.1346765.
- Yuka Maeda HN, Sakaguchi S. Self-tumor-antigen-specific CD8 T cells were suppressed by regulatory T cells. Presented at AACR; Cancer Immunol Res; 2016.
- Rosenberg SA, Sherry RM, Morton KE, Scharfman WJ, Yang JC, Topalian SL, Royal RE, Kammula U, Restifo NP, Hughes MS, et al. Tumor progression can occur despite the induction of very high levels of self/tumor antigen-specific CD8+ T cells in patients with melanoma. J Immunol. 2005;175:6169–6176.