
ABSTRACT
Gastric cancer (GC) development and progression is significantly associated with tumour immune escape. T cell immunoreceptor with Ig and ITIM domains (TIGIT) inhibits T-cell responses and is associated with human cancers and T cell exhaustion phenotypes, but its role in cancers remains unclear. TIGIT and programmed cell death protein (PD)-1 levels were detected in 441 human GC specimens using histochemistry. We used flow cytometry to evaluate percentage of TIGIT+ constituting CD8+ T cells of 23 patients with GC who underwent D2 gastrectomy and the S-1 plus oxaliplatin (SOX) regimen. We investigated the influence of SOX regimen and TIGIT functional antibody on CD8 tumour-infiltrating lymphocytes (TILs). Results showed that PD-1 and TIGIT were significantly over expressed in GC and predicted poorer outcome, agreeing with bioinformatics analysis. Significantly reduced percentages of CD8+ TIGIT+ cells were observed in patients after D2 gastrectomy (pre- vs post-surgery, 38 ± 8.7% vs. 26.7% ± 5.2%, p < 0.0001). TIGIT expression on CD8+T cells was modulated by chemotherapeutics (pre- and post-chemotherapy, 31.3 ± 9% vs. 25.1 ± 4.5%, respectively, p = 0.0047) and higher TIGIT expression in post-chemotherapy group was associated with relapsed GC (p = 0.036). In vitro experiments revealed increased CD8+ TIL proliferation and interferon (IFN)-γ production following SOX regimen and TIGIT functional antibody treatments. In conclusion, TIGIT contributes to CD8+ TILs immune dysfunction in patients with GC. Combination of anti-TIGIT therapy and chemotherapy could be considered a therapy for GC.
Introduction
Gastric cancer (GC) is one of the most common causes of cancer-related deaths worldwide;Citation1 however, locally advanced GC has a high recurrence rate of approximately 40–80%, even with D2 lymph node dissection.Citation2 Various adjuvant chemotherapy regimens have been developed for patients with advanced GC to improve patient outcomes after surgery. However, the prognosis remains extremely poor in patients at advanced stages of GC.Citation3 Recently, agents targeting negative regulators (so-called “immune checkpoints”) offer great promise for effective cancer therapy.Citation4 These approaches target T-cell exhaustion; a unique immune inhibitory mechanism involving a state of T-cell dysfunction that develops in response to persistent antigen stimulation.Citation5 Inhibitors of immune checkpoint receptors, such as cytotoxic T-lymphocyte associated protein 4 (CTLA-4) and programmed cell death protein 1 (PD-1), are expressed on immune cells to limit immune responses and prevent immune-driven pathology.Citation6 Even with striking success in several cancers, numerous patients do not benefit from these therapies and, therefore, new therapeutic modalities, including immunotherapy to complement chemotherapy, are urgently needed.
Chemotherapeutic agents have long been known to induce systemic immunosuppressive effects due to bone marrow toxicity.Citation7 Previous studies have shown that different chemotherapeutic agents play varying roles in the immune modulation of cancer. Paclitaxel and gemcitabine induce immunoreactive effects such as promotion of tumour antigen presentation by up-regulating the expression of tumour antigens or MHC class I molecules.Citation8 Other agents decrease the number of immunosuppressive cells, such as regulatory T cells or myeloid derived suppressor cells (MDSC), thereby increasing helper T-cell accumulation at the tumour site.Citation9 On the other hand, some chemotherapeutic agents lead to local immunosuppression via induction of a specific inflammasome, promoting tumour growth.Citation10 Although the S-1 plus oxaliplatin (SOX) regimen is a major treatment option for patients with advanced GC, the influence of the regimen on T cells remains unclear.
Immune responses play an important role in interrupting the progression of cancer cells. Tumour-infiltrating lymphocytes (TILs) are mononuclear cells that infiltrate the stroma surrounding tumour cells, and are considered to be basic parameters of the complicated immune responses to tumour cells.Citation11 TILs, including both CD8-positive and forkhead box P3 (FOXP3)-positive T-cells, play a role in the immune response. Recent studies support the notion that baseline tumour infiltration by activated CD8+T cells (inflamed tumours) identifies a group of patients with a better chance for a clinical response to treatment with immunotherapy than those with non-inflamed tumours.Citation12
T cell immunoreceptor with Ig and ITIM domains (TIGIT, also known as WUCAM, Vstm3, or VSIG9) was initially discovered in a genomic search for genes specifically expressed in T cells that had protein domain structures representative of potential inhibitory receptors.Citation13 The expression of TIGIT is tightly restricted to lymphocytes, with the highest expression occurring on effector and regulatory CD4+ T cells, follicular helper CD4+ T cells, effector CD8+ T cells, and natural killer (NK) cells.Citation14 TIGIT is an important inhibitory molecule in the PVR/nectin family, and is associated with human cancers and T cell exhaustion phenotypes.Citation14 Previous findings have established TIGIT as an important immune receptor for limiting T cell inflammation,Citation14 and its expression appears to correlate with PD-1 expression.Citation15 Over the last decade, preclinical studies have demonstrated that chemotherapy can induce immunogenic tumour cell death, increase antigen presentation, and decrease suppressive regulatory T cell (Treg) populations, resulting in improved antitumour immunity.Citation16
However, there has been no comprehensive examination of the effects of SOX regimen on human CD8 TILs subsets and how changes in immunological parameters may impact the potential for generating antitumor immunity and clinical outcome. In this study, we aimed to assess the clinical significance of TIGIT and PD-1 in patients with locally advanced GC treated with SOX regimen after D2 gastrectomy.
Results
TIGIT and PD-1 are highly expressed in GC and predict poor outcome
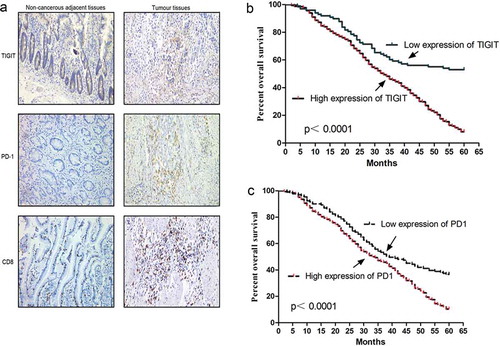
The clinic pathological and molecular characteristics of patients with GC are shown in . Our results revealed that TIGIT expression was higher in GC tissues (77.8%, 343/441, ) than in control samples, and were notably associated with the tumour size (P < 0.001), histological types (P < 0.001), tumour/node/metastasis (TNM) stage (P < 0.001), and lymph node metastasis (P < 0.001, ). Similarly, PD-1 expression was higher in GC tissues (70.3%, 310/441) than it was in control tissues, and was associated with the tumour size (P < 0.001), histological types (P = 0.024), TNM stage (P < 0.001), and lymph node metastasis (P < 0.001, Table S1). Subsequently, we analyzed the relationship between TIGIT expression and the prognosis of patients with GC and found that a higher TIGIT expression level was associated with a poorer prognosis (P < 0.001, ). Furthermore, advanced stages (III or IV, P < 0.001), poorly differentiated histological type (P < 0.001), positive lymph node metastasis (P < 0.001), intestinal tumour histology (P < 0.001), larger tumour size (≥ 5 cm, P < 0.001), high TIGIT expression (P < 0.001, , Fig. S1), and high PD-1 expression (P < 0.001, Table S1) were significantly associated with a poorer prognosis in patients with GC. As shown in , a higher TIGIT expression level was associated with a poorer prognosis (P < 0.001), similar to PD-1 (P < 0.001, ). However, there was no association between overall survival (OS) and tumour locations (P = 0.094). Multivariate survival analysis suggested that TIGIT (P < 0.001) was an independent adverse prognostic factor of GC (). Simultaneously, we analyzed the relationship between PD-1 and clinical pathology as well as prognosis and found that PD-1 had a similar outcome with TIGIT (P = 0.025, Table S1).
Table 1. Univariate and multivariate statistics of the prognostic value of age, gender, size, histological types, tumor histology, lymph node metastasis, stage, location and expression level of TIGIT for survival in gastric cancer.
Figure 1. TIGIT and PD-1 expression in GC patients (a) Immunohistochemistry analysis of TIGIT, PD-1, and CD8 expression in gastric cancer (GC) tissues and adjacent normal tissues. (b) Kaplan Meier survival curve showed the association between TIGIT expression and over survival time in patients with GC (P < 0.0001). The patient number of high expression of TIGIT is 343 and the number of low expression is 98. (c) Kaplan Meier survival curve showed association between PD-1 expression and overall survival (OS) time in patients (P < 0.0001) The patient number of high expression of PD-1 is 310 and the number of low expression is 131.
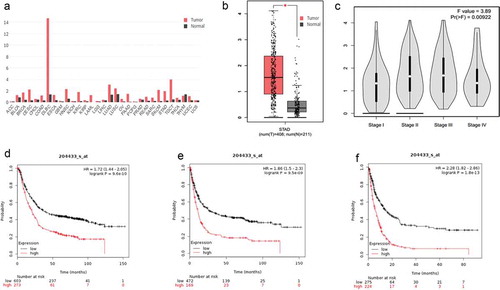
In addition, we predicted the expression of TIGIT and PD-1 mRNA in GC and adjacent tissues in the GEPIA database (http://gepia.cancer-pku.cn/index.html). As shown in and S2A, the TIGIT and PD-1 mRNA expression levels were measured in 408 GC tissue samples were significantly higher than those in 211 adjacent non-tumour tissues (Figures S1B-1C and S2B-2C). Follow-up was also available for the Kaplan-Meier Plotter database (http://kmplot.com/analysis/index.php?p=service). The results showed that higher TIGIT expression was associated with shorter OS (hazard ratio [HR] = 1.72, p = 9.6e-10), first progression (FP, HR = 1.86, p = 9.5e-09), and post-progression survival (PPS, HR = 2.28, P = 1.8e-13, –) compared to lower expression. Interestingly, the outcome of PD-1 was similar to that of TIGIT (Figure S2d–2f).
Figure 2. The asscociation between TIGIT expression and GC patients outcome predicted online. (a) GEPIA database prediction of TIGIT expression in different types of tumour tissues and adjacent normal tissues. (b) Expression of TIGIT in gastric cancer (GC) tissues and adjacent normal tissues in GEPIA database. (c) Association between TIGIT expression and stage in GEPIA database. (d) Follow-up was available for the TIGIT expression and overall survival (OS) in Kaplan-Meier Plotter database (P = 9.6e-10). (e) Follow-up was available for TIGIT expression and FP in Kaplan-Meier Plotter database (P = 9.5e-09). (f) Follow-up was available for the TIGIT expression and PPS in Kaplan-Meier Plotter database (P = 1.8e-13). *P < 0.05.
TIGIT is elevated on CD8+T cell in patients with GC and significantly reduced after D2 gastrectomy
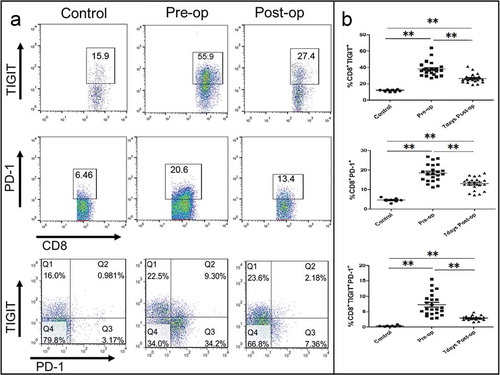
To investigate the role of TIGIT in the pathogenesis of GC, we assessed PBMCs from 23 patients with GC at initial diagnosis for TIGIT expression on CD8+ T cells. PBMCs from eight HVs(Healthy Volunteers) were tested as controls. The characteristics of the patients with GC in this cohort are shown in Table S2. As shown in –, the frequency of TIGIT+ cells among CD8+ T cells from patients with GC was significantly higher than that from the HVs (mean frequency 38 ± 8.7% vs.11.7 ± 1.3%, P < 0.0001), and reduced significantly after D2 gastrectomy (mean frequency 38 ± 8.7% vs. 26.7 ± 5.2%, P < 0.0001). The frequency of PD-1 + cells among CD8+ T cells from patients with GC showed the same results as those of TIGIT. Similarly, the frequency of CD8+TIGIT+ PD-1+cells from patients with GC showed a significant difference pre- and post-operatively (P < 0.0001).
Figure 3. TIGIT is elevated on CD8+T cell in patients with GC and significantly reduced after D2 gastrectomy. (a) Flow cytometry analysis of CD8+ TIGIT+, CD8+PD-1+, or CD8+ TIGIT+PD-1+ T-cell populations in pre- and post-operative PBMC from patients with GC. (b) Frequency and number of CD8+ TIGIT+, CD8+PD-1+, or CD8+ TIGIT+PD-1+ cells in pre-chemotherapy and post-chemotherapy treated PBMC from patients with GC. **P < 0.01.
TIGIT expression on CD8+ T cell is modulated by chemotherapeutic agents
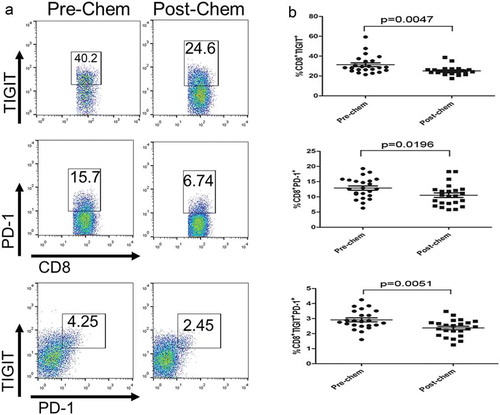
To determine whether TIGIT expression was modulated by chemotherapeutic agents, we evaluated the TIGIT expression on CD8+ T cell in PBMCs of patients with GC, and found that TIGIT expression frequency on CD8+TIGIT+ or CD8+PD-1 + T cells from post-chemotherapy was significantly lower than those of pre-chemotherapy (P = 0.0047 and P = 0.0196, respectively, –). Similarly, the frequency of CD8+TIGIT+ PD-1+cells from patients with GC showed a significant difference between pre- and post-chemotherapy (P = 0.0051). The correlations between immune markers, expressions after treated with SOX and clinical pathology is displayed in . The percentage of post-chem CD8+ TIGIT+ cells was significantly associated with size (P = 0.049), TNM stage (P = 0.027), and differentiation (P = 0.012). Interestingly, post-chemotherapy, CD8+ PD1+ also showed the same result. However, the percentage of post-chemotherapy CD8+ TIGIT+ PD1+ cells was only related to lymph node metastasis (P = 0.002) and TNM stage (P = 0.027).
Table 2. Correlations between immune markers expressions after treated with SOX regmen and clinicopathologic information.
Figure 4. TIGIT expression on CD8+ T cell is modulated by chemotherapeutic agents. (a) Flow cytometry analysis of CD8+ TIGIT+, CD8+PD-1+, or CD8+ TIGIT+PD-1+ T-cell populations in pre-chemotherapy and post-chemotherapy PBMC from patients with GC. Frequency and number of CD8+ TIGIT+, CD8+PD-1+, or CD8+ TIGIT+PD-1+ cells in pre-chemotherapy and post-chemotherapy treated PBMC from patients with GC. *P < 0.05, **P < 0.01.
High TIGIT expression is associated with relapsed GC
When the chemotherapy was completed, the patients were divided into two groups depending on the percentage of TIGIT on CD8+ T cells (high and low groups ≥ 25.1% and < 25.1%, respectively). After chemotherapy, TIGIT/PD-1 expression levels on CD8+ T cell were evaluated every 3 months or until relapse. Total follow-up was 12 months after surgery. As shown in , the percentage of higher post-chem CD8+ TIGIT+ cells was positively associated with recurrence (P = 0.036) and the same as CD8+ PD-1+ cells (P = 0.016), and the percentage of post-chem CD8+ TIGIT+ PD-1+ cells also showed significant association with recurrence (P = 0.036). We also performed a flow analysis of TIGIT/PD-1 expression in PBMCs of seven patients with GC with relapse, and found that the percentage of CD8+ TIGIT +, CD8+ PD-1+, and CD8+ TIGIT + PD-1+ T cells from patients with GC relapse was significantly higher than that of post-chemotherapy (–). Similarly, we tested the PBMCs of the remaining 16 relapse-free patients and found that the percentage of CD8+ TIGIT +, CD8+ PD-1+, and CD8+ TIGIT + PD-1+ T cells showed no significant difference compared to post-chemotherapy (Figure S3).
Table 3. Correlations between immune markers expressions after treated with SOX regmen and relapse.
Figure 5. High TIGIT expression is associated with relapsed GC. (A) Flow cytometry analysis of CD8+ TIGIT+, CD8+PD-1+, or CD8+ TIGIT+PD-1+,or CD8+ TIGIT+PD-1+ T-cell populations in post-chemotherapy and relapse blood from patients with GC. (B) Frequency and number of CD8+ TIGIT+, CD8+PD-1+, or CD8+ TIGIT+PD-1+ T-cell populations in post-chemotherapy and relapse blood from patients with GC (C) The association between CD8+ TIGIT+, CD8+PD-1+, or CD8+ TIGIT+PD-1+ T-cell expression and DFS of GC patients. **P < 0.01, ***P < 0.001.
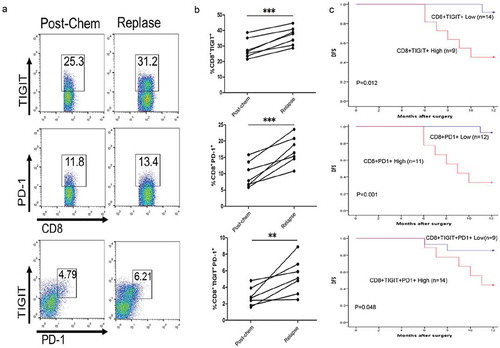
In addition, we analyzed the disease-free survival (DFS) of 23 patients with GC. The results showed that CD8+ TIGIT+ high expression showed shorter DFS relative to CD8+ TIGIT+ low expression (P = 0.012). Similarly, CD8+ PD-1+ high expression relative to low expression of CD8+ PD-1+ showed shorter DFS (P = 0.001), similarly, there was also a significant difference in high expression of CD8+ TIGIT + PD-1+ T cells relative to its low expression (P = 0.048, ). Multivariable statistics of the prognosis value of parameters for DFS in GC revealed higher TIGIT (P = 0.041, PD-1, P = 0.037), and TIGIT/PD-1 (P = 0.044) expression level could serve as an independent prognostic indicator for the DFS rate of patients with GC ().
Table 4. multivariate statistics of the prognostic value of parameters, PD-1 and TIGIT for DFS in GC patients.
Combination of SOX and anti-TIGIT is beneficial to CD8+ T cells proliferation and IFN-γ release
The IC50 of SOX against CD8+ TIL cell is shown in Figure S4 (oxaliplatin, plus S-1, 6.5 µM each). The data above shows that TIGIT could play a promoting role and was reduced by chemotherapy in GC. We investigated how TIGIT affects the functions of CD8+ T cells using cells isolated from fresh GC tissues. Immunofluorescence was used to detect the expression of KI-67 on CD8+ T cells, further revealing the proliferation ability of cells in the control, SOX, anti-TIGIT and SOX plus anti-TIGIT groups. The results showed that CD8+ T cell proliferation ability was significantly increased after blocking TIGIT, decreased by treatment with SOX alone, and their combination increased the proliferation of CD8+ T cells compared to SOX alone (–).
Figure 6. Combination of SOX and anti-TIGIT is beneficial to CD8+ T cells proliferation and IFN-γ release. (a, b) CD8+ TIL cells were treated with SOX, Anti-TIGIT, or SOX +Anti-TIGIT. Immunofluorescence was used to detect expression levels of KI-67. (c, d) CD8+ TIL cells were treated with SOX, Anti-TIGIT, or SOX +Anti-TIGIT, and stimulated with PMA for 5 h. Frequency and number of IFN-γ of CD8+ cells were quantified. *P < 0.05, **P < 0.01.
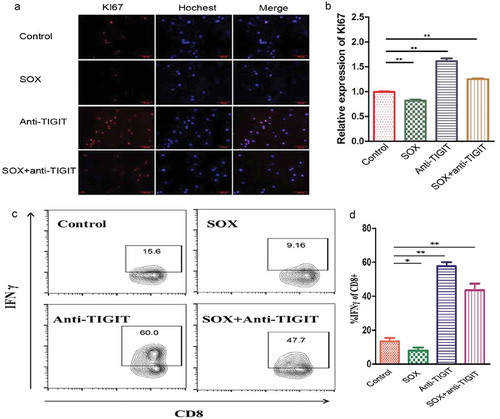
Subsequently, IFN-γ production in CD8+ T cells was determined using flow cytometry and blocking TIGIT highly increased IFN-γ production, and the SOX regimen decreased IFN-γ production in CD8+ T cells. In summary, a combination of SOX and TIGIT inhibition increased IFN-γ production in CD8+T cells (–).
Discussion
Growing evidence has revealed that checkpoint inhibitors show unprecedented rates of durable clinical responses in patients with various cancer types, and have now moved to the forefront of cancer research. Immune checkpoint therapies act by blocking or stimulating these pathways to enhance the body’s immunological activity against tumours. CTLA-4,Citation17 PD-1,Citation18 and PD ligand-1(PD-L1)Citation19 are the most widely studied and recognized inhibitory checkpoint pathways. In this study, we found that TIGIT and PD-1 were dramatically highly expressed in GC and predicted poorer outcome. These findings agree with those of informatics predictions. To date, there is little literature on TIGIT expression and clinical tumour tissue samples and our study was the first to verify the expression of TIGIT in large samples of GC and adjacent tissues. CD155, the ligand of TIGIT, is barely detected in most normal tissues, but highly expressed in a series of human malignancies including colon cancer, lung adenocarcinoma, melanoma, pancreatic cancer, and glioblastoma.Citation20–Citation23 Clinicopathological analysis indicates that CD155 overexpression is correlated with tumour progression and unfavourable prognosis.
There are many important membrane molecules on the surface of T cells, which play an important role in the activation/proliferation and differentiation of T cells and the function of effector.Citation24 CD8+ T cells are the major effector cells in antitumor immunity. These cells are exhausted and rendered dysfunctional by immune checkpoints in tumour-bearing hosts.Citation25 In the present study, we demonstrate that the elevation of CD8+ TIGIT+T cells in patients with GC and reduced significantly after D2 gastrectomy. These results are consistent with those of a previous study showing that the percentage of CD8+ T cells that are TIGIT+ was dramatically increased in patients with GC and that these cells exhibited functional exhaustion and reduced metabolic activity.Citation26 Additionally, in our study, TIGIT expression on CD8+T cells was modulated by chemotherapeutic agents and high TIGIT expression following chemotherapy was associated with relapsed GC. Our results demonstrate that CD8+ TIGIT+ cells in patients GC contribute to immune dysfunction, leading to impaired antitumor immunity and accelerated tumour progression. TIGIT may represent a potential therapeutic target to enhance antitumor immunity and control GC progression.
A previous study demonstrated that following activation by its ligand TIGIT can deliver an inhibitory signal resulting in decreased T cell activation and proliferation.Citation27 The in vitro assay results revealed that the proliferation ability of CD8+ T cell was significantly increased after blocking TIGIT, and decreased by treatment with SOX alone. A combination of SOX and TIGIT blockade increased IFN-γ production in CD8+ T cells. These results indicated that TIGIT played an important role in inhibiting CD8+ T cell proliferation and cytokine production, and the combination of both treatments further inhibited tumour growth and distant metastasis, which may be the potential therapy for GC. The cytotoxicity of the SOX regimen reduced the proliferation of CD8+ TILs in the SOX regimen group more than that in the anti-TIGIT or control groups. However, in the anti-TIGIT + SOX regimen group, proliferation of CD8+ TILs was increased. However, our experiments only explored the function of TIGIT at the T cell level, and did not further explore its mechanism. A previous in vitro study reported that the TIGIT/CD226 axis regulated T cell function by cell-intrinsic and -extrinsic mechanisms.Citation27 TIGIT blockade activated metabolic pathway in CD8+T cells. The phosphorylation of the AKT/mechanistic target of rapamycin (mTOR) pathway was increased by TIGIT blockade, resulting in increased metabolism and cytokine production in CD8+ T cells.Citation27 However, this signaling was different from that previously reported where TIGIT signaled through ZAP70 and extracellular signal-regulated kinase 1/2 (ERK1/2) in NK cells.Citation28 In addition, Lu X et al evaluated the functional characteristics of Dendritic cell (DC) vaccine-induced CD8+ T cells with regard to immune checkpoint inhibitors in gastric cancer patients who were administered Wilms tumor protein-1 (WT1)-targeted DC vaccine and observed the upregulation of the inhibitory molecule, TIGIT and the inhibitory T cell co-receptors PD1 and Tim3 in limiting WT1-specific CD8+ T cell growth and function in GC patients. Thier data suggests that targeting TIGIT, PD1, and Tim3 pathways may be important in reversing immune escape in patients with advanced gastric cancer.Citation29 Therefore, TIGIT may include T cells in different cell populations, and NK cells and DC cells function to mediate cancer progression and it would be worthwhile to further study the pathways mediating the activity of TIGIT in the development of GC.
In conclusion, our findings provide insights into the clinical significance of TIGIT and PD-1 in patients with GC. It has been demonstrated that chemotherapeutic agents can reduce TIGIT expression on CD8+T cells. Because TIGIT overexpression might counteract the efficiency of chemotherapeutic agents, the combination of anti-TIGIT therapy and chemotherapy could be considered under this condition. Some other findings have also led us to seriously consider the role of TIGIT in human tumours, such as the overexpression of TIGIT on human tumour cells, involvement of some oncogenic signalling in the regulation of TIGIT expression, association of TIGIT with tumour growth and metastasis, and correlation of TIGIT expression with tumour progression and prognosis. Thus, further investigations should be conducted to determine the effect of anti-TIGIT treatment on tumours.
Materials and methods
Tissues and patients
Primary tumour tissues for immunohistochemistry (IHC) were collected from 441 patients with clinically and pathologically verified GC from Zhongda Hospital affiliated to Southeast University, Nanjing China; Nanjing First Hospital, Nanjing Medical University, Nanjing China; and Xuyi People’s Hospital, Xuyi, Jiangsu, China. All patients were followed-up for 5 years or until their death.
From March to June 2017, peripheral blood samples and tissues were collected from 23 patients with confirmed diagnosis of locally advanced GC from Zhongda Hospital affiliated to Southeast University. Peripheral blood samples were obtained 1–2 days before surgery, 3days after surgery, 3 days before and after chemotherapy, since the immune status can be expected to fluctuate immediately after surgery and then stabilized as the patient recovers over time.The eligibility criteria of patients for this study were as follows: histologically confirmed gastric adenocarcinoma, underwent extensive (D2) lymph node dissection with no residual malignant disease, and achieved R0 resection. Furthermore, none of the patients had received neoadjuvant chemotherapy or radiotherapy before surgery. GC cases with infection and autoimmune diseases were excluded. Additionally, the patients were required to possess favourable bone marrow reservation (haemoglobin ≥ 80 g/L, platelet count ≥ 100 × 109, leukocyte count = 3 to 10 × 109, and neutrophil count ≥1.5 × 10⁹). Laboratory examinations showed adequate liver function (total bilirubin ≤ 1.5 times the upper limit, alanine transaminase/aspartate transaminase (ALT/AST) ≤ 2.5 times the upper limit) and renal function (blood creatinine ≤ 1.5 mg/dL, creatinine clearance ≥ 50 mL/min). Furthermore, Karnofsky Performance Status (KPS) scores were expected to be ≥ 60 points. Peripheral blood samples from eight healthy volunteers (HV) were used as controls. This study was approved by the Medical Ethics Committee of Zhongda Hospital. Consent was informed and forms were obtained from every patient. After surgery, following up time was 12 months or till the occurrence of relapse.
Immunohistochemistry
To detect CD8+, PD-1+, and TIGIT+ in tissues, 4 μm sections of the whole tumour tissue samples were deparaffinized and subjected to heat-induced epitope retrieval. Tissue sections were stained with anti-CD8α (#85336S, CST), anti-PD-1 (#84163S, CST), and anti-TIGIT (#ab233404, Abcam). Staining intensity was scored based on the following scale: 0, absent or staining in < 10% positive cells; 1+, staining in 10 to 20% of tumour cells; 2+, staining in 20 to 50% of tumour cells; 3+, staining > 50% of tumour cells. The immunostaining assessment was conducted by two independent pathologists. The low group was further defined as low (0) or weak staining of TIGIT or PD-1 immunoreactivity (1+). The positive group was defined as having moderate (2+) or high (3+) levels of TIGIT or PD-1 immunoreactivity. According to the scores, the groups were further defined as low group (scores 0–1) and high group (scores 2–3) TIGIT and PD-1 expression, respectively.Staining intensity <10% 10–20% is shown as low expression, and staining intensity 20–50% and >50% is shown as high expression.
Chemotherapy regimen and cell isolation
Oxaliplatin and S-1 were obtained from Zhongda Hospital. For patients, oxaliplatin (85 mg/m2) was administered intravenously on day 1. S-1 (80 mg/(m2•day)) was administered orally twice daily for 14 days. All patients were then allowed 1 week of rest before the next cycle. Physical examination and blood analysis were performed at each cycle during chemotherapy and six cycles were administered to all patients.
Peripheral blood samples were obtained from patients pre- and post-operative and before and after the first or sixth cycle of chemotherapy. Peripheral blood samples from HVs were used as controls. Peripheral blood mononuclear cells (PBMC) were isolated with Ficoll plaque plus (#17144002, GE) using density gradient centrifugation within 2 h of sample collection. CD8+ TIL Cells were isolated from GC tissues using a human CD8+ T cell isolation kit (#17953, Stemcell) following the manufacturer’s instructions.
Flow cytometry
PBMCs isolated from patients with GCs or HVs were stained with the following antibodies: APC-Cy7 mouse anti-human CD8 (#555369, BD Biosciences), PE mouse anti-human PD-1 (# 563422, BD Biosciences), and PerCP-Cy5.5 mouse anti-human TIGIT (VSTM3, #372718, BioLegend). The molecular phenotypes of peripheral blood leucocytes were analysed immediately using flow cytometry (BD FACS Canto™ II). Samples were analysed using the FlowJo V10 (Tree Star) software.
Immunofluorescence staining
A coverslip was placed in each well of a 12-well plate and the cells were cultured in culture media to approximately 50% proliferation. Then medium was aspirated from plates, which were washed twice with phosphate-buffered saline (PBS). Cells were fixed with 4% paraformaldehyde (PFA) for 30 min at 25°C, washed with PBS three times, and then they were treated with PBS-0.2% Triton-X100 for 10 min. After blocking for 1 h with PBS containing 10% donkey serum, cells were stained with primary antibody (1:1000, #180191Z, rabbit anti-Ki-67, Invitrogen) diluted with PBS containing 10% donkey serum and 0.2% Triton-X100 by forming a drop on the coverslip at 4°C overnight. On the second day, after washing for 10 min three times with PBS, cells were stained with conjugated secondary antibody (1:1000, rabbit IgG, Life Technologies, A21206) diluted with 10% donkey serum for 1 h at room temperature. The coverslip was mounted with Fluoromount-G (Southern Biotech, 0100–01) for fluorescent imaging. Images were acquired using an Eclipse 80i fluorescence microscope.
Cell viability analysis
CD8+ TIL Cells were cultured in Roswell Park Memorial Institute (RPMI)-1640 medium supplemented with 10% FBS at 37°C with 5% CO2 for 24 h. Then, 3-[4,5-dimethylthythiazol-2-yl]-2,5-diphenyltetrazolium bromide (MTT) assays were carried out to assess the half-maximal inhibitory concentration (IC50) of SOX against the cells, as previously describedCitation30
T cell function assay
CD8+ TIL Cells were divided into the control, SOX-treated, anti-TIGIT-treated (#71340, 5 ug/mL, BPS Biosciences), and SOX + anti-TIGIT-treated groups. For the proliferation assay, CD8+ TIL Cells were seeded on 12-well plates and stimulated with anti-CD3 (#16–0038-81,Thermo)/CD28 (#16–0289-81,Thermo) at 37°C exposed to 5% CO2 to approximately 50% proliferation. Immunofluorescence staining was then conducted to measure KI-67 expression to detect the proliferation of CD8+T cell.
For intracellular cytokine stimulation assays, CD8+ TIL Cells were treated with SOX or anti-TIGIT at 37°C with 5% CO2 for 24 h. Cells were harvested and stimulated with 4 µL/mL PMA/ionomycin/BFA/monensin mixture (250×, #70-CS1003, MultiSciences Biotech Co., Ltd, China) for 5 h at 37°C with 5% CO2. The cells were fixed and permeabilized using the FOXP3/transcription factor staining buffer set (#00–5523-00, Thermo) for 30 min, and were then collected and stained with APC-Cy7 mouse anti-human CD8 (#555369, BD Biosciences) and PE anti-interferon (IFN)-γ antibody (#502509, Biolegend).
GEPIA and kaplan-meier plotter database analysis
For Kaplan-Meier Plotter database,gene expression data and relapse free and overall survival information are downloaded from GEO (Affymetrix microarrays only), EGA and TCGA. To analyze the prognostic value of a particular gene, the patient samples are split into two groups according to various quantile expressions of the proposed biomarker.Citation31 For GEPIA,it is a newly developed interactive web server for analyzing the RNA sequencing expression data of 9,736 tumors and 8,587 normal samples from the TCGA and the GTEx projects, using a standard processing pipeline.GEPIA provides customizable functions.Citation32
Statistical analysis
The data are presented as the means ± standard error of the mean (SEM). Statistical analysis and graphic presentation were carried out using the GraphPad Prism version 5.0 (GraphPad Software, San Diego, CA, USA). Survival analysis was performed using Kaplan-Meier plots and log-rank tests. A t-test was used if a normality test was passed; otherwise, the nonparametric Mann- [81572906]; Whitney test was used to analyse the data. Similarly, the Pearson method or the nonparametric Spearman method was used for the correlation analysis. Different cut-off values, *P < 0.05, *P < 0.01, and ***P < 0.001 were considered significant.
Abbreviations
| GC | = | Gastric cancer |
| TIGIT | = | T cell immunoreceptor with Ig and ITIM domains |
| PD-1 | = | programmed cell death protein1 |
| SOX | = | S-1 plus oxaliplatin |
| TILs | = | tumour-infiltrating lymphocytes |
| CTLA-4 | = | cytotoxic T-lymphocyte associated protein 4 |
| MDSC | = | myeloid derived suppressor cells |
| OS | = | overall survival |
Ethics approval and consent to participate
The human cancer tissues used in this study were approved by the Ethics Committee of Nanjing First Hospital, Nanjing Zhongda Hospital and Xuyi People’s Hospital.
Consent for publication
We have received consents from individual patients who have participated in this study.
Competing interests
The authors declare that they have no competing interests.
Supplemental Material
Download MS Word (2.4 MB)Supplementary Material
Supplemental data for this article can be accessed on the publisher’s website.
Additional information
Funding
Related Research Data
References
- Ferlay J, Soerjomataram I, Dikshit R, Eser S, Mathers C, Rebelo M, Parkin DM, Forman D, Bray F. Cancer incidence and mortality worldwide: sources, methods and major patterns in GLOBOCAN 2012. Int J Cancer. 2015;136:E359–86. doi:10.1002/ijc.29210.
- Gallo A, Cha C. Updates on esophageal and gastric cancers. World J Gastroenterol. 2006;12:3237–3242.
- Satake H, Miki A, Kondo M, Kotake T, Okita Y, Hatachi Y, Yasui H, Imai Y, Ichikawa C, Murotani K, et al. Phase I study of neoadjuvant chemotherapy with S-1 and oxaliplatin for locally advanced gastric cancer (Neo G-SOX PI). ESMO Open. 2017;2:e000130. doi:10.1136/esmoopen-2016-000130.
- Borghaei H, Paz-Ares L, Horn L, Spigel DR, Steins M, Ready NE, Chow LQ, Vokes EE, Felip E, Holgado E, et al. Nivolumab versus Docetaxel in advanced nonsquamous non-small-cell lung cancer. N Engl J Med. 2015;373:1627–1639. doi:10.1056/NEJMoa1507643.
- Wherry EJ. T cell exhaustion. Nat Immunol. 2011;12:492–499.
- Dougall WC, Kurtulus S, Smyth MJ, Anderson AC. TIGIT and CD96: new checkpoint receptor targets for cancer immunotherapy. Immunol Rev. 2017;276:112–120. doi:10.1111/imr.12518.
- Nowak AK, Robinson BWS, Lake RA. Synergy between chemotherapy and immunotherapy in the treatment of established murine solid tumors. Cancer Res. 2003;63:4490–4496.
- Wan S, Pestka S, Jubin RG, Lyu YL, Tsai Y-C, Liu LF, Fernandez-Sesma A. Chemotherapeutics and radiation stimulate MHC class I expression through elevated interferon-beta signaling in breast cancer cells. PLoS One. 2012;7:e32542. doi:10.1371/journal.pone.0032542.
- Ghiringhelli F, Larmonier N, Schmitt E, Parcellier A, Cathelin D, Garrido C, Chauffert B, Solary E, Bonnotte B, Martin F. CD4+CD25+ regulatory T cells suppress tumor immunity but are sensitive to cyclophosphamide which allows immunotherapy of established tumors to be curative. Eur J Immunol. 2004;34:336–344. doi:10.1002/eji.200324181.
- Bruchard M, Mignot G, Derangère V, Chalmin F, Chevriaux A, Végran F, Boireau W, Simon B, Ryffel B, Connat JL, et al. Chemotherapy-triggered cathepsin B release in myeloid-derived suppressor cells activates the Nlrp3 inflammasome and promotes tumor growth. Nat Med. 2013;19:57–64. doi:10.1038/nm.2999.
- Salgado R, Denkert C, Demaria S, Sirtaine N, Klauschen F, Pruneri G, Wienert S, Van Den Eynden G, Baehner FL, Penault-Llorca F, et al. The evaluation of tumor-infiltrating lymphocytes (TILs) in breast cancer: recommendations by an International TILs Working Group 2014. Ann Oncol. 2015;26:259–271. doi:10.1093/annonc/mdu450.
- Idorn M, Thor SP. Chemokine receptors and exercise to tackle the inadequacy of T cell homing to the tumor site. Cells. 2018;7:108. doi:10.3390/cells7080108.
- Yu X, Harden K, Gonzalez LC, Francesco M, Chiang E, Irving B, Tom I, Ivelja S, Refino CJ, Clark H, et al. The surface protein TIGIT suppresses T cell activation by promoting the generation of mature immunoregulatory dendritic cells. Nat Immunol. 2009;10:48–57. doi:10.1038/ni.1674.
- Manieri NA, Chiang EY, Grogan JL. TIGIT: a key inhibitor of the cancer immunity cycle. Trends Immunol. 2017;38:20–28. doi:10.1016/j.it.2016.10.002.
- Chauvin J-M, Pagliano O, Fourcade J, Sun Z, Wang H, Sander C, Kirkwood JM, Chen T-HT, Maurer M, Korman AJ, et al. TIGIT and PD-1 impair tumor antigen-specific <sup>CD8+ T cells in melanoma patients. J Clin Invest. 2015;125:2046–2058. doi:10.1172/JCI80445.
- McCoy MJ, Lake RA, Van Der Most RG, Dick IM, Nowak AK. Post-chemotherapy T-cell recovery is a marker of improved survival in patients with advanced thoracic malignancies. Br J Cancer. 2012;107:1107–1115. doi:10.1038/bjc.2012.362.
- Beavis PA, Henderson MA, Giuffrida L, Davenport AJ, Petley EV, House IG, Lai J, Sek K, Milenkovski N, John LB, et al. Dual PD-1 and CTLA-4 checkpoint blockade promotes antitumor immune responses through CD4+Foxp3− cell-mediated modulation of CD103+ dendritic cells. Cancer Immunol Res. 2018;6:1069–1081. doi:10.1158/2326-6066.CIR-18-0291.
- Bylicki O, Paleiron N, Rousseau-Bussac G, Chouaïd C. New PDL1 inhibitors for non-small cell lung cancer: focus on pembrolizumab. Onco Targets Ther. 2018;11:4051–4064. doi:10.2147/OTT.S154606.
- Thompson ED, Zahurak M, Murphy A, Cornish T, Cuka N, Abdelfatah E, Yang S, Duncan M, Ahuja N, Taube JM, et al. Patterns of PD-L1 expression and CD8 T cell infiltration in gastric adenocarcinomas and associated immune stroma. Gut. 2017;66:794–801. doi:10.1136/gutjnl-2015-310839.
- Masson D, Jarry A, Baury B, Blanchardie P, Laboisse C, Lustenberger P, Denis MG. Overexpression of the CD155 gene in human colorectal carcinoma. Gut. 2001;49:236–240. doi:10.1136/gut.49.2.236.
- Bevelacqua V, Bevelacqua Y, Candido S, Skarmoutsou E, Amoroso A, Guarneri C, Strazzanti A, Gangemi P, Mazzarino MC, D’Amico F, et al. Nectin like-5 overexpression correlates with the malignant phenotype in cutaneous melanoma. Oncotarget. 2012;3:882–892. doi:10.18632/oncotarget.594.
- Sloan KE, Eustace BK, Stewart JK, Zehetmeier C, Torella C, Simeone M, Roy JE, Unger C, Louis DN, Ilag LL, et al. CD155/PVR plays a key role in cell motility during tumor cell invasion and migration. BMC Cancer. 2004;4:73. doi:10.1186/1471-2407-4-73.
- Nishiwada S, Sho M, Yasuda S, Shimada K, Yamato I, Akahori T, Kinoshita S, Nagai M, Konishi N, Nakajima Y. Clinical significance of CD155 expression in human pancreatic cancer. Anticancer Res. 2015;35:2287–2297.
- Crunkhorn S. Cancer immunotherapy: targeting regulatory T cells. Nat Rev Drug Discov. 2017;16:754.
- Durgeau A, Virk Y, Corgnac S, Mami-Chouaib F. Recent advances in targeting CD8 T-cell immunity for more effective cancer immunotherapy. Front Immunol. 2018;9:14. doi:10.3389/fimmu.2018.00014.
- He W, Zhang H, Han F, Chen X, Lin R, Wang W, Qiu H, Zhuang Z, Liao Q, Zhang W, et al. CD155T/TIGIT signaling regulates CD8+ T-cell metabolism and promotes tumor progression in human gastric cancer. Cancer Res. 2017;77:6375–6388. doi:10.1158/0008-5472.CAN-17-0381.
- Lozano E, Dominguez-Villar M, Kuchroo V, Hafler DA. The TIGIT/CD226 axis regulates human T cell function. J Immunol. 2012;188:3869–3875. doi:10.4049/jimmunol.1103627.
- El-Sherbiny YM, Meade JL, Holmes TD, McGonagle D, Mackie SL, Morgan AW, Cook G, Feyler S, Richards SJ, Davies FE, et al. The requirement for DNAM-1, NKG2D, and NKp46 in the natural killer cell-mediated killing of myeloma cells. Cancer Res. 2007;67:8444–8449. doi:10.1158/0008-5472.CAN-06-4230.
- Lu X, Liu J, Cui P, Liu T, Piao C, Xu X, Zhang Q, Xiao M, Liu X, Wang Y, et al. Co-inhibition of TIGIT, PD1, and Tim3 reverses dysfunction of Wilms tumor protein-1 (WT1)-specific CD8+ T lymphocytes after dendritic cell vaccination in gastric cancer. Am J Cancer Res. 2018;8:1564–1575.
- Hwang SH, Jung SH, Lee S, Choi S, Yoo S-A, Park J-H, Hwang D, Shim SC, Sabbagh L, Kim K-J, et al. Leukocyte-specific protein 1 regulates T-cell migration in rheumatoid arthritis. Proc Natl Acad Sci U S A. 2015;112:E6535–43. doi:10.1073/pnas.1514152112.
- Lanczky A, Nagy A, Bottai G, Munkácsy G, Szabó A, Santarpia L, Győrffy B. miRpower: a web-tool to validate survival-associated miRNAs utilizing expression data from 2,178 breast cancer patients. Breast Cancer Res Treat. 2016;160(3):439–446. doi:10.1007/s10549-016-4013-7.
- Tang Z, Li C, Kang B, Gao G, Li C, Zhang Z. GEPIA: a web server for cancer and normal gene expression profiling and interactive analyses. Nucleic Acids Res. 2017;45:W98–W102. doi:10.1093/nar/gkx247.