
ABSTRACT
Mice reconstituted with a human immune system and bearing human tumors represent a promising model for developing novel cancer immunotherapies. Here, we used mass cytometry and multi-parametric flow cytometry to characterize human leukocytes infiltrating a human breast cancer tumor model in immunocompromised NOD.SCID.γc-null mice reconstituted with a human immune system and compared it to samples of breast cancer patients. We observed highly activated human CD4+ and CD8+ T cells in the tumor, as well as minor subsets of innate immune cells in both settings. We also report that ICOS+ CD4+ regulatory T cells (Treg) were enriched in the tumor relative to the periphery in humanized mice and patients, providing a target to affect Treg and tumor growth. Indeed, administration of a neutralizing mAb to human ICOS reduced Treg proportions and numbers and improved CD4 + T cell proliferation in humanized mice. Moreover, a combination of the anti-ICOS mAb with cyclophosphamide reduced tumor growth, and that was associated with an improved CD8 to Treg ratio. Depletion of human CD8+ T cells or of murine myeloid cells marginally affected the effect of the combination therapy. Altogether, our results indicate that a combination of anti-ICOS mAb and chemotherapy controls tumor growth in humanized mice, opening new perspectives for the treatment of breast cancer.
One sentence summary: Targeting ICOS in combination with chemotherapy is a promising strategy to improve tumor immunity in humans.
Introduction
Preventing immune suppression in tumors is the “next frontier” in immuno-oncology research. Despite recent success of anti-PD-1 mAbs for metastatic melanomas and other cancers, it seems reasonable to propose that combination therapy will be key to the success of cancer immunotherapy, as suggested in patients receiving a combination of anti-PD-1 and anti-CTLA-4.Citation1 Likely, the most efficient combinations will emerge from the ever-growing list of mechanisms that prevent an efficient immune response to the tumor. Recently, a murine study combining a tumor-targeting mAb, a recombinant cytokine, an anti-PD-1 mAb, and a T cell vaccine achieved a remarkable efficacy at clearing large established syngeneic tumors,Citation2 illustrating the power of combinations for T-cell and innate cell-mediated tumor control. However, studies purely performed in syngeneic models are only useful to gain biological insights but are not relevant to validate mAbs or drugs selectively targeting human cells. Therefore, a mouse model in which the impact of human-specific mAbs on tumor control could be tested would be most invaluable.
It has been shown that human breast tumor morphology and metastatic properties were conserved in xenografted immunodeficient mice.Citation3,Citation4 This was also shown for ovarian cancersCitation5 and later confirmed for melanomas,Citation6 suggesting that a large panel of human tumors engrafts efficiently in immunodeficient mice and reproduces features of clinical progression. Xenograft models might be useful to target human tumors, but these immunodeficient models are not relevant to test drugs that target the human immune system, the very definition of immunotherapy. Mice carrying a human immune system (HuMice) and human tumors could, therefore, represent a relevant model for cancer immunotherapy research, at the interface of mice and humans.Citation7 Most of the literature regarding the use of HuMice for immuno-oncology relies on the direct transfer of total PBMC into immunodeficient mice of various genetic backgrounds. Therapeutic efficacy of a combination of an anti-PD-1 and an anti-4–1-BB mAbs has been demonstrated in a model in which the tumor and the PBMC were from the same patient.Citation8 However, PBMC-implanted mice invariably and rapidly suffer from Graft vs Host Disease (GVHD), which complicate the interpretation of the results and limits the duration of the experiments. To preclude this problem, NOD.SCID.gamma-c-null (NSG) immunodeficient mice can be reconstituted with human CD34+ hematopoietic progenitors,Citation9 most often isolated from cord blood. Because we demonstrated that a pool of human T cells with a diverse repertoire was then generated,Citation10 it became feasible to assess combination therapy targeting human tumors and/or human T cells in vivo, generating results in a setting closer to human physiology than syngeneic murine models. However, there is still a lack of information on the composition and the function of human leukocytes infiltrating human tumors in CD34-reconstituted HuMice. Indeed, very few studies have evaluated the nature of human leukocytes in these models.Citation11–Citation15 Activated T cells in the tumor were observed in a peculiar model of tumor implantation at birth in NSG HuMice that did not lead to tumor rejection.Citation11 A more advanced model of HuMice (MISTRG) was used to decipher the contribution of the innate immune system to tumor control, but the presence of T cells in the tumor was not reported.Citation13 Very few T cells were detected in a Patient-Derived Xenograft (PDX) HuMice model of head and neck squamous cell carcinomas.Citation14 Likewise, very few T cells were detected in breast cancer-bearing NSG HuMice with myeloid cells being the subset the most represented in the tumor.Citation12 Finally, a recent study described the presence of Treg in the tumor of NSG HuMice but a precise quantification of T cells and their associated phenotype was not reported.Citation15 Thus, the presence of human T cells in tumors of HuMice is still open to debate. This is a crucial question to be answered if one wants to use the model in a reliable and relevant way. To document this question, we used cytometry Time-of-flight (CyTOF) (or mass cytometry) allowing quantification of the expression of 30 to 40 proteins at the same time at the single cell level, a very useful feature when analyzing samples containing a limited number of cells. When compared to the immune landscape of breast cancer patients, several conserved features were observed. Among those, the Inducible COStimulatory molecule (ICOS) emerged in both patients and HuMice as an eligible marker to target Tregs, a crucial T cell subset dampening the anti-tumoral immune response. Here, we provide the first proof-of-principle that a combination of chemotherapy and neutralizing anti-ICOS mAb leads to reduced tumor growth in HuMice, opening the possibility to translate this combination into the clinics.
Results
T cell infiltrate in the tumors of HuMice
The general design of our study is represented in . Irradiated NSG newborns were injected in the liver with cord blood CD34+ cells. After 16 to 20 weeks, mice were grafted s.c with MDA-MB-231 human breast cancer cells. After 30 to 40 days of tumor growth follow-up, mice were euthanized and the spleen and tumors were analyzed by mass cytometry. The CyTOF panel was designed to include the most common lineage markers for murine and human leukocytes in order to get a global picture of the immune infiltrate and also incorporated several activations and proliferation markers of human T lymphocytes (Table S1).
Figure 1. Distribution of human and murine leukocytes in HuMice and in breast cancer patients. (a) Experimental scheme of the study, as detailed in the text. (b) viSNE representation of gated human CD45+ cells in the spleen and the tumor of HuMice from a representative experiment. The viSNE plot was generated according to NKp46, CD38, CD33, CD45RO, PD-1, CD4, CD8, CD20, CD25, Grz-B, and HLA-DR expression using proportional sampling with 54422 events in the spleen and 10274 events in the tumor. The level of expression of each of the indicated markers is represented by a color scale on the right. (c) Frequencies of the indicated subsets were determined in HuMice by supervised 2D-gating from CyTOF data and in patients by multi-parametric flow cytometry. Each dot represents a mouse from four independent experiments or a patient in individual experiments. The horizontal line represents the mean value. The p-values indicated in the figures are from non-parametric two-tailed Mann–Whitney t-test.
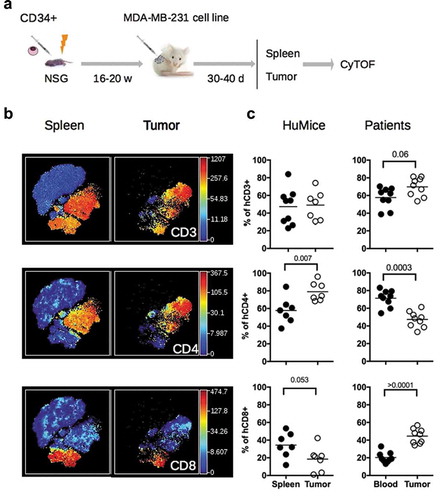
We first compared the frequencies of human and murine cells of the hematopoietic lineage (CD45+) in the spleen and in the tumor in four independent experiments, totalizing 15 CD34-reconstituted NSG mice. Within human cells, a classical 2D analysis of the CyTOF data revealed the presence of CD20+ B cells and CD3+ T cells (CD4+ and CD8+) in the spleen and the tumor, although B cells tended to disappear from the tumor (Fig. S1A). To get a deeper insight into the nature of immune cells present in the tumor, we performed unsupervised clustering of the data using the tSNE algorithm. This algorithm reduces the multidimensional nature of mass cytometry data to a 2D representation, in which each dot is a cell, clustered according to the level of expression of chosen markers.Citation16 We first focused our analysis on manually gated hCD45+ and ran the tSNE algorithm based on lineage and activation markers. Clusters of CD3+, CD4+, and CD8+ cells were readily detected with that method (). To compare the distribution of human leukocytes in HuMice to human samples, we determined the distribution of human leukocytes in the blood and tumors of nine breast cancer patients by regular flow cytometry (). The mean frequencies of CD3+ T cells were similar in HuMice and patients in the tumor, representing around 50–60% of the total CD45+ cells. In contrast, the frequencies of CD4+ T cells were higher and the frequencies of CD8 + T cells were lower in the tumor of HuMice compared to patients. Thus, the MDA-MB-231 cell line was indeed infiltrated by human T cells in CD34-reconstituted HuMice, albeit the ratio of CD4 to CD8 T cells was different than in patients.
Innate immune cells in the tumors of HuMice
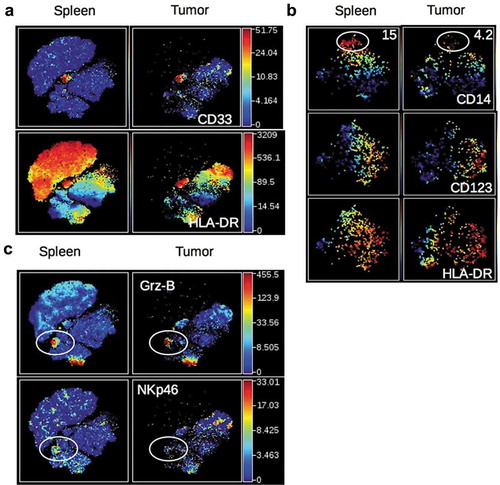
We next investigated the nature of non-CD19, non-CD3-expressing human cells in the same t-SNE analysis. A distinct cluster of CD33+ HLA-DR+ cells was observed in the spleen and tumor of HuMice (). Zooming on CD33+ cells, two distinct populations of CD14+HLA-DRlo and CD123+HLA-DRhi cells further segregated, most likely representing monocytes and plasmacytoid dendritic cells (pDCs) precursors, since pDC precursors and mature pDCs differ by CD33 expressionCitation17 (). A subset of CD33+ cells not expressing CD14 nor CD123, and heterogeneous for HLA-DR were enriched in the tumor, likely including classical DCs (cDC). In addition, two clusters of Granzyme-B-expressing cells (Grz-B+) were observed in the spleen and the tumor (): one expressed CD8 and CD3 () and thus represented CTL, while the others expressed CD335 (NKp46) () but not CD3 () and thus represented NK cells. In this later cluster, NKp46 expression was lower in the tumor than in the spleen. Thus, in addition to CD4+ and CD8+ T cells, the immune landscape of tumors in CD34-HuMice also included monocytes, pDC, cDC, and NK cells, albeit in small proportions and not in all HuMice. A similar analysis of human patients was not available.
Figure 2. Detection of human myeloid cells and NK cells in HuMice. (a) The viSNE plot was generated as in and represents the expression of CD33 and HLA-DR in hCD45+ cells of the spleen and tumor. (b) The viSNE plots were generated in gated hCD45+CD33+ cells according to CD14, CD45RO, CD123, CD4, CD11b and HLA-DR expression using proportional sampling with 535 cells in the spleen and 476 events in the tumors. Indicated on the plots are the frequencies of CD14-expressing cells in the CD33+ cluster. (c) The visNE plots were generated as in and represent the expression of Granzyme-B (Grz-B) and NKp46 in the spleen and the tumor. Gates highlight the localization of putative NK cells.
To gain information on the murine infiltrate, the same unsupervised representation of the data was performed on gated mCD45+ cells (Fig. S1B). As expected from NSG mice, which are deprived of all lymphoid lineages, most mCD45+ cells expressed CD11b in the spleen and the tumor (Fig. S1C). Clusters of Ly-6C+ monocytes, Ly6-G+ neutrophils, and CD11c+ DC were readily observed in the spleen and the tumor (Fig. S1C). Overall, myeloid cells of NSG mice were similarly represented in the spleen and the tumor, with the exception of Ly6G+ neutrophils which were less abundant in the tumor (Fig. S1D).
Activated/memory T cells in tumors of HuMice
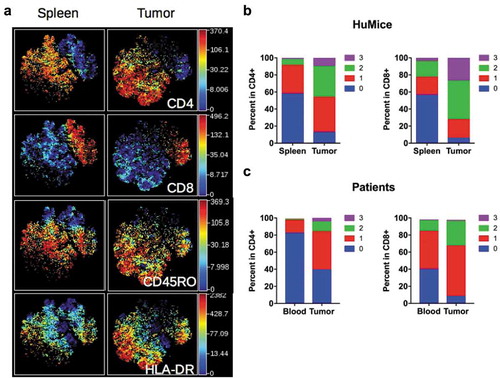
Having established unambiguously that tumors in HuMice contained human T cells, we next investigated the activation status of those cells. We performed a t-SNE analysis on manually gated human CD3+ T cells, allowing visualization of two main clusters of CD4+ and CD8+ T cells (). When activation/memory and functional markers such as CD45RO, HLA-DR, PD-1, CD25 or Grz-B were considered, we noticed a general increase in the frequencies of cells positive for those markers in the tumor relative to the spleen for both CD4+ and CD8+ cells, a first indication that T cells were activated in the tumor environment. Up-regulation of CD45RO and HLA-DR expression was observed in both CD4+ and CD8+ subsets, whereas higher PD-1 and CD25 expression was noted among CD4+ T cells. As expected, up-regulation of Grz-B expression was restricted to CD8+ T cells (Fig. S2A). To determine the activation status of human T cells more precisely, we performed a boolean analysis calculating the frequencies of cells expressing 0, 1, any combination of two or all three above-mentioned activation markers in CD4+ and CD8+ T cells. Results depicted in show that the frequencies of CD4+ or CD8+ cells co-expressing two or three activation markers were vastly increased in the tumor, while frequencies of T cells expressing none of the activation markers were drastically reduced. Despite this massive activation, the frequencies of proliferating Ki-67+ cells co-expressing three activation markers were lower in tumors relative to the spleen (Fig. S2B), although this did not reach statistical significance by a two-way ANOVA. Importantly, a similar enrichment for activated/memory T cells was observed in the tumor relative to the blood in breast cancer patients, assessed by the co-expression of two or three activation/memory markers (). Thus, tumor-infiltrating T cells were of an activated/memory phenotype in both HuMice and breast cancer patients. Of note, PD-1 expression was correlated with a higher proliferation of CD4+ and CD8+ T cells in the spleen of HuMice. In contrast, it was inversely correlated with the proliferation of CD4+ but surprisingly not of CD8+ T cells in the tumor (Fig S2C-E), appearing as an exhaustion marker only for CD4+ T cells.
Figure 3. Activation status of Tumor-infiltrating T cells of HuMice and breast cancer patients. (a) hCD45+CD3+ from HuMice were gated in Cytobank and a viSNE plot was generated according to CD4, CD8, CD45RO, HLA-DR, PD-1, CD25, Ki-67 and GrzB expression using equal sampling with 8574 events in the spleen and tumor. (b) Mean frequencies of cells expressing 0, 1, any combination of two or all three activation/memory markers are shown in the indicated tissue. Activation/memory markers used for boolean analysis were CD25, HLA-DR, and PD-1 for CD4+ T cells and HLA-DR, Grz-B, and CD45RO for CD8+ T cells. Results are from one experiment out of three. (c) Same analysis for T cells from breast cancer patients. Results are mean frequencies in nine breast cancer patients in nine independent experiments in the blood and the tumor determined by flow cytometry. The activation markers used for boolean analysis were HLA-DR, ICOS, and PD-1 for CD4+ T cells and CD45RA, Grz-B and HLA-DR for CD8+ T cells (negativity for CD45RA was considered as an activated/memory phenotype).
Increased expression of ICOS on regulatory T cells in tumors
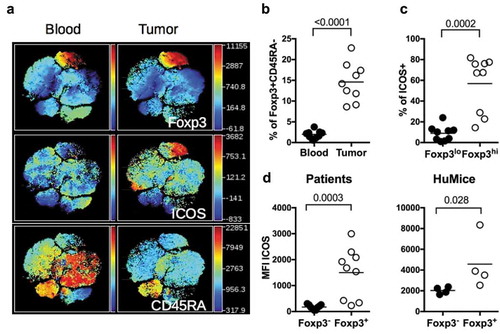
Effector Treg is defined by high expression of the transcription factor FOXP3 and the IL-2R-alpha chain CD25, and by the lack of CD45RA expression.Citation18 They are important actors of immunosuppression in the tumors of human patients. It has also been shown that ICOS/ICOS-L interaction can regulate Treg functions in humansCitation19 and that ICOS expression is linked to Treg-mediated immunosuppression in breast cancer patients.Citation20,Citation21 Furthermore, ICOS expression was associated with poor prognosis in breast cancer patients due to its promoting action on Treg.Citation21,Citation22 A distinct cluster of CD4+ cells expressing FOXP3, high levels of ICOS and negative for CD45RA, representing effector Treg was clearly visible in the tumor whereas it was absent in the blood in a patient (). This cluster was represented at higher frequencies in breast tumors compared to blood in nine patients (). It has been shown in humans that CD4+FOXP3+CD45RAneg cells might include activated effector T cells with lower FOXP3 expression than effector Treg.Citation18 We observed that the frequencies of ICOS+ cells were higher in FOXP3hi cells than in FOXP3lo cells in the tumor (), suggesting that CD4+CD45RAnegFOXP3hiICOS+ cells represented bona fide effector Treg. The higher expression of ICOS on Treg of the tumor was also documented by an increase in the MFI of ICOS in FOXP3+ vs. FOXP3neg cells (). Importantly, a similar increase was observed in the tumors of HuMice (), showing that overexpression of ICOS by Treg in human tumors was recapitulated in HuMice. We thus surmise that ICOS could represent a suitable target to affect Treg, with a possible impact on tumor growth, a testable hypothesis in HuMice.
Figure 4. ICOS expression by Treg in HuMice and breast cancer patients. (a) viSNE plot of hCD45+ from a representative breast cancer patient showing FOXP3, ICOS and CD45RA expression in the blood and the tumor, determined by flow cytometry. (b) Frequencies of FOXP3+CD45RAneg cells in the indicated tissue from breast cancer patients among CD4+CD3+ cells. (c) Frequencies of ICOS+ cells in FOXP3lo or FOXP3hi CD4+CD45RAneg in the tumor of breast cancer patients. (d) MFI of ICOS in CD3+CD4+Foxp3− or CD3+CD4+Foxp3+ in the tumor of breast cancer patients or in the tumor of HuMice. The horizontal line represents the mean value. Each dot represents a patient or a mouse. The p values indicated on the graphs are from non-parametric two-tailed Mann–Whitney t-test.
Impact of anti-ICOS on Treg in HuMice
To test the hypothesis that ICOS/ICOS-L neutralization might affect Treg in vivo, we injected once an anti-hICOS mAb, reported as neutralizing in vitroCitation21 in tumor-bearing HuMice and determined the frequencies of Treg in the spleen and the tumor 30 days after (). Regular flow cytometry was performed to determine frequencies of FOXP3+ICOS+ and FOXP3+CD25+ cells following treatment. There was a statistically significant effect of the treatment on the proportions of FOXP3+ICOS+ cells (p = 0.0027) and of FOXP3+CD25+ cells (p = 0.0039) in the tissues using two-way ANOVA. Taking into account multiple comparisons with corrected p-values, the treatment led to a statistically significant reduction in the frequencies of FOXP3+ cells expressing CD25 or ICOS in the spleen of HuMice and a similar tendency was observed in the tumor (). Moreover, the anti-ICOS mAb treatment was associated with the increased proliferation of total CD4+ but not CD8+ T cells in the spleen (). The treatment also affected the absolute numbers of total T cells in the spleen but that did not reach statistical significance. In contrast, Treg counts were significantly reduced by the treatment with numbers dropping almost 20-fold (). Thus, the anti-ICOS mAb led to a significant reduction of FOXP3+ cells in treated animals and also improved the proliferation of CD4+ T cells.
Figure 5. Impact of anti-ICOS mAb on Treg in humanized mice. (a) Frequencies of FOXP3+ICOS+ or FOXP3+CD25+ cells in CD4+CD3+ T cells and of (b) Ki-67+ cells in CD3+ T cells in the spleen and tumor of HuMice injected with isotype control (Iso) or anti-ICOS mAb (50µg/mouse). Results shown are cumulative of at least three independent experiments. Only high expressing cells were gated. The p-values reported on the graph are from a two-way ANOVA with multiple comparisons test corrected by the Sidak method. (c) Absolute numbers of total T cells (CD3+) or Treg (FOXP3+CD25+) were based on absolute counts of the spleen of HuMice treated with isotype control (Iso) or anti-ICOS mAb. Each dot represents a mouse. Fold change in mean numbers is indicated on the right. The p-values indicated on the graphs are from an unpaired two-tailed non-parametric Kolgomorov–Smirnov t-test. Data are cumulative of at least three independent experiments. The horizontal line represents the mean value.
Combination of chemotherapy and anti-ICOS to control tumor growth in HuMice
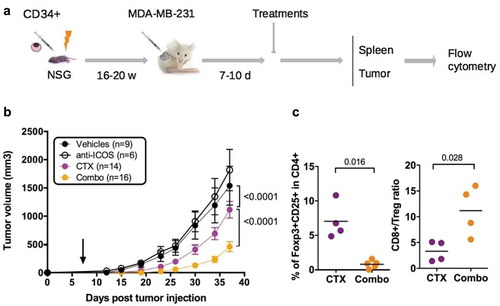
To evaluate the impact of the mAb on tumor growth, we dispatched HuMice with similar T cell reconstitution prior the initiation of the experiments (Fig. S3) into a pre-clinical-like trial with random assignments into groups, blinded evaluation, mixed sex ratio, and sufficient number of animals to detect the observed effect with enough statistical power (the experimental scheme is summarized in ). Despite the clear reduction in Treg and CD4+ T cells reported above, the anti-ICOS mAb injected alone at day 7 post-tumor implantation had no effect on tumor growth (). We thus reasoned that combining the anti-ICOS mAb with a known inducer of immunogenic cell death (ICD) might be more efficient, as shown in syngeneic murine models with anti-CTLA-4 or anti-PD-1 mAbs.Citation23 Cyclophosphamide (CTX) is widely used as a chemotherapy for treatment of breast cancer for its cytostatic properties, and has also been described as a potent inducer of ICD and may affect Treg as well.Citation24 Indeed, CTX at a dose of 3 mg per mouse completely abolished tumor growth in non-humanized NSG mice, whereas a dose of 1.5 mg per mouse only moderately affected tumor growth in non-humanized (Fig. S4A) and HuMice alike (), associated to reduced proportions of Treg in treated animals (Fig. S4B). The combination of the anti-ICOS mAb and CTX injected at day 7 post tumor implantation profoundly reduced tumor growth in HuMice compared to single treatments (). Thus, a combination of CTX with neutralizing anti-ICOS mAb efficiently controlled tumor growth in CD34-reconstituted HuMice. As expected from the results reported above, the proportion of Treg was lower and the CD8 to Treg ratio was higher in the tumor of the combo group relative to CTX alone (), showing that the combined effect of CTX and anti-ICOS was associated to a favorable CD8 to Treg ratio.
Figure 6. Impact of anti-ICOS mAb on tumor growth in HuMice. (a) Experimental design of the study, as detailed in the text. (b) Tumor growth was determined in four independent experiments in the indicated number of mice treated by PBS and isotype control (Vehicles), anti-ICOS and PBS (anti-ICOS; 50 µg/mouse), cyclophosphamide and isotype control (CTX; 1.5 mg/mouse) or a combination of CTX and anti-ICOS (Combo). Error bars are SEM. The arrow indicates the day the anti-ICOS, and the CTX treatment was performed. (c) Frequencies of Foxp3+CD25+ cells in CD4+CD3+ cells of the tumor in the indicated conditions. The CD8 to Treg ratio was obtained by dividing the frequencies of CD8+ T cells by the frequencies of Foxp3+CD25+ cells in CD3+ cells of the tumor in the indicated conditions. Each dot is a mouse and results are cumulative of two experiments.
Role of human CD8 T cells and murine myeloid cells in the control of tumor growth by the combination of chemotherapy and anti-ICOS mAb
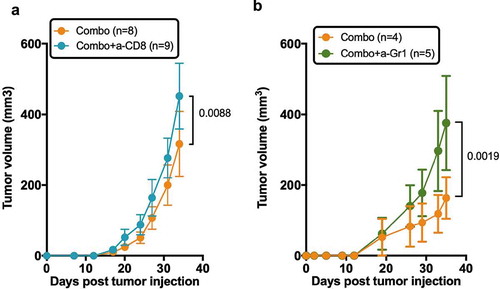
Frequencies of human CD45+CD3+ T cells in the tumor were similar in all groups (Fig. S5), indicating that better tumor control in the combo group was not associated to a quantitative increase of human T cells. We thus investigated the role of human CD8+ T cells on tumor control in the combo group. For that, we injected HuMice with a chimeric CD8-depleting recombinant Ig after tumor implantation and before the combination of treatments. As already noted in HuMice,Citation25 efficient CD8+ T cell depletion was observed in the spleen and tumors of euthanized animals (Fig. S6A) that was quantified by a large increase in the CD4 to CD8 ratio (Fig. S6B). Although there was a statistical difference between the two curves, tumor growth was marginally affected by the absence of CD8+ T cells (), showing that these were not entirely responsible for better tumor control in the combo group. It was not possible to use a CD4-depleting reagent in HuMice to determine the role of CD4 T cells on tumor control since it would have depleted both Treg and effector CD4 T cells, preventing any firm conclusions to be drawn. We thus investigated the role of murine myeloid cells on the effect of the combination treatment. We treated a novel set of combo-treated HuMice with the anti-Gr1 mAb that depletes Ly6C+ and Ly6G+ cells, mostly monocytes and neutrophils. Like for human CD8+ T cells, tumors grew marginally better in the anti-Gr1-treated group compared to isotype controls (), indicating that murine myeloid cells also participated in tumor control evoked by the combination of CTX and anti-ICOS mAb.
Figure 7. Role of human T cells and murine myeloid cells in the prevention of tumor growth by the combination of chemotherapy and anti-ICOS mAb. (a) Tumor growth in the absence of CD8+ T cells in the combo group. Neonatal CD34-reconstituted NSG mice were grafted s.c with the MDA-MB-231 cell line, injected with cyclophosphamide (CTX; 1.5 mg/mouse) and the anti-ICOS mAb (50 µg/mouse) with (Combo+a-CD8) or without (Combo) the MT807R1 recombinant Ig (10mg/kg) (b) Tumor growth was followed in HuMice treated with the combination of CTX and anti-ICOS mAb and an isotype control (Combo+Iso) or an anti-Gr1 mAb (200µg/mouse i.p). The first injection began 2 days before the combo treatment, followed by five injections, twice a week for 3 weeks. In this experiment, NSG female mice were humanized at the age of 3 weeks, then grafted as mentioned with the MDA breast cancer cell line. Results shown are cumulative of two independent experiments. The total number of mice is indicated in brackets. Error bars are SEM.
Discussion
In the present study, we provide the first demonstration that CD34-reconstituted HuMice can be used as a platform for the discovery and the validation of novel combinations of chemotherapy and immunotherapy, potentially applicable to patients. This demonstration originates from several similarities between HuMice and patients that we reveal here using multiparametric fluorescent and mass cytometry. A first similarity that we uncovered here was the composition of the tumor immune landscape. Within total human hematopoietic cells, it is remarkable to note that within CD45+ cells, a similar proportion of CD3+ T cells infiltrated the tumors in patients and in HuMice. Thus, HuMice models might be useful to decipher the molecules and mechanisms at play that attracts T cells within the tumor environment. We also observed similar infiltration of memory/activated CD4+ and CD8+ T cells that expressed a combination of activation markers. However, this activation status did not translate into increased proliferation in the tumor of HuMice, suggesting that the tumor microenvironment of this triple negative (TN) PRnegERnegHER-2neg cell line might be immunosuppressive in vivo. The immunosuppressive status of the tumor microenvironment in breast cancer patients varies according to the nature of the tumor (ER+, HER2+, TN) that may condition T cell infiltrate and T cell activation status.Citation26 Among breast tumor entities, TNs are the most infiltrated by T cells,Citation27 CD8+ and FOXP3+ cells alike, suggesting that TN might be an immunosuppressive-prone microenvironment. Here, we did not compare the proliferative status of T cells from patients with HuMice since none were carrying TN tumors. Further studies should confirm whether the immunosuppressive environment of the TN cell line observed here in HuMice is also observed in patients.
The enrichment for ICOS-expressing Treg is a remarkably conserved feature in HuMice and patients and led us to investigate the therapeutic potential of targeting ICOS for cancer immunotherapy. ICOS, a member of the Ig superfamily, is an essential co-stimulatory molecule for T cell activation and function. Although originally thought of as a co-stimulatory molecule for effective T helper cell response, the biology of ICOS now extends well beyond this narrowed view.Citation28 Relevant to the present study, we and others have shown that the survival, the expansion, and the suppressive functions of human Treg were dependent on ICOS signaling.Citation19,Citation21,Citation29 Thus, we evaluated whether an anti-ICOS mAb could affect human Treg in vivo, with possible impact on tumor growth. The reduction in the absolute numbers of total T cells and Treg after anti-ICOS mAb treatment that we report here is in line with an important role for ICOS/ICOS-L on T cells survival. An alternative possibility is that Treg would be physically depleted by the mAb, even though the murine IgG1 isotype used herein is not recognized as a strong inducer of ADCC. This physical depletion is unlikely to occur by complement-dependent cytotoxicity since NSG mice, like their NOD relatives, bears a 2-bp deletion in the C5 gene.Citation30 The murine anti-ICOS mAb might have engaged activating FcRs expressed by myeloid cells, such as FcgRIII, leading to the active killing of ICOS-expressing cells, including Treg. Indeed, Treg depletion mediated by myeloid cells has been proposed as a mechanism to explain slower tumor growth following administration of a murine IgG2a isotype to GITR in mice.Citation31 As put forward in the study of Bulliard et al.,Citation31 much remains to be done to decipher the mechanisms responsible for mAb-mediated T cell depletion in mice. Whatever the precise mechanisms that remain to be uncovered, Treg depletion is now considered a major mechanism for therapeutic efficacy of anti-CTLA-4 or anti-OX40 mAbs in miceCitation32–Citation34 and possibly of Ipilimumab in humans.Citation35 Additionally, the engagement of the ICOS/ICOS-L pathway is required for anti-CTLA-4 efficacy in some models.Citation36 Several mAbs targeting Treg are in development or already approved, including but not limited to anti-CCR4,Citation37 anti-OX-40,Citation38 anti-GITRCitation39 and anti-CD25 mAb.Citation40 In addition, the chemokine receptor CCR8 was recently proposed as an attractive target to affect Treg in breast cancer, although this was not directly demonstrated.Citation41 Our results indicate that ICOS might be a useful addition to this growing list of Treg targets.
In line with published results in murine models,Citation42 we confirm here that blocking ICOS alone was not sufficient to impact tumor growth. However, a combination of chemotherapy and anti-ICOS mAb significantly impacted tumor growth in CD34-HuMice. This result supports the notion that the reduction in Treg is associated with better tumor control if ICD is simultaneously induced by chemotherapy. However, the results of in vivo depletion experiments did not support a major role for human CD8+ T cells nor murine myeloid cells on tumor control in the combination group. Thus, we surmise that CD4+ T cells might be central for tumor control following the combined treatment. Releasing Treg-mediated immunosuppression may allow a better CD4-mediated response directly against the tumor and/or indirectly through improved CD4-help to various immune subsets, notably myeloid cells. Supporting this hypothesis, it was recently demonstrated in syngeneic models that combination immunotherapy leads to polarization of monocytes to macrophages.Citation43 This is also remnant of a comprehensive study showing that the proportion of circulating classical monocytes is a good indicator of successful anti-PD-1 treatment for melanoma.Citation44
In addition to human CD3+ T cells, our CyTOF analysis showed that the tumors of HuMice could also contain rare populations of immune cells known to play important roles during the anti-tumor immune response, such as monocytes or pDCs. The pDC subset that we describe here for the first time in the tumor of HuMice might have played a role in the amplification of ICOS+ Treg, as described in breast cancer patients.Citation21 We also revealed the presence of NK cells with low expression of NKp46 in the tumor, suggesting impaired function, in agreement with clinical observations.Citation45 Nevertheless, innate human subsets were rare and not always present in HuMice, casting doubts on their effective role during the anti-tumor immune response in regular HuMice. It will be important in the future to monitor the human myeloid compartment in HuMice models optimized for innate human cells development, since those cells can positivelyCitation46 and/or negatively affect the local anti-tumor immune response.Citation47
To our knowledge, our study represents the first demonstration that ICOS represents a target to impact tumor growth in the context of chemotherapy. The presence of ICOS+ Treg has been described in breast,Citation20 ovarian,Citation48 and gastricCitation49 carcinomas, melanomasCitation50,Citation51 and more recently follicular lymphomas,Citation52 suggesting that ICOS-based cancer immunotherapy might be applicable to a wide range of cancers.
Methods
Mice and humanization
NOD.SCID.gc-null mice (stock ≠005557) were originally purchased from the Jackson Laboratory and were bred in our own animal facility under a 14–10-h light cycle with ad libitum food and water. Mice were given Baytril in their water every other week. Newborns NSG mice were reconstituted by intrahepatic injection of 5. 104 to 105 magnetically purified CD34+ cord blood cells according to the manufacturer’s instructions (Miltenyi, Paris, France) or were purchased from ABCell Bio (Paris, France). Reconstitution was followed over time in the blood by multicolor flow cytometry using the following markers in various combinations of fluorescent dyes: mCD45, hCD45, hCD3, hCD20, hCD4, and hCD8. Validated males and females humanized mice of 16 to 20 weeks old were grafted s.c in the right flank with 1.5.106 MDA-MB-231 breast cancer cells. Mice were euthanized when the tumor reached 3000 mm3 in control groups or 4 to 5 weeks after tumor implantation. All protocols were approved by the French National Ethical Committee on Animal Experimentation (Ce5/2012/025). To assess the effects of the various treatments on tumor growth, a total of four experiments are presented. Not every experiment included all conditions. Males and females NSG were randomly dispatched into the various experimental groups to avoid sex-linked effects. Experimental groups were dispatched in different cages to avoid cage-related effects. Tumor growth was monitored in a blinded fashion. The number of mice used in each condition is indicated in the figure legend.
Cell line
The triple-negative (PRnegERnegHER-2neg) MDA-MB-231 cell line was grown in DMEM media supplemented with 10% FCS, L-glutamine and antibiotics (Penicillin/Streptomycin) (all from Thermo) in tissue culture flasks. Cells were transduced with a lentiviral vector co-expressing GFP and Luciferase to follow efficient engraftment in vivo using luciferase and to allow the exclusion of tumor cells from the analysis based on GFP expression. Cells were confirmed of being mycoplasma-free by a standard Hoechst-dye coloration on indicator Vero cells before injection into mice. A genetic profiling was established and confirmed the identity of the cell line (Eurofins Forensic Department, Ebersberg, Germany).
Reagents preparation and injection
The 314.8 mAb (mouse IgG1 anti-human ICOS) has been described before.Citation21 Isotype controls (mouse IgG1, MOPC-1; rat IgG2b, LTF-2) and anti-Gr1 mAb (rat IgG2b, RB6-8C5) were purchased from BioXcell (West Lebanon, NH, USA). The MT807R1 recombinant Ig consisting of rhesus IgG1k constant regions and CDRs derived from the anti-human CD8 antibody M-T807 grafted into rhesus variable framework regions and was provided by the Nonhuman Primate Reagent Resource (NIH contract HHSN272200900037C and grant RR016001). The antibody was expressed in vitro using serum-free medium and purified by protein-A affinity chromatography. Endotoxin was <1EU/mg. Cyclophosphamide (CTX, Sigma Aldrich) was prepared extemporaneously according to supplier technical data sheet, i.e to 20 mg/ml of injectable water. All reagents were injected intraperitoneally.
Phenotypic analysis of leukocytes in the spleens and tumors of humanized mice
Splenocytes and tumors were digested with 1.6 mg/ml of collagenase IV and 10 µg/ml of DNAse I (Sigma Aldrich) for 2 h at 37° with regular flushing of the tissue. Cells were passed through a 40 µm-cell strainer and resuspended in PBS 3% SVF. To eliminate dead cells and debris, tumor cell suspensions were isolated on a Ficoll gradient. Rings were collected, washed, and cell pellets were resuspended in PBS 3%SVF before counting with Trypan blue exclusion. Subsequently, 3 to 6. 106 cells live cells were stained with corresponding antibodies (lanthanide labeled mAbs for CyTOF or fluorochrome-labeled mAbs for FACS analysis). The details of each panel (each one corresponding to one experiment) can be found in Table S1. For CyTOF, 1 to 3 µl of each lanthanide-labeled mAbs was added in 1.5 ml Eppendorf tubes in a final volume of 50 µl of Max Par Staining Buffer (Fluidigm, San Francisco, USA), according to manufacturer protocol. Intracellular staining was performed with FOXP3 staining kit (eBioscience, Courtaboeuf, France). Cell events were acquired on the CyTOF-2 mass cytometer and CyTOF software version 6.0.626 (Fluidigm) at the Cytometry Pitié-Salpétrière core (CyPS). Dual count calibration, noise reduction, cell length threshold between 10 and 150 pushes, and a lower convolution threshold equal to 10 were applied during acquisition. Data files produced by the CyTOF-2 were normalized with the MatLab Compiler software normalizer using the signal from the 4-Element EQ beads (Fluidigm) as recommended by the software developers. GFP exclusion was performed to remove tumor cells from the analysis. To normalize the variability between mice for supervised (i.e. 2D plots) and unsupervised (i.e. tSNE) analysis, samples from tumors and spleen individually acquired on the CyTOF were aggregated in an individual file in each organ and in each experiment.
Clinical samples
The main clinical characteristics of the patients are summarized in . Luminal breast tumors were collected from nine untreated cancer patients undergoing standard surgery at Institut Curie Hospital, in accordance with institutional ethical guidelines and approved by the ethical (CPP ref: 99–15) and medical (ANSM ref: 2015-A00824-45) committees. Flow cytometry data in those patients were collected prior to the initiation of the HuMice study; hence, no CyTOF data were collected from human patients.
Table 1. Clinical characteristics of the primary breast tumors samples. Age = age of the patient at the time of surgery/Meno. status = Menopausal status/Histo. = Histologic type/Grad. = SBR Grade (histo-prognostic grade based on “Scarff-Bloom-Richardson”)/pTNM = tumor classification based on Tumor-Nodes-Metastasis score/ER = % of estrogen receptor positivity/PR = % of progesterone receptor positivity/Ki67% = cellular marker of proliferation/TILs = % of Tumor-infiltrated Lymphocytes.
Tumor samples from patients and cell isolation
Samples were cut into small fragments, digested with 0.1 mg/ml Liberase TL in the presence of 0.1 mg/ml DNase (Roche, Meylan, France) and incubated for 30 min at 37°C in 5% of CO2 incubator. Subsequently, cells were filtered on a 40-μm cell strainer (BD Biosciences, Le Pont-de-Claix, France), washed and submitted to staining with specific antibodies. Peripheral blood from breast cancer patients was collected in tubes containing EDTA, washed in PBS and submitted to staining with specific fluorescent-labeled antibodies.
Phenotypic analysis of leukocytes in whole blood and tumors in human breast cancer patients
Tumor cell suspension and whole blood were stained with LIVE/DEAD Fixable Aqua (Life Technologies, Courtaboeuf, France) for 10 min at RT. Then, cells were washed and stained with Aqua BV500 dead cells exclusion dye (Life Technologies); anti-CD3 (clone OKT3, BV650), anti-CD4 (clone OKT4, BV785), anti-PD-1 (EH122.2H7, BV711), anti-CD27 (O323, BV605) from Biolegend (London, UK); anti-CD45 (clone 2D1, APC Cy7), anti-CD8 (clone RPA-T8, BUV395), anti-CD19 (clone HIB 19, Alexa 700) anti-CD56 (NCAM16.2, BUV737), anti-HLA-DR (G46.6, PECy5), anti-PD-L1 (MIHI, PE-CF594) from BD Biosciences; anti-EpCAM (1B7, eFluor660), anti-CD14 (2G5, FITC), anti-CD45RA (HI100, PECy7), and anti-ICOS (ISA3, PERCPe710) from eBioscience for 20 min at 4°C. After incubation, cells were washed and permeabilized for 16 h according to manufacturer’s instructions for staining with anti-FOXP3 (236A/E7, PE, eBioscience) and anti-Granzyme-B (GB11, BV421, BD Biosciences). Cells were then fixed for subsequent analysis on a Fortessa flow cytometer (BD Biosciences). Data were analyzed with FlowJo Version v10 (FlowJO LCC, Ashland, USA), or Cytobank (www.cytobank.org).
Mass cytometry data analysis
For CyTOF data analysis, 10 healthy cord blood donors were used in four independent experiments, each experiment including mice reconstituted with different donors. A total of 15 mice were analyzed at the steady state by mass cytometry for human and murine cell content in the spleen and the tumor. Due to the paucity of cells in tissues of some HuMice, and to increase the resolution of the analysis, tissue samples from 2 to 3 of those mice were pooled before staining and CyTOF analysis. The frequency of hCD45+ determined by flow cytometry was used to normalize the representation of each mouse within the pool. In case where a sufficient number of cells were collected, tissue samples from individual mice were run into CyTOF. To normalize the analysis from these various conditions, concatenation of individual mice from the same tissue in the same experiment was performed using FlowJo v10. Concatenated samples were exported in Cytobank for unsupervised viSNE analysis or were analyzed using FlowJo v10 for supervised analysis. For viSNE analysis, the default settings were applied: 1000 iterations, perplexity of 30 and a theta factor of 0.5.
Statistical analysis
Statistical analyses were performed using Prism v6.0h for Mac (GraphPad) with statistical models indicated in the figure legends. The outliers detection method is reported in the figure legends when applicable. All tests were performed with α <0.05 (probability of detecting a difference in the means by chance below 5%). No a-priori sample size estimation to fit statistical power with the observed effect on tumor growth was used. However, a reverse analysis of our data (G-Power; gpower.hhu.de) showed that given the number of mice included in the study, the observed difference in the means at the end of the experiment and the standard deviations in both groups, the β power was >95%, hence validating the rejection of the null hypothesis by statistical modeling of the data. For statistical analysis of tumor growth, the null hypothesis stating that one curve fits all the data in the compared groups was rejected if the p-value was inferior to 0.05, determined by nonlinear regression modeling of the data using the exponential growth equation.
Abbreviations
| ICOS | = | Inducible Costimulatory |
| NSG | = | NOD.SCID.gc-null |
| Treg | = | regulatory T cells |
| CTX | = | cyclophosphamide |
| HuMice | = | humanized mice |
| CyTOF | = | cytometry time-of-flight |
| tSNE | = | t-distributed stochastic neighbor embedding |
| pDCs | = | plasmacytoid dendritic cells |
| DC | = | dendritic cells |
| ICD | = | immunogenic cell death |
Author’s contributions
Conceptualization, AB, CC, and GM; Methodology, AB and GM; Formal Analysis, AB, RR, PKC, KS, AC, and GM; Investigation, AB, RR, PKC, KS, and AC; Resources, EP, DO, and CMC; Writing-Original Draft, AB and GM; Writing-Review and editing, AB, RR, EP, PKC, CMC, CC, and GM; Visualization, AC, GM; Supervision, GM; Funding acquisition, CMC, CC, DO, and GM.
Competing interests
The authors declare no competing interests. GSK had neither implication in the design of the experiments nor in the interpretation of the results.
Supplemental Material
Download PDF (1.2 MB)Acknowledgments
The authors would like to thank Ms S Just-Landi (Institut Paoli-Calmettes, Marseille, France) for providing the 314.8 mAb, Dr S Brunel for technical help, Dr H. Yssel (CIMI-PARIS, Paris, France) for monitoring mycoplasma infection in cell culture, Dr V. Vieillard (CIMI-PARIS) for advice on NK cells analysis, Dr M. Miyara (CIMI-PARIS) and Dr C. Combadière (CIMI-PARIS) for access to Cytobank, Dr B Salomon (CIMI-PARIS) for critical reading of the manuscript, C. Enond, O. Brégerie and B. Kane (Centre d’Exploration Fonctionnelle, Sorbonne Université, Paris, France) for animal husbandry, and all the mothers for cord blood donations and patients for blood samples.
Supplementary Material
Supplemental data for this article can be accessed on the publisher’s website.
Additional information
Funding
Related Research Data
References
- Wolchok JD, Kluger H, Callahan MK, Postow MA, Rizvi NA, Lesokhin AM, Segal NH, Ariyan CE, Gordon R-A, Reed K, et al. Nivolumab plus ipilimumab in advanced melanoma. N Engl J Med. 2013;369(2):122–133. doi:10.1056/NEJMoa1302369.
- Moynihan KD, Opel CF, Szeto GL, Tzeng A, Zhu EF, Engreitz JM, Williams RT, Rakhra K, Zhang MH, Rothschilds AM, et al. Eradication of large established tumors in mice by combination immunotherapy that engages innate and adaptive immune responses. Nat Med. 2016;22(12):1402–1410. doi:10.1038/nm.4200.
- DeRose YS, Wang G, Lin Y-C, Bernard PS, Buys SS, Ebbert MTW, Factor R, Matsen C, Milash BA, Nelson E, et al. Tumor grafts derived from women with breast cancer authentically reflect tumor pathology, growth, metastasis and disease outcomes. Nat Med. 2011;17(11):1514–1520. doi:10.1038/nm.2454.
- Valdez KE, Fan F, Smith W, Allred DC, Medina D, Behbod F. Human primary ductal carcinoma in situ (DCIS) subtype-specific pathology is preserved in a mouse intraductal (MIND) xenograft model. J Pathol. 2011;225(4):565–573. doi:10.1002/path.2969.
- Bankert RB, Balu-Iyer SV, Odunsi K, Shultz LD, Kelleher RJ, Barnas JL, Simpson-Abelson M, Parsons R, Yokota SJ. Humanized mouse model of ovarian cancer recapitulates patient solid tumor progression, ascites formation, and metastasis. PLoS One. 2011;6(9):e24420. doi:10.1371/journal.pone.0024420.
- Quintana E, Piskounova E, Shackleton M, Weinberg D, Eskiocak U, Fullen DR, Johnson TM, Morrison SJ. Human melanoma metastasis in NSG mice correlates with clinical outcome in patients. Sci Transl Med. 2012;4(159):159ra149. doi:10.1126/scitranslmed.3004599.
- Morton JJ, Bird G, Refaeli Y, Jimeno A. Humanized mouse xenograft models: narrowing the tumor-microenvironment gap. Cancer Res. 2016;76(21):6153–6158. doi:10.1158/0008-5472.CAN-16-1260.
- Sanmamed MF, Rodriguez I, Schalper KA, Onate C, Azpilikueta A, Rodriguez-Ruiz ME, Morales-Kastresana A, Labiano S, Perez-Gracia JL, Martin-Algarra S, et al. Nivolumab and urelumab enhance antitumor activity of human T lymphocytes engrafted in Rag2-/-IL2R null immunodeficient mice. Cancer Res. 2015;75(17):3466–3478. doi:10.1158/0008-5472.CAN-14-3510.
- Shultz LD, Lyons BL, Burzenski LM, Gott B, Chen X, Chaleff S, Kotb M, Gillies SD, King M, Mangada J, et al. Human lymphoid and myeloid cell development in NOD/LtSz-scid IL2R null mice engrafted with mobilized human hemopoietic stem cells. J Immunol. 2005;174(10):6477–6489. doi:10.4049/jimmunol.174.10.6477.
- Marodon G, Desjardins D, Mercey L, Baillou C, Parent P, Manuel M, Caux C, Bellier B, Pasqual N, Klatzmann D. High diversity of the immune repertoire in humanized NOD.SCID.gamma c-/- mice. Eur J Immunol. 2009;39(8):2136–2145. doi:10.1002/eji.200939480.
- Wege AK, Ernst W, Eckl J, Frankenberger B, Vollmann-Zwerenz A, Männel DN, Ortmann O, Kroemer A, Brockhoff G. Humanized tumor mice-A new model to study and manipulate the immune response in advanced cancer therapy. Int J Cancer. 2011;129(9):2194–2206. doi:10.1002/ijc.26159.
- Escobar G, Moi D, Ranghetti A, Ozkal-Baydin P, Squadrito ML, Kajaste-Rudnitski A, Bondanza A, Gentner B, De Palma M, Mazzieri R, et al. Genetic engineering of hematopoiesis for targeted IFN-α delivery inhibits breast cancer progression. Sci Transl Med. 2014;6(217):217ra3. doi:10.1126/scitranslmed.3006353.
- Rongvaux A, Willinger T, Martinek J, Strowig T, Gearty SV, Teichmann LL, Saito Y, Marches F, Halene S, Palucka AK, et al. Development and function of human innate immune cells in a humanized mouse model. Nat Biotechnol. 2014;32:364–372. doi:10.1038/nbt.2858.
- Morton JJ, Bird G, Keysar SB, Astling DP, Lyons TR, Anderson RT, Glogowska MJ, Estes P, Eagles JR, Le PN, et al. XactMice: humanizing mouse bone marrow enables microenvironment reconstitution in a patient-derived xenograft model of head and neck cancer. Oncogene. 2016;35(3):290–300. doi:10.1038/onc.2015.94.
- Mahne A, Mauze S, Joyce-Shaikh B, Xia J, Bowman E, Beebe A, Cua D, Jain R. Dual roles for regulatory T cell depletion and co-stimulatory signaling in agonistic GITR targeting for tumor immunotherapy. Cancer Res. 2016;77(5):1108–1118. doi:10.1158/0008-5472.CAN-16-0797.
- Amir ED, Davis KL, Tadmor MD, Simonds EF, Levine JH, Bendall SC, Shenfeld DK, Krishnaswamy S, Nolan GP, Pe’er D. viSNE enables visualization of high dimensional single-cell data and reveals phenotypic heterogeneity of leukemia. Nat Biotechnol. 2013;31(6):545–552. doi:10.1038/nbt.2594.
- See P, Dutertre C-A, Chen J, Günther P, McGovern N, Irac SE, Gunawan M, Beyer M, Händler K, Duan K, et al. Mapping the human DC lineage through the integration of high-dimensional techniques. Science. 2017;356(6342):eaag3009. doi:10.1126/science.aag3009.
- Miyara M, Yoshioka Y, Kitoh A, Shima T, Wing K, Niwa A, Parizot C, Taflin C, Heike T, Valeyre D, et al. Functional delineation and differentiation dynamics of human CD4+ T cells expressing the FoxP3 transcription factor. Immunity 2009;30(6):899–911. doi:10.1016/j.immuni.2009.03.019.
- Ito T, Hanabuchi S, Wang YH, Park WR, Arima K, Bover L, Qin FXF, Gilliet M, Liu YJ. Two functional subsets of FOXP3+ regulatory T cells in human thymus and periphery. Immunity 2008;28(6):870–880. doi:10.1016/j.immuni.2008.03.018.
- Gobert M, Treilleux I, Bendriss-Vermare N, Bachelot T, Goddard-Leon S, Arfi V, Biota C, Doffin AC, Durand I, Olive D, et al. Regulatory T cells recruited through CCL22/CCR4 are selectively activated in lymphoid infiltrates surrounding primary breast tumors and lead to an adverse clinical outcome. Cancer Res. 2009;69(5):2000–2009. doi:10.1158/0008-5472.can-08-2360.
- Faget J, Bendriss-Vermare N, Gobert M, Durand I, Olive D, Biota C, Bachelot T, Treilleux I, Goddard-Leon S, Lavergne E, et al. ICOS-ligand expression on plasmacytoid dendritic cells supports breast cancer progression by promoting the accumulation of immunosuppressive CD4+ T cells. Cancer Res. 2012;72(23):6130–6141. doi:10.1158/0008-5472.CAN-12-2409.
- Faget J, Sisirak V, Blay J-Y, Caux C, Bendriss-Vermare N, Ménétrier-Caux C. ICOS is associated with poor prognosis in breast cancer as it promotes the amplification of immunosuppressive CD4(+) T cells by plasmacytoid dendritic cells. Oncoimmunology. 2013;2(3):e23185. doi:10.4161/onci.23185.
- Pfirschke C, Engblom C, Rickelt S, Cortez-Retamozo V, Garris C, Pucci F, Yamazaki T, Poirier-Colame V, Newton A, Redouane Y, et al. Immunogenic chemotherapy sensitizes tumors to checkpoint blockade therapy. Immunity 2016;44(2):343–354. doi:10.1016/j.immuni.2015.11.024.
- Sistigu A, Viaud S, Chaput N, Bracci L, Proietti E, Zitvogel L. Immunomodulatory effects of cyclophosphamide and implementations for vaccine design. Semin Immunopathol. 2011;33(4):369–383. doi:10.1007/s00281-011-0245-0.
- Petit NY, Lambert-Niclot S, Marcelin A-G, Garcia S, Marodon G. HIV replication is not controlled by CD8+ T cells during the acute phase of the infection in humanized mice. PLoS One 2015;10(9):e0138420. doi:10.1371/journal.pone.0138420
- Stanton SE, Disis ML. Clinical significance of tumor-infiltrating lymphocytes in breast cancer. J Immunother Cancer. 2016;4(2):59. doi:10.1186/s40425-016-0165-6.
- Stanton SE, Adams S, Disis ML. Variation in the incidence and magnitude of tumor-infiltrating lymphocytes in breast cancer subtypes a systematic review. JAMA Oncol. 2016;2(10):1354–1360. doi:10.1001/jamaoncol.2016.1061.
- Wikenheiser DJ, Stumhofer JS. ICOS co-stimulation: friend or Foe? Front Immunol. 2016;7(AUG):304. doi:10.3389/fimmu.2016.00304.
- Tuettenberg A, Huter E, Hubo M, Horn J, Knop J, Grimbacher B, Kroczek RA, Stoll S, Jonuleit H. The role of ICOS in directing T cell responses: ICOS-dependent induction of T cell anergy by tolerogenic dendritic cells. J Immunol. 2009;182(6):3349–3356. doi:10.4049/jimmunol.0802733.
- Baxter AG, Cooke A. Complement lytic activity has no role in the pathogenesis of autoimmune diabetes in NOD mice. Diabetes. 1993;42:1574–1578.
- Bulliard Y, Jolicoeur R, Windman M, Rue SM, Ettenberg S, Knee DA, Wilson NS, Dranoff G, Brogdon JL. Activating Fc γ receptors contribute to the antitumor activities of immunoregulatory receptor-targeting antibodies. J Exp Med. 2013;210(9):1685–1693. doi:10.1084/jem.20130573.
- Simpson TR, Li F, Montalvo-Ortiz W, Sepulveda MA, Bergerhoff K, Arce F, Roddie C, Henry JY, Yagita H, Wolchok JD, et al. Fc-dependent depletion of tumor-infiltrating regulatory T cells co-defines the efficacy of anti-CTLA-4 therapy against melanoma. J Exp Med. 2013;210(9):1695–1710. doi:10.1084/jem.20130579.
- Selby MJ, Engelhardt JJ, Quigley M, Henning KA, Chen T, Srinivasan M, Korman AJ. Anti-CTLA-4 antibodies of IgG2a isotype enhance antitumor activity through reduction of intratumoral regulatory T cells. Cancer Immunol Res. 2013;1(1):32–42. doi:10.1158/2326-6066.CIR-13-0013.
- Bulliard Y, Jolicoeur R, Zhang J, Dranoff G, Wilson NS, Brogdon JL. OX40 engagement depletes intratumoral Tregs via activating FcγRs, leading to antitumor efficacy. Immunol Cell Biol. 2014;92(6):475–480. doi:10.1038/icb.2014.26.
- Romano E, Kusio-Kobialka M, Foukas PG, Baumgaertner P, Meyer C, Ballabeni P, Michielin O, Weide B, Romero P, Speiser DE. Ipilimumab-dependent cell-mediated cytotoxicity of regulatory T cells ex vivo by nonclassical monocytes in melanoma patients. Proc Natl Acad Sci. 2015;112(19):201417320. doi:10.1073/pnas.1417320112.
- Fan X, Quezada SA, Sepulveda MA, Sharma P, Allison JP. Engagement of the ICOS pathway markedly enhances efficacy of CTLA-4 blockade in cancer immunotherapy. J Exp Med. 2014;211(4):715–725. doi:10.1084/jem.20130590.
- Chang D-K, Peterson E, Sun J, Goudie C, Drapkin RI, Liu JF, Matulonis U, Zhu Q, Marasco WA. Anti-CCR4 monoclonal antibody enhances antitumor immunity by modulating tumor-infiltrating Tregs in an ovarian cancer xenograft humanized mouse model. Oncoimmunology. 2016;5(3):e1090075. doi:10.1080/2162402X.2015.1090075.
- Marabelle A, Kohrt H, Sagiv-Barfi I, Ajami B, Axtell RC, Zhou G, Rajapaksa R, Green MR, Torchia J, Brody J, et al. Depleting tumor-specific Tregs at a single site eradicates disseminated tumors. J Clin Invest. 2013;123(6):2447–2463. doi:10.1172/JCI64859.
- Sukumar S, Wilson DC, Yu Y, Wong J, Naravula S, Ermakov G, Riener R, Bhagwat B, Necheva AS, Grein J, et al. Characterization of MK-4166, a clinical agonistic antibody that targets human GITR and inhibits the generation and suppressive effects of T regulatory cells. Cancer Res. 2017;77(29):canres.1439.2016. doi:10.1158/0008-5472.CAN-16-1439.
- Arce Vargas F, Furness AJS, Solomon I, Joshi K, Mekkaoui L, Lesko MH, Miranda Rota E, Dahan R, Georgiou A, Sledzinska A, et al. Fc-optimized anti-CD25 depletes tumor-infiltrating regulatory T cells and synergizes with PD-1 blockade to eradicate established tumors. Immunity 2017;46(4):577–586. doi:10.1016/j.immuni.2017.03.013.
- Plitas G, Konopacki C, Wu K, Bos PD, Morrow M, Putintseva EV, Chudakov DM, Rudensky AY. Regulatory T cells exhibit distinct features in human breast cancer. Immunity 2016;45(5):1122–1134. doi:10.1016/j.immuni.2016.10.032.
- Metzger TC, Long H, Potluri S, Pertel T, Bailey-Bucktrout SL, Lin JC, Fu T, Sharma P, Allison JP, Feldman RMR. ICOS promotes the function of CD4+ effector T cells during anti-OX40-mediated tumor rejection. Cancer Res. 2016;76(13):3684–3689. doi:10.1158/0008-5472.CAN-15-3412.
- Gubin MM, Esaulova E, Ward JP, Malkova ON, Runci D, Wong P, Noguchi T, Arthur CD, Meng W, Alspach E, et al. High-dimensional analysis delineates myeloid and lymphoid compartment remodeling during successful immune-checkpoint cancer therapy. Cell. 2018;175(4):1014–1030.e19. doi:10.1016/j.cell.2018.09.030.
- Krieg C, Nowicka M, Guglietta S, Schindler S, Hartmann FJ, Weber LM, Dummer R, Robinson MD, Levesque MP, Becher B. High-dimensional single-cell analysis predicts response to anti-PD-1 immunotherapy. Nat Med. 2018;24(2):144–153. doi:10.1038/nm.4466.
- Mamessier E, Sylvain A, Thibult M, Houvenaeghel G, Jacquemier J, Castellano R, Gonçalves A, André P, Romagné F, Thibault G, et al. Human breast cancer cells enhance self tolerance by promoting evasion from NK cell antitumor immunity. J Clin Invest. 2011;121(9):3609–3622. doi:10.1172/JCI45816.
- Broz ML, Binnewies M, Boldajipour B, Nelson AE, Pollack JL, Erle DJ, Barczak A, Rosenblum MD, Daud A, Barber DL, et al. Dissecting the tumor myeloid compartment reveals rare activating antigen-presenting cells critical for T cell immunity. Cancer Cell. 2014;26(5):638–652. doi:10.1016/j.ccell.2014.09.007.
- Gabrilovich DI, Ostrand-Rosenberg S, Bronte V. Coordinated regulation of myeloid cells by tumours. Nat Rev Immunol. 2012;12(4):253–268. doi:10.1038/nri3175.
- Conrad C, Gregorio J, Wang YH, Ito T, Meller S, Hanabuchi S, Anderson S, Atkinson N, Ramirez PT, Liu YJ, et al. Plasmacytoid dendritic cells promote immunosuppression in ovarian cancer via ICOS costimulation of Foxp3+ T-regulatory cells. Cancer Res. 2012;72(20):5240–5249. doi:10.1158/0008-5472.CAN-12-2271.
- Nagase H, Takeoka T, Urakawa S, Morimoto-Okazawa A, Kawashima A, Iwahori K, Takiguchi S, Nishikawa H, Sato E, Sakaguchi S, et al. ICOS + Foxp3 + TILs in gastric cancer are prognostic markers and effector regulatory T cells associated with H elicobacter pylori. Int J Cancer. 2016;1–10. doi:10.1002/ijc.30475.
- Martin-Orozco N, Li Y, Wang Y, Liu S, Hwu P, Liu Y-J, Dong C, Radvanyi L. Melanoma cells express ICOS ligand to promote the activation and expansion of T-regulatory cells. Cancer Res. 2010;70(23):9581–9590. doi:10.1158/0008-5472.CAN-10-1379.
- Strauss L, Bergmann C, Szczepanski MJ, Lang S, Kirkwood JM, Whiteside TL. Expression of ICOS on human melanoma-infiltrating CD4+CD25highFoxp3+ T regulatory cells: implications and impact on tumor-mediated immune suppression. J Immunol. 2008;180(5):2967–2980. doi:10.4049/jimmunol.180.5.2967.
- Le K-S, Thibult M-L, Just-Landi S, Pastor S, Gondois-Rey F, Granjeaud S, Broussais F, Bouabdallah R, Colisson R, Caux C, et al. Follicular B lymphomas generate regulatory T cells via the ICOS/ICOSL pathway and are susceptible to treatment by anti-ICOS/ICOSL therapy. Cancer Res. 2016;76(16):4648–4660. doi:10.1158/0008-5472.CAN-15-0589.