
ABSTRACT
Antigen recognition by MHC class I molecules is a key step for the initiation of the immune response. We hypothesized that expression of these molecules could be a marker of immune-activated breast cancers. Data from KM Plotter were extracted to develop an exploratory cohort. Information from Cancer Genome Atlas (TCGA) and METABRIC was used to create two validation cohorts. Raw data were re-processed and analyzed using plyr R and Bioconductor. We predicted epitope-HLA binding to MHC I molecules by using NetMHC 4.0. Cox proportional hazards regression was computed to correlate gene expression and survival outcome. There was a weak but positive correlation between mutational burden and the expression of most MHC class I molecules. In the exploratory cohort, expression of HLA-A and HLA-B was associated with favorable relapse-free survival (RFS) and overall survival (OS) in the basal-like subgroup. This was confirmed in the METABRIC and TCGA dataset. Expression of HLA-A and HLA-B was associated with biomarkers of T cell activation (GZMA, GZMB, and PRF1) and improved the predictive capacity of known immunologic signatures. Several neopeptides expressed in breast cancer were also identified including FUK, SNAPC3, GC, ANO8, DOT1L, HIST1H3F, MYBPH, STX2, FRMD6, CPSF1, or SMTN, among others. Expression of HLA A and B is associated with T cell activation and identifies immune activated, basal-like breast cancers with favorable prognosis. Antigen recognition markers should be incorporated into the assessment of the tumor immune state of basal-like breast patients.
Introduction
Immunotherapy has become a standard of care for the treatment of many solid tumors. Moreover, it is expected that in the future, immunomodulators alone or in combination with other therapies will be the main therapy in many indicationsCitation1. Recent examples of tumor types in which immunotherapy has produced clinical activity include, among others, melanoma, non-small cell lung cancer, bladder cancer, and head and neck tumors.Citation1,Citation2
The mechanism of action of approved immunotherapies is based on reduction of inhibitory signals, leading to activation of an immune response against the tumor.Citation2 This is achieved by targeting immune checkpoint inhibitors with antibodies like those binding PD1, PD-L1, or CTLA-4.Citation3 The inhibition of these transmembrane molecules facilitates the activation of an anti-tumor T cell response.Citation3 However, this effect is not produced in all treated tumors and, in addition, it is not absent of secondary effects.Citation2 In this context, identification of tumors that will respond to immunotherapy is the main goal to increase efficacy, while avoiding undesirable toxicities.Citation2 For checkpoint inhibitors, it has been suggested that the immune system must be activated against the tumor in order to induce an anti-tumor response, a scenario called a “hot tumor”.Citation3 Identification of those responsive tumors and the development of strategies to reverse unresponsive ones to make them sensitive is challenging, but represents one of the most demanding needs in this area.Citation4 Data support that high mutational burden is associated with a higher response to immunotherapy.Citation1,Citation5,Citation6 However, there are sparse data on any other marker of benefit.
A key step in the initiation of the immune response is the recognition and presentation of tumor antigens to effector cells like CD8 + T cells.Citation7 The major histocompatibility complex class I (MHC-I) molecules play a central role in this process by presenting native intracellular proteins or neoantigens produced by cancer cells to effector CD8 + T cells, therefore, initiating an immune response.Citation7–Citation9 We hypothesized that expression of MHC-I molecules could be a surrogate marker for “hot tumors” and, therefore, these tumors would be associated with better prognosis, due to increased adaptive antitumor immune response. This hypothesis is supported by recent data suggesting that human leukocyte antigen (HLA) class I genotype influences response to checkpoint inhibitors.Citation10
In addition, administration of some therapies including chemotherapy can indirectly activate the immune system by increasing the genomic instability and by releasing tumor neoantigens.Citation11–Citation13 In this context, those tumors that express a higher level of tumor-infiltrating lymphocytes (TILs) respond better to chemotherapy and are associated with favorable outcome.Citation14–Citation16
In our study, we aimed to explore the presence and prognostic role of MHC-I in breast tumors and their association with mutational tumor burden and prognosis. In addition, we explored the pattern of mutations associated with the presence of MHC class I genes describing potential neopeptides produced by these tumors.
Results
Association of human MHC-I components with mutational burden
We observed that there was a weak but positive correlation between mutational burden and the expression of most HLA genes. Those HLA molecules with higher magnitude association included HLA-A, HLA-B, and HLA-H. For others like HLA DOA and HLA J, the association was negative (Supplementary Figure 1A).
MHC-I expression and breast cancer prognosis
Given the association between mutational load and HLA A and B expression, we then explored their correlation with clinical outcome in the different breast cancer subtypes. HLA-H was not considered for further studies as it has been described as a pseudogene of HLA-A.Citation17
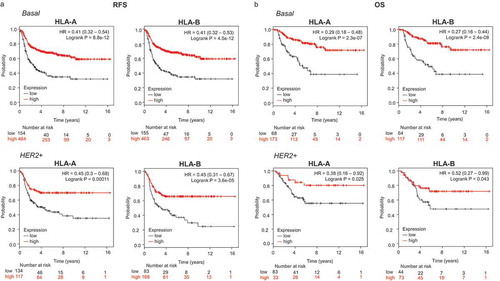
An association between both HLA-A and HLA-B with favorable relapse-free survival (RFS) was observed in the basal-like (HLA-A, HR: 0.41, CI 0.32–0.54; Log rank p < .001 and HLA-B, HR: 0.41, CI 0.32–0.53; Log rank p < .001) and HER2-enriched breast cancer subtypes (HLA-A, HR: 0.45, CI 0.3–0.68; Log rank p < .001 and HLA-B, HR: 0.45, CI 0.31–0.67; Log rank p < .001) (). Of note, no association with patient outcome, as measured by RFS, was observed in the luminal A subtype, and a weak association was found in the Luminal B subtype (Supplementary Figure 2A). Next, we evaluated the prognostic role of HLA-A and HLAB in relation to overall survival (OS) in the basal-like and HER2-enriched tumors. In a similar manner, both molecules were associated with favorable OS, particularly in basal-like tumors (HLA-A, HR: 0.29, CI 0.18–0.48; Log rank p < .001; and HLA-B, HR: 0.27, CI 0.16–0.44; Log rank p < .001) (). Again for luminal A and B no correlation was identified for OS, with the exception of HLA A in luminal B tumors (Supplementary Figure 2B).
Figure 1. Transcriptomic expression of HLA-A and HLA-B, and association with clinical outcome in an exploratory cohort of breast cancer patients. Kaplan-Meier survival plots show the association between HLA-A and HLA-B expression levels and patient prognosis, including relapse-free survival (RFS) (A) and overall survival (OS) (B) for basal (n = 879) and HER2+ (n = 335) breast tumors, respectively.
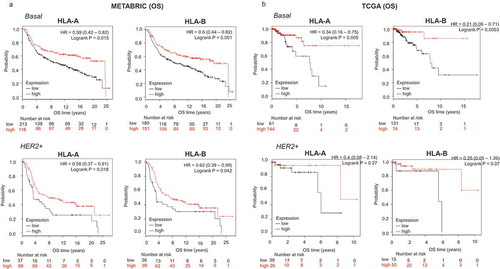
For the confirmatory cohorts, the basal-like subtype displayed the strongest association with outcome in both validation datasets (Cohort 1: OS HLA-A, HR: 0.59, CI 0.42–0.82; Log rank p = .002; HLA-B, HR: 0.60, CI 0.44–0.82; Log rank p = .001; cohort 2: OS HLA-A, HR: 0.34, CI 0.16–0.75; Log rank p = .005; HLA-B, HR: 0.21, CI 0.006–0.71; Log rank p = .005) (). Association with outcome was also observed for the HER2 subtype, although this association was not as strong as for basal tumors (). A combined analysis of the benefit observed by tumor subtype is observed for HLA-A and HLA-B in Supplementary Figure 3A and B for RFS and OS, respectively, demonstrating the mayor effect identified in the basal like and HER2 subtypes.
Figure 2. Transcriptomic expression of HLA-A and HLA-B, and association with clinical outcome in two validation cohorts (METABRIC and TCGA) of breast cancer patients. Kaplan-Meier survival plots using data from the METABRIC project (A) and TCGA (B) show the association of HLA-A and HLA-B expression levels, with patient overall survival (OS), for basal and HER2+ breast tumors.
Since mutations in MHC-I components have been associated with a lack of response to immune checkpoint inhibitors,Citation18 we evaluated the presence of mutations in HLA genes. Using TCGA data, we did not observe any association between mutations in HLA-A and HLA-B and prognosis (Cox regression p = .36). However, the numbers of patients with such mutations was low (n = 13).
Pattern of mutations and expression of HLA-A and HLA-B
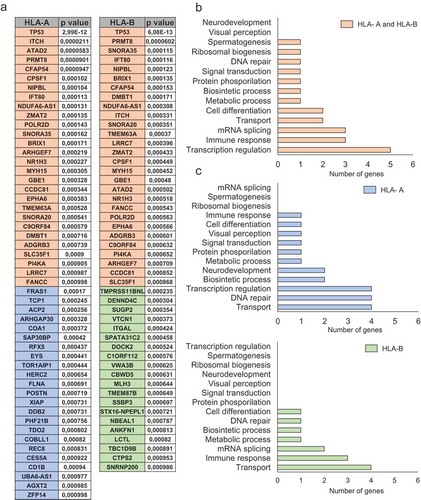
Using data from TCGA, we next explored the pattern of mutations associated with the upregulation of HLA-A and HLA-B. A list of all genes found to be mutated with their corresponding correlation values is shown in . When both HLA-A and HLA-B were upregulated, functional analyses of the mutated genes showed that they fall into the transcription regulation and immune response categories (). Considering exclusively the upregulation of HLA-A, the most frequently mutated genes were included in protein and lipid transport, and DNA repair. In the case of HLA-B, genes coding for immune response and protein and lipid transport were identified ().
Figure 3. Functional analyses for mutated genes associated with high HLA-A and HLA-B expression levels. A. List of mutated genes associated (p < 0,001) with upregulation of HLA-A and HLA-B (orange), HLA-A (blue) and HLA-B (green). The total number of genes for each function for HLA-A and HLA-B jointly (B) and individually (C). The selection of genes and their respective functions are described in material and methods.
Identification of neoantigens in mutated tumors
Once the most frequently mutated genes in tumors with upregulation of HLA-A and HLA-B were recognized, we aimed to identify potential neoantigens that could be produced by those altered genetic sequences. As can be seen in , several mutations do lead to peptides that can result in high-affinity binding with MHC-1 molecules. Some of these showed a high grade of affinity with % Rank below 0.5 like FUK, SNAPC3, GC, ANO8, DOT1L, HIST1H3F, MYBPH, STX2, FRMD6, CPSF1, or SMTN, among others.
Table 1. Neoantigens sequences of the identified mutated genes and their binding affinity with HLA molecules as described in material and methods. Specific mutations induce new antigen proteins which are recognized for peptides of HLA isoforms. Affinity is shown with % Rank.
Association between HLA-A and HLA-B and t cell activation
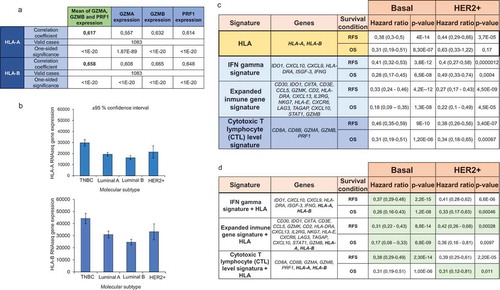
Expression of granzyme A (GZMA), granzyme B (GZMB), and PRF1 have been described as markers of T cell activation measured by gene expression in cohorts of patients.Citation19 In this context, we investigated the association of HLA-A and HLA-B expression with levels of GZMA, GZMB and PRF1 using data from TCGA. As shown in , a strong and positive correlation was observed between the expression of HLA-A and HLA-B and activation of effector T cells. These data confirm the capacity of HLA-A and -B to identify hot tumors that have capacity to mediate an immune T cell response. Finally, given the fact that the strongest association with T cell activation and outcome was observed in basal-like tumors, we aimed to explore the expression of HLA A and -B by tumor subtype. As shown in , the highest expression of HLA-A and HLA-B was observed for the basal-like subtype followed by the HER2-enriched subtype.
Figure 4. Prognosis of HLA-A and HLA-B based on immune signatures. A. Correlation between HLA-A and HLA-B expression and the expression of T cell activated genes (GZMA, GZMB, and PRF1). B. HLA-A and HLA-B expression in different breast cancer subtypes. C. The table shows the hazard ratio and the Kaplan-Meier p value, as described in material and methods, for HLA-A and HLA-B, and three immune signatures previously described for relapse-free survival (RFS) and overall survival (OS), in basal and HER2+ breast tumors. D. Inclusion of HLA-A and HLA-B in previously validated signatures. Those signatures which predictive capacity improved with the inclusion of HLA-A and HLA-B are highlighted in green.
Prognosis of HLA-A and HLA-B based on immune signatures
As can be seen in , the predictive capacity of HLA-A and HLA-B, was similar to the other signatures, particularly in the basal-like population. However, the inclusion of HLA-A and HLA-B to the described signatures improved their prognostic value, suggesting that antigen recognition is a key step to identify “hot tumors” ().
Discussion
The presence of immune infiltration in the tumor is a marker of favorable outcome, particularly in basal-like and HER2 positive breast tumors.Citation14,Citation15 For T cells to be activated, and therefore mediate an immune response, effective antigen presentation within the tumor is a key step.Citation10,Citation12 In our article, we identify that breast cancer tumors with high expression of the MHC-I molecules HLA-A and HLA-B, have an increased immune T cell activation and, consequently, favorable prognosis.
We first explored the association of MHC molecules with mutational load. We did so as data suggest an association between the total number of somatic mutations and immune infiltration.Citation6,Citation11 We identified a positive but weak correlation between mutational burden and MHC-I, HLA-A, HLA-B, and HLA-H.
When we evaluated the prognostic value of HLA-A and HLA-B, we found that their upregulation was associated with favorable prognosis, including improved relapse-free and overall survival. These findings were confirmed in several cohorts of patients, including validation cohorts from TCGA and METABRIC databases.
Expression of HLA-A and HLA-B correlated strongly with T cell activation, using GZMA, GZMB, and PRF1 as surrogates. When compared with other immune signatures like the cytotoxic T signature, the expanded immune gene signature, and the IFN gamma signature,Citation19,Citation20 the expression of these two genes, predicted prognosis with similar predictive accuracy. In addition, when HLA-A and HLA-B were added to the existing signatures the predictive value improved, demonstrating the importance of antigen presentation in the activation of the immune response. Between the different breast cancer subtypes, the basal-like subtype was the one with the greatest association with activation of T cells, the highest magnitude of association with prognosis and was the subtype with the highest expression of HLA-A and HLA-B. The importance of immunotherapy in basal breast cancer has recently been highlighted by positive results from the combination of immunomodulators, like atezolizumab, with chemotherapy.Citation21
Presence of TILs has been clearly associated with favorable outcome and response to therapy.Citation13–Citation15 In this line, our study also identifies patients with good prognosis. Unfortunately, the available datasets do not provide information to compare our gene signature with the presence of TILs and, therefore, future prospective studies will be necessary.
As antigen presentation defects can influence response to checkpoint inhibitors, we also explored the importance of mutations in HLA-A and HLA-B in relation to patient outcome. For instance, truncating mutations in the gene encoding the antigen-presenting protein beta-2-microglobulin (B2M) have been described. These lead to a loss of expression MHC-I and reduced response to PD(L)-1 blockade.Citation18 However, in our study, no significant association with prognosis was found, probably due to the number of mutations in HLA-A and HLA-B being very low.
In summary, expression of HLA-A and HLA-B is associated with T cell activation and identifies immune activated, basal-like breast cancers with favorable prognosis. These findings support the importance of antigen presentation and recognition as an initial step in the activation of the immune system. While the reported associations do not imply causality, they do generate hypotheses that can be tested in the laboratory as well as in the clinical setting. Such additional research is warranted especially to try to identify patients most likely to respond to immunotherapy.
Material and methods
Exploratory cohort
The exploratory cohort was set up by using samples from the KM Plotter Online Tool (http://www.kmplot.com).Citation22 This publicly available database allows the investigation of the relationship between gene expression and patient outcome including overall survival (OS) and relapse-free survival (RFS) in 879 basal-like, 2504 luminal A, 1425 luminal B and 335 HER2+ samples from breast cancer patients (as of January 2019). Patients were divided according to the best cutoff values of the gene expression (lowest p value) into “high” vs. “low” expression. RFS was defined as the time from diagnosis to the first recurrence, and OS as the time from diagnosis to patient death. The median follow-up for RFS was 68 months and for OS was 80 months.
Confirmatory cohorts
Two validation cohorts were established. The first cohort was (cohort 1) set up by using samples from the METABRIC project.Citation23 The entire dataset, containing 1988 patients, was downloaded from the European Genome-Phenome Archive (EGA). Median follow up for OS was 116.45 months. The raw data were re-processed to reduce the batch effects present in the original analysis. Data were summarized using the beadarray packageCitation24 in the R statistical environment (www.r-project.org). Annotation was performed using the Illumina HumanV3 database from Bioconductor. Unmapped probes were removed from the dataset (n = 319) and quantile normalization was performed across the entire dataset using the preprocess Core package.Citation25 In cases where multiple probes were linked to a single gene, the probe with the highest dynamic range was selected to represent the gene.
The second cohort (cohort 2) was obtained from The Cancer Genome Atlas dataset. Data were downloaded from the GDC data portal (https://portal.gdc.cancer.gov/). Median follow up for OS was 28.83 months. For analysis, the pre-processed level 3 data were used. Individual sample files were merged using the plyr R package as described previously.Citation26
Definition of molecular subtypes
Breast cancer intrinsic subtypes were designated according to the 2017 St Gallen guidelines.Citation27 In brief, ER negative and HER2 negative patients were designated as basal, HER2 positive ER negative patients were designated as HER2-enriched, and ER positive, HER2 negative and MKI67 low patients as Luminal A. All remaining ER positive patients were designated as Luminal B patients. Instead of using immunohistochemical results (which were available for only a proportion of patients), designation of molecular subtype was made using the gene-array or RNAseq derived gene expression.
Functional analysis of HLA-A and -B associated mutations
We used upregulated HLA samples described previously (TCGA database) to explore the pattern of mutations associated with the upregulation of HLA-A and HLA-B genes. The mutated selected genes had a correlation p value <.001. The function of the identified genes was analyzed using the gene ontology biological process classification from the Ensembl dataset (https://www.ensembl.org/index.html).
Identification of neopeptides
For each mutation in the dataset, we constructed a 9-mer peptide. The substitution position was located in the middle of the peptide, at position 5. Two sequences were constructed per mutation, one for the wild-type and the other for the mutated sequence. Both sequences were in FASTA format. The mutated peptide sequences were used as input in the NetMHC 4.0 epitope-HLA prediction.Citation28 The results for each HLA were stored in tab-delimited files. Peptides were defined as neopeptides for a certain HLA molecule when the mutated sequence was predicted to bind. Binding affinity was defined in nanoMolar units, and % Rank predicted affinity compared to a set of 400,000 random natural peptides. Those peptides with predicted % Rank < 2 were classified as binders. Peptides with % Rank > 2 were filtered out.
Prognosis of validated immune signatures
We used three immune signatures previously described (IFN gamma signature, expanded immune gene signature, and Cytotoxic T lymphocyte (CTL) level signatureCitation19,Citation20 to compare predictive value in relation to HLA-A and HLA-B expression. This comparison was performed using data from the KM Plotter Online Tool (http://www.kmplot.com) as described previously.Citation23
Statistical analysis
Cox proportional hazards regression was computed to explore the association between gene expression and outcomes. Kaplan-Meier plots were drawn to visualize the survival differences. Correlation between continuous variables was computed using Spearman correlation. Mutational status and gene expression were compared using Mann–Whitney test. Multiple genes were combined into a signature by using their mean expression. Statistical significance was defined as p < .05. Meta-analytical was performed using the inverse variance method (DerSimonian–Laird estimator for tau^2). Random effects model and Q test were used to evaluate subgroup differences. * p ≤ 0.05; ** p ≤ 0.01 and *** p ≤ 0.001.
Authors’ Contribution
AO conceived the study and did the original design of the experiments. MN, CN searched the data and JP, MN, CN, GB, and FA performed the analysis. AO, AP, EA, EMGM, and GB wrote the manuscript. All authors reviewed, included modifications and approved the final version of the manuscript.
Disclosure of potential conflict of interest
AO receives research funding from Entrechem and travel expenses from Merck.
Supplemental Material
Download PDF (224.6 KB)Supplemental Material
Download PDF (248.8 KB)Supplemental Material
Download PDF (23.5 KB)Supplementary material
Supplemental data for this article can be accessed on the publisher’s website.
Additional information
Funding
Related Research Data
References
- Ribas A, Wolchok JD. Cancer immunotherapy using checkpoint blockade. Science. 2018 Mar 23;359(6382):1350–1355. Epub 2018 Mar 22. doi:10.1126/science.aar4060.
- Luke JJ, Flaherty KT, Ribas A, Long GV. Targeted agents and immunotherapies: optimizing outcomes in melanoma. Nat Rev Clin Oncol. 2017;14:463–482. doi:10.1038/nrclinonc.2017.43.
- Sharma P, Hu-Lieskovan S, Wargo JA, Ribas A. Primary, adaptive, and acquired resistance to cancer immunotherapy. Cell. 2017;168:707–723. doi:10.1016/j.cell.2017.01.017.
- Prendergast GC, Mondal A, Dey S, Laury-Kleintop LD, Muller AJ. Inflammatory reprogramming with IDO1 inhibitors: turning immunologically unresponsive ‘cold’ tumors ‘hot’. Trends Cancer. 2018;4:38–58. doi:10.1016/j.trecan.2017.11.005.
- Goodman AM, Kato S, Bazhenova L, Patel SP, Frampton GM, Miller V, Stephens PJ, Daniels GA, Kurzrock R. Tumor mutational burden as an independent predictor of response to immunotherapy in diverse cancers. Mol Cancer Ther. 2017;16:2598–2608. doi:10.1158/1535-7163.MCT-17-0386.
- Brown SD, Warren RL, Gibb EA, Martin SD, Spinelli JJ, Nelson BH, Holt RA. Neo-antigens predicted by tumor genome meta-analysis correlate with increased patient survival. Genome Res. 2014;24:743–750. doi:10.1101/gr.165985.113.
- Kosaloglu-Yalcin Z, Lanka M, Frentzen A. Predicting T cell recognition of MHC class I restricted neoepitopes. Oncoimmunology. 2018;7(11):e1492508.
- Bethune MT, Li XH, Yu J, McLaughlin J, Cheng D, Mathis C, Moreno BH, Woods K, Knights AJ, Garcia-Diaz A, et al. Isolation and characterization of NY-ESO-1-specific T cell receptors restricted on various MHC molecules. Proc Natl Acad Sci U S A. 2018;115:E10702–e10711. doi:10.1073/pnas.1810653115.
- Leone P, Shin EC, Perosa F, Vacca A, Dammacco F, Racanelli V. MHC class I antigen processing and presenting machinery: organization, function, and defects in tumor cells. J Natl Cancer Inst. 2013;105:1172–1187. doi:10.1093/jnci/djt184.
- Chowell D, Morris LGT. Patient HLA class I genotype influences cancer response to checkpoint blockade immunotherapy. Science. 2018 Feb 2;359(6375):582–587. Epub 2017 Dec 7. doi:10.1126/science.aao4572.
- Lennerz V, Fatho M, Gentilini C, Frye RA, Lifke A, Ferel D, Wölfel C, Huber C, Wölfel T. The response of autologous T cells to a human melanoma is dominated by mutated neoantigens. Proc Natl Acad Sci U S A. 2005;102:16013–16018. doi:10.1073/pnas.0500090102.
- Heemskerk B, Kvistborg P, Schumacher TN. The cancer antigenome. Embo J. 2013;32:194–203. doi:10.1038/emboj.2012.333.
- Carbognin L, Pilotto S, Nortilli R, Brunelli M, Nottegar A, Sperduti I, Giannarelli D, Bria E, Tortora G. Predictive and prognostic role of tumor-infiltrating lymphocytes for early breast cancer according to disease subtypes: sensitivity analysis of randomized trials in adjuvant and neoadjuvant setting. Oncologist. 2016 Mar;21(3):283–291. doi:10.1634/theoncologist.2015-0307.
- Loi S, Michiels S, Salgado R, Sirtaine N, Jose V, Fumagalli D, Kellokumpu-Lehtinen P-L, Bono P, Kataja V, Desmedt C, et al. Tumor infiltrating lymphocytes are prognostic in triple negative breast cancer and predictive for trastuzumab benefit in early breast cancer: results from the FinHER trial. Ann Oncol. 2014;25:1544–1550. doi:10.1093/annonc/mdu112.
- Salgado R, Denkert C, Demaria S, Sirtaine N, Klauschen F, Pruneri G, Wienert S, Van Den Eynden G, Baehner FL, Penault-Llorca F, et al. The evaluation of tumor-infiltrating lymphocytes (TILs) in breast cancer: recommendations by an International TILs Working Group 2014. Ann Oncol. 2015 Feb;26(2):259–271. doi:10.1093/annonc/mdu450.
- Adams S, Gray RJ, Demaria S, Goldstein L, Perez EA, Shulman LN, Martino S, Wang M, Jones VE, Saphner TJ, et al. Prognostic value of tumor-infiltrating lymphocytes in triple-negative breast cancers from two phase III randomized adjuvant breast cancer trials: ECOG 2197 and ECOG 1199. J Clin Oncol. 2014;32:2959–2966. doi:10.1200/JCO.2013.55.0491.
- Malissen M, Malissen B, Jordan BR. Exon/intron organization and complete nucleotide sequence of an HLA gene. Proc Natl Acad Sci U S A. 1982;79:893–897. doi:10.1073/pnas.79.3.893.
- Zaretsky JM, Garcia-Diaz A, Shin DS, Escuin-Ordinas H, Hugo W, Hu-Lieskovan S, Torrejon DY, Abril-Rodriguez G, Sandoval S, Barthly L, et al. Mutations associated with acquired resistance to PD-1 blockade in Melanoma. N Engl J Med. 2016;375:819–829. doi:10.1056/NEJMoa1604958.
- Jiang P, Gu S, Pan D, Fu J, Sahu A, Hu X, Li Z, Traugh N, Bu X, Li B, et al. Signatures of T cell dysfunction and exclusion predict cancer immunotherapy response. Nat Med. 2018;24:1550–1558. doi:10.1038/s41591-018-0136-1.
- Ayers M, Lunceford J, Nebozhyn M, Murphy E, Loboda A, Kaufman DR, Albright A, Cheng JD, Kang SP, Shankaran V, et al. IFN-gamma-related mRNA profile predicts clinical response to PD-1 blockade. J Clin Invest. 2017;127:2930–2940. doi:10.1172/JCI91190.
- Schmid P, Adams S, Rugo HS, Schneeweiss A, Barrios CH, Iwata H, Diéras V, Hegg R, Im S-A, Shaw Wright G, et al. Atezolizumab and Nab-paclitaxel in advanced triple-negative breast cancer. N Engl J Med. 2018;379:2108–2121. doi:10.1056/NEJMoa1809615.
- Gyorffy B, Lanczky A, Eklund AC, Denkert C, Budczies J, Li Q, Szallasi Z. An online survival analysis tool to rapidly assess the effect of 22,277 genes on breast cancer prognosis using microarray data of 1,809 patients. Breast Cancer Res Treat. 2010;123:725–731. doi:10.1007/s10549-009-0674-9.
- Curtis C, Shah SP, Chin SF, Turashvili G, Rueda OM, Dunning MJ, Speed D, Lynch AG, Samarajiwa S, Yuan Y, et al. The genomic and transcriptomic architecture of 2,000 breast tumours reveals novel subgroups. Nature. 2012;486:346–352. doi:10.1038/nature10983.
- Dunning MJ, Smith ML, Ritchie ME, Tavare S. beadarray: R classes and methods for Illumina bead-based data. Bioinformatics. 2007;23:2183–2184. doi:10.1093/bioinformatics/btm311.
- Bolstad BM, Irizarry RA, Astrand M, Speed TP. A comparison of normalization methods for high density oligonucleotide array data based on variance and bias. Bioinformatics. 2003;19:185–193. doi:10.1093/bioinformatics/19.2.185.
- Mihaly Z, Kormos M, Lanczky A, Dank M, Budczies J, Szász MA, Győrffy B. A meta-analysis of gene expression-based biomarkers predicting outcome after tamoxifen treatment in breast cancer. Breast Cancer Res Treat. 2013;140:219–232. doi:10.1007/s10549-013-2622-y.
- Curigliano G, Burstein HJ, PW E, Gnant M, Dubsky P, Loibl S, Colleoni M, Regan MM, Piccart-Gebhart M, Senn H-J, et al. De-escalating and escalating treatments for early-stage breast cancer: the St. Gallen international expert consensus conference on the primary therapy of early breast cancer 2017. Ann Oncol. 2017;28:1700–1712. doi:10.1093/annonc/mdx308.
- Andreatta M, Nielsen M. Gapped sequence alignment using artificial neural networks: application to the MHC class I system. Bioinformatics. 2016;32:511–517. doi:10.1093/bioinformatics/btv639.