
ABSTRACT
In patients with cancer, the functionality of Dendritic Cells (DC) is hampered by high levels of tumor-derived suppressive cytokines, which interfere with DC development and maturation. Poor DC development can limit the efficacy of immune checkpoint blockade and in vivo vaccination approaches. Interference in intracellular signaling cascades downstream from the receptors of major tumor-associated suppressive cytokines like IL-10 and IL-6, might improve DC development and activation, and thus enhance immunotherapy efficacy. We performed exploratory functional screens on arrays consisting of >1000 human kinase peptide substrates to identify pathways involved in DC development and its inhibition by IL-10 or IL-6. The resulting alterations in phosphorylation of the kinome substrate profile pointed to glycogen-synthase kinase-3β (GSK3β) as a pivotal kinase in both DC development and suppression. GSK3β inhibition blocked human DC differentiation in vitro, which was accompanied by decreased levels of IL-12p70 secretion, and a reduced capacity for T cell priming. More importantly, adenoviral transduction of monocytes with a constitutively active form of GSK3β induced resistance to the suppressive effects of IL-10 and melanoma-derived supernatants alike, resulting in improved DC development, accompanied by up-regulation of co-stimulatory markers, an increase in CD83 expression levels in mature DC, and diminished release of IL-10. Moreover, adenovirus-mediated intratumoral manipulation of this pathway in an in vivo melanoma model resulted in DC activation and recruitment, and in improved immune surveillance and tumor control. We propose the induction of constitutive GSK3β activity as a novel therapeutic means to bolster DC functionality in the tumor microenvironment.
Introduction
Dendritic cells (DC) are the most powerful antigen-presenting cells and play a crucial role in the induction and maintenance of immune responses.Citation1 A growing number of pre-clinical reports show the feasibility of targeting and activating DC in vivo as respective means of anti-tumor vaccination and immune potentiation.Citation2–Citation4 In addition, more recent studies have demonstrated the importance of the presence of activated DC in the tumor microenvironment (TME) for the efficacy of immune checkpoint blockadeCitation5,Citation6 as well as for so-called in vivo vaccination approaches, e.g. with oncolytic viruses.Citation7 These active DC prime, attract and activate tumor-infiltrating T cells, facilitating the efficacy of e.g. PD-1 blockade.Citation5 Unfortunately, under tumor conditions DC development is often hampered, leading to a predominance of immature myeloid cells. Indeed, resistance to immunotherapies such as oncolytic virotherapy, adoptive T cell transfer, or immune checkpoint blockade can in part be explained by immunosuppressed myeloid subsets present in the tumor microenvironment.Citation8 This immune suppression is triggered by soluble factors released in response to chronic inflammation conditions in the tumor microenvironment.Citation9,Citation10 Monocytes are the main myeloid subset recruited to the tumor site,Citation11 where they are exposed to tumor-derived factors that will polarize their differentiation towards immunosuppressive subsets like M2-like macrophages, regulatory/tolerogenic dendritic cells with high production of IL-10, and myeloid-derived suppressor cells.Citation12,Citation13 These subsets will promote a tolerogenic microenvironment with high numbers of regulatory T cells that will contribute to tumor growth, survival, angiogenesis and invasion.Citation14
The major reason for disturbed DC development and functionality in patients with cancer is the production of high levels of suppressive cytokines. One of the predominant tumor-associated suppressive cytokines is IL-10.Citation15–Citation18 IL-10 can effectively block DC functionality in all developmental stages, during differentiation as well as maturation.Citation19,Citation20 We have previously shown that addition of IL-10 to fully differentiated CD1a+CD14− monocyte derived DC (MoDC) during maturation induces re-expression of the monocytic marker CD14, which is accompanied by a reduced capacity to stimulate T cell proliferation and a disturbed cytokine secretion profile.Citation4,Citation21 Even fully mature DC migrating from skin can trans-differentiate to CD14+CD163+ M2 macrophage-like cells with T cell-suppressive features under the influence of high intradermal levels of IL-10.Citation22,Citation23 These studies indicate that high IL-10 levels, which are very prevalent in a wide range of tumor types and different stages of tumor development, will interfere with activation of immunocompetent mature DC with the ability to (cross-)prime and attract anti-tumor effector T cells.
Here, we carried out exploratory screens on arrays consisting of >1000 functional kinase peptide substrates, to map pathways involved in DC differentiation and in particular inhibition by IL-10. We also explored the downstream signaling events of IL-6 as another major cancer-associated cytokine with powerful DC-suppressive effects.Citation24 Beside the STAT3 and MAPK pathways,Citation25–Citation28 we identified glycogen-synthase kinase-3β (GSK3β) as a key signaling element vital for proper DC differentiation, the activity of which was down-regulated both in IL-10 and IL-6 conditioned DC precursors. Our functional and in vivo data, with enforced expression of constitutively active GSK3β, demonstrate that therapeutic interference in tumor-related inhibition of GSK3β activity may provide a means to render DC and their precursors refractory to suppression mediated by multiple tumor-derived factors and that constitutively active GSK3β will facilitate proper DC development and maturation in situ, and so enhance T cell dependent tumor control.
Results
PepChip kinomics array analyses of human DC differentiation and suppression
A kinase peptide substrate array consisting of 1,024 peptides with specific human phosphorylation sites (PepChip kinome array, Pepscan Systems, Lelystad, the Netherlands), plotted in triplicate, was used to comprehensively explore the effects of the DC-suppressive cytokine IL-10 on the kinome of DC precursors in a parallel and comparative analysis with a DC differentiation-inducing cocktail consisting of GM-CSF, IL-4 and TNFα. To avoid donor-dependent variability, we used the human MUTZ-3 DC cell line model that we previously developed and described.Citation29,Citation30 MUTZ-3 DC precursors, consisting of CD34+ and CD14+ cells, were exposed to the cytokines; based on a 30 versus 90 minute exposure with a activation-inducing cytokine cocktail, most hits were observed after 90 minutes, which was used as exposure time in all subsequent experiments (data not shown). ) shows a detail of the developed arrays after incubation with lysates of DC precursors unexposed to cytokines or exposed to a cocktail of differentiation-inducing cytokines (GM-CSF+IL-4+ TNF-α) with examples of increased and decreased phosphorylation of substrates indicated, which resulted from altered kinase activities in the cytokine-treated cellular lysates. For all test conditions, a ranked list was made of up- or down-regulated inferred kinase activities relative to unexposed precursors. Upon differentiation-inducing cytokine exposure, rates of more than 2-fold increased or decreased kinase activities were both around 19%; for IL-10 these rates were 13% and 23%, respectively ()). In and the top 15 of peptide substrates with increased or decreased phosphorylation levels and their putative upstream kinases are listed for GM4/TNFα and IL-10, representing 10–15% of all evaluable substrates.
Table 1. Top 15 of up- and down-regulated kinase activities according to Pepchip analysis in MUTZ-3 DC precursors treated with GM-CSF+IL-4+ TNFα.
Table 2. Top 15 of up- and down-regulated kinase activities according to Pepchip analysis in MUTZ-3 DC precursors treated with IL-10.
Figure 1. Cytokine exposure alters the kinome of MUTZ-3 DC precursors. (a) Representative details from developed PepChip kinomics arrays loaded with lysates from MUTZ-3 DC precursors exposed to plain medium (baseline kinase activity) or a DC differentiation-inducing cytokine cocktail consisting of GM-CSF, IL-4 and TNFα (GM4/TNFα). Each dot represents phosphorylation of a specific peptide substrate; increased or decreased phosphorylation levels upon cytokine exposure are clearly visible by eye: respective examples are demarcated by surrounding up- or downward oriented arrowheads. (b) Factors of down- or up-regulated phosphorylation levels of all altered peptide substrates (relative to medium exposed controls) on PepChip arrays loaded with lysates from MUTZ-3 DC precursors exposed to GM4/TNF-α or IL-10 (numbers of altered substrates out of 1024 total substrates are listed). (c) GSK3β network related kinase activities deduced from Pepchip analyses of cytokine-exposed MUTZ-3 DC precursors. STRING analysis of the PepChip upstream kinase data was performed to visualize differential kinase network activities. Fold-change of GM-CSF, IL-4 and TNF-α (GM4/TNF-α) or IL10, both vs. medium control: Red is “up” (fold-change stimulus vs control >1), Green is “down” (fold-change stimulus vs control <-1); color intensities reflect levels of up- or down-regulation. Double circles indicate p38α (MAPK14), JAK2, and GSK3β signaling nodes. (d) Western Blot performed on monocytes from two different donors exposed to GM4 or GM4/IL-10 with specific detection of total GSK3β, pS9-GSK3β (inactive GSK3β) and loading control Histone H3. Proteins and their molecular weights are indicated.
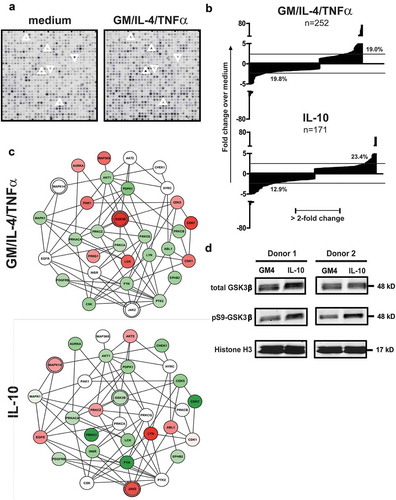
Most notably, in this exploratory screen GSK3β was identified as a promising target involved in DC differentiation and suppression: its activity was increased when applying the stimulatory GM-CSF/IL-4/TNFα cytokine cocktail (three hits in the top 15 of ranked kinases with 4.4-, 4.5- and 67-fold increases in activity, ) and down-modulated when applying IL-10 (ranked 3rd with a 6.7-fold decrease in activity, ). Of note, also in IL-6-treated DC precursors, modulated GSK3β activity featured prominently (ranked 1st with a 50-fold decrease in activity, see Supplementary Table 1).
In view of this clear and opposite modulation of GSK3β kinase activity between differentiation–inducing and inhibitory cytokines, differential kinase network activities between GM-CSF/IL-4/TNFα and IL-10 were further visualized around the GSK3β signalling node by STRING analysis (see )). The resulting networks unveiled additional differentially modulated kinase activities. Most notably, an upregulated activity of both JAK2 (of which STAT3 is a prominent substrate) and p38-MAPK in the IL-10 condition became apparent, which was in line with our previous in vitro observations in IL-10 and tumor-induced DC suppression and thus supported the validity of our data set.Citation21,Citation31
To confirm decreased GSK3β activity in IL-10-suppressed DC, we cultured monocytes from healthy donors for 6 days in the presence of differentiation-inducing cytokines (GM-CSF+IL-4), with or without immunosuppressive IL-10 (see Supplementary Figure 1a). After 6 days of culture, lysates were generated from the cultures and Western Blot (WB) analysis was performed for total GSK3β and pS9GSK3β (the phosphorylated, inactive form of GSK3β), shown in ). WB analysis indeed confirmed that there was a shift towards more inactive GSK3β in the presence of IL-10.
GSK3β inhibition hampers DC differentiation and functionality
Next, GSK3β was inhibited during MUTZ-3 DC differentiation using a small molecule inhibitor, SB 415286. After 6 days of culture, immature MUTZ3-DC were suppressed in their development by GSK3β inhibition, demonstrated by high CD14 levels and absence of the DC-specific markers CD1a and DC-SIGN ( and Supplementary Figure 2).
Figure 2. Inhibition of GSK3β hampers the differentiation of MUTZ-3 precursors and monocytes into DC. (a) Overview of the average percentages of CD14+ or CD1a+DC-SIGN+ cells in control MUTZ-DC and MUTZ-DC differentiated in the presence of the GSK3β inhibitor SB 415286 (n = 4), mean ±SD are shown. (b) Overview of the average percentages of CD14+ or CD1a+ cells in control MoDC, MoDC differentiated in the presence of the GSK3β inhibitor, MoDC differentiated with IL-10 or MoDC differentiated with IL-10 plus GSK3β inhibitor (n = 3), mean ±SEM are shown. (c) FACS histograms for the markers CD40, CD16 and BDCA3 on MoDC differentiated in the presence or absence of GSK3β inhibitor. The number listed in the graphs are the mean fluorescence intensities. Results are representative of three different experiments. (d) Secretion of relative IL-12p70 and IL-10 levels by DC treated with or without the GSK3β inhibitor; absolute average IL-12p70 and IL-10 levels in the control MoDC cultures are listed. Shown are mean ± SD from 5 experiments. (e) Overview of the average % of proliferated T cells (CD3+) induced by MoDC cultured in the absence or presence of the GSK3β inhibitor determined by allogeneic MLR. Day-6 results shown are from 3 experiments (n = 3); ratio peripheral blood lymphocytes to DC was 10:1. Significance shown as * = P < .05, ** = P < .01 and *** P < .001.
CD14+ monocytes were similarly differentiated with GM-CSF and IL-4 (GM4) into CD1a+ immature MoDC in the presence or absence of the GSK3β inhibitor (Supplementary Figure 1a). As shown in ), inhibiting GSK3β severely blocked DC differentiation. This inhibition was accompanied by down-regulation of the co-stimulatory marker CD40 and up-regulation of CD16 and CD141/BDCA3 ()), all previously identified by us as characteristic of an M2 macrophage-like phenotype, associated with MoDC suppression and an impaired capacity for T cell stimulation.Citation21,Citation23,Citation31 In keeping with this M2-like phenotype, significantly lower IL-12p70 and higher (but not significantly so) IL-10 release ()) and a reduced capacity to induce allogeneic T-cell proliferation ()) were observed. Of note, IL-10 addition and GSK3β inhibition combined had a synergistic detrimental effect on MoDC differentiation ()), evident by persistent CD14 expression and total absence of CD1a expression.
Constitutively active GSK3β renders DC differentiation and maturation refractory to the suppressive effects of IL-10
As GSK3β inactivation enabled full suppression of MoDC differentiation by IL-10, we hypothesized that, vice versa, enforced constitutive GSK3β activation might render DC refractory to the suppressive effects of IL-10. To investigate this, CD14+ primary monocytes were transduced with an adenovirus encoding a constitutively active form of GSK3β (Ad-CA.GSK3β) or with an adenovirus expressing Luciferase (Ad-LUC) as a control prior to differentiation induction (as shown in Supplementary Figure 1a). Monocytes were checked for transduction after 32h by the expression of the HA transgene tag (Supplementary Figure 3(a)) and, additionally, expression of CA.GSK3β was confirmed by western blot ()). Indeed, quantitation of WB data (n = 4) showed that the presence of IL-10 significantly increased the pS9-GSK3β/total GSK3β expression ratio in the MoDC, whereas adenovirally enforced expression of CA.GSK3β significantly reduced the ratio, even further than levels observed in non-manipulated MoDC ()). Photographs of the cultured MoDC were taken after 6 days by IncuCyte live imaging, showing the enforced expression of CA.GSK3β to preserve DC morphology ()). MoDC differentiated in the presence of IL-10 presented a rounded shape and an absence of cluster formation, indicative of poor differentiationCitation32 but when the monocytes were cultured with IL-10 and Ad-CA.GSK3β, they adopted a dendritic morphology and formed large clusters, similarly to the GM4 control (see )); this cluster formation was inversely proportional to the pS9-GSK3β/total GSK3β expression ratio ()). Consistent with this preserved DC morphology, Ad-CA.GSK3β transduction resulted in significantly lower CD14 and increased CD86 levels ()), and, in addition, reduced the expression of the suppression-related CD16 and CD141/BDCA3 markersCitation21,Citation23,Citation31 and of the IL-10-induced PD-L1 and PD-L2 immune checkpoints, see Supplementary Figure 3b. Upon an additional 24h of maturation induction in the presence of CD40L and INFγ (see Supplementary Figure 1b), even more pronounced up-regulation of the co-stimulatory marker CD86 was observed on the IL-10-conditioned DC in the presence of CA.GSK3β as well as of the maturation marker CD83 ()). These protective effects against IL-10-induced immune suppression were not observed for Ad-LUC.
Figure 3. Enforced expression of constitutively active GSK3β renders DC differentiation and maturation refractory to IL-10-mediated suppression. (a) Western Blot analysis performed on monocytes from two different donors differentiated in the presence of GM4/Ad-LUC, GM4/IL-10/Ad-LUC or GM4/IL-10/AdCA.GSK3β with specific detection of total GSK3β, pS9-GSK3β (inactive GSK3β) and loading control Histone H3. Protein names and molecular weight are indicated. (b) Averaged intensity of Western Blot bands, measured with ImageJ, from four independent analyses, for pS9-GSK3β/total GSK3β from monocytes differentiated with GM4/Ad-LUC, GM4/IL-10/Ad-LUC or GM4/IL-10/AdCA.GSK3β. (c) Images of the corresponding monocyte culture conditions were obtained at day 6 by IncuCyte. (d) Overview of the average CD14, CD86, and CD83 geometric mean intensity in MoDC differentiated with GM4/Ad-LUC, GM4/IL-10/Ad-LUC or GM4/IL-10/Ad-CA.GSK3β (n = 4), white bars: unstimulated MoDC, black bars: mDC after CD40L+INFγ stimulation. Mean ±SEM are shown. (e) Average IL-10 and IL-6 (pg/mL) release by MoDC differentiated with GM4/Ad-LUC, GM4/IL-10/Ad-LUC or GM4/IL-10/Ad-CA.GSK3β (n = 4) after CD40L+ INFγ stimulation. Mean ±SEM are shown, significance shown as * = P < .05, ** = P < .01 and *** P < .001.
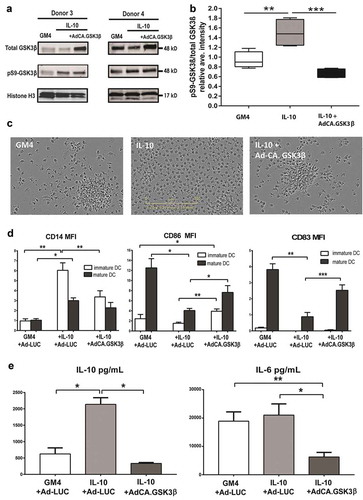
Enforced expression of CA.GSK3β significantly reduced IL-10 release by the IL-10 conditioned and CD40L/IFNγ-stimulated DC to levels equal to the GM4 control ()), demonstrating the involvement of GSK3β in IL-10 expression,Citation33,Citation34 although this was not accompanied by any significant effect on IL12-p70 secretion (data not shown). Transduction of the MoDC with Ad-CA.GSK3β also resulted in a significant reduction in IL-6 release ()).
To further study the effect of GSK3β on IL-10 exposed MoDC maturation, iMoDC were transduced with Ad-CA.GSK3β (see Supplementary Figure 1C). One day after transduction, a maturation-inducing cytokine cocktail consisting of IL-6, TNFα, IL-1β and PGE2 was added to the DC, with or without 40ng/mL IL-10. We previously showed that exposure of DC to IL-10 during their maturation led to their trans-differentiation into CD14+ macrophage-like cells with immunoregulatory qualities.Citation22 In transduced cells (identified by expression of the HA transgene marker) constitutively active GSK3β blocked the de novo expression of CD14 ()). In ) an overview of the results of 4 different experiments is shown, which clearly demonstrates the preservation of a typical CD1a+CD14− DC phenotype by transduction with Ad-CA.GSK3β. Because of variations in the percentage of cells re-expressing CD14 after maturation in the presence of IL-10, the relative percentage of CD14 expressing cells was calculated and shown to be significantly lower in Ad-CA.GSK3β-transduced DC ()).
Figure 4. Constitutively active GSK3β renders MoDC resistant to the suppressive effects of IL-10 during maturation. (a) Representative FACS dot plots showing the expression of CD14 and HA-tagged GSK3β in un-transduced MoDC and adenovirally transduced MoDC (Ad-CA.GSK3β) matured (by a cocktail of IL-6, PGE2, IL-1β, and TNFα) in the absence or presence of IL-10. Percentages of CD14+ cells are indicated; NB: in the two lower dot plots percentages CD14+ cells of transduced MoDC (i.e. HA+) are listed. (b) Expression of CD1a (black bars) and CD14 (white bars) on MoDC, matured in the absence or presence of IL-10, the latter also for transduced MoDC (Ad-CA.GSK3β or Ad-LUC), expressing constitutively active GSK3β. Shown are means ±SD from 4 experiments. (c) Overview of the relative percentages of cells expressing CD14 in control MoDC (set at 100%) and IL-10 exposed MoDC, un-transduced or transduced by Ad-CA.GSK3β. Shown are means ±SD from 4 experiment. Significance shown as * = P < .05, ** = P < .01 and *** P < .001.
Constitutively active GSK3β renders MoDC differentiation refractory to the suppressive effects of melanoma-derived soluble factors
The protective effect of CA.GSK3β against the suppressive pressure of tumor-derived soluble factors was tested using supernatants derived from three melanoma cell lines with known suppressive effects on MoDC differentiation. As shown in and ), these supernatants inhibited MoDC differentiation to varying degrees. Remarkably, the cell lines released varying but generally low levels of IL-6 (BRO: 3.65 pg/mL, MEL-JUSO 0 pg/mL, and SK-MEL-28: 0.57 pg/mL) and no IL-10, but adenoviral expression of CA.GSK3β nevertheless alleviated the observed suppression of differentiation, significantly upregulating CD1a and CD80 expression ()) and lowering CD14 as well as profoundly reducing BDCA3 expression ()). Importantly, this also translated into more favourable IL-12p70 and IL-10 release profiles ()), significantly enhanced allogeneic CD4+ and CD8+ T cell priming ()), and generally increased INF-γ/IL-10 release ratios by primed allogeneic T cells ()). The latter observation thus demonstrated enhanced type-1 effector T cell functionality in line with the observed increased IL-12p70:IL-10 ratios ()). However, and of note, similarly increased IL-4 release by the induced allogeneic T cells pointed to balanced activation of effector T cells rather than a straightforward Th1 polarization (Supplementary Figure 4).
Figure 5. Constitutively active GSK3β renders MoDC differentiation refractory to the suppressive effects of melanoma-derived soluble factors. Phenotype, cytokine release and allogeneic T cell priming capacities are shown of MoDC differentiated in the presence of supernatants derived from the indicated melanoma cell lines and transduced with Ad-LUC or Ad-CA.GSK3β. (a) Percentages of CD1a and CD80 positive cells and (b) percentages of CD14 and BDCA3 positive cells; Ad-LUC (gray boxes) or Ad-CA.GSK3β (black boxes). Shown are boxplots with whiskers from 4 different experiments. (c) IL12-p70/IL-10 release ratios; Ad-LUC (gray circles), Ad-CA.GSK3β (black squares), n = 4. (d) Percentages of proliferated CD4+ and CD8+ allogeneic T cells; Ad-LUC (gray circles) or Ad-CA.GSK3β (black squares). Day-6 results of an MLR are shown (n = 4); ratio peripheral blood lymphocytes to DC was 10:1. (e) INF-γ/IL-10 release ratios by the T cells from the MLR assay; Ad-LUC (gray circles), Ad-CA.GSK3β (black squares), n = 4. Significance shown as * = P < .05, ** = P < .01 and *** P < .001.
Constitutively active GSK3β improves tumor immune surveillance in vivo
Finally we investigated the immune modulatory in-vivo effects of adenovirally enforced expression of CA.GSK3β in the melanoma TME using the B16.OVA model in C57 BL/6J OlaHsd mice. Mice were engrafted subcutaneously with 2.5 × 10⁵ cells of the B16.OVA cell line. Once the tumors reached a diameter of 3mm the animals were randomized into the different treatment groups (n = 4 per group). Treatment schedule was as depicted in ). At day 10 after the first day of treatment mice were sacrificed to evaluate the TME composition.
Figure 6. Constitutively active GSK3β improves tumor immune surveillance in vivo. Anti-tumor efficacy and phenotypic analysis of the immune infiltrates at the tumor site 10 days after the different treatments started. (a) 4 mice per group received subcutaneous engraftment of B16.OVA tumor cells that were grown until a tumor diameter of 3mm was reached. Then 108 viral particles of non-replicating adenoviruses (coding for LUC or CA.GSK3β) or PBS were injected intratumorally at day 0, 1, 3, 6 and 9. Mice were sacrificed at day 10 and tumors were collected and processed. (b) Shows the fold increase of tumor volume defined as: (length-day10 * (width-day10)2 * 0.5)/(length-day0 * (width-day0)2 * 0.5)*100 in the different treatment groups. (c) Representative FACS histograms of the MHC-II geometric mean intensity in the CD11c+B220− conventional DC (cDC) populations in mice from different treatment groups. (d) Scatter plot of the percentage of MHC-II+CD86+ cDC. (e) Scatter plot of the percentages of CD8α+ cross-presenting cDC1s. (f) Scatter plot of the percentages of CD3+CD8+ T cells of total cells. (g) Correlation graph between the percentages of CD8α+ cDC1 (of cDC) and CD8+ T cells (of T cells) showing the 95% confidence bands of the best-fit line. Pearson r = 0.7705. (h) Correlation graph between the tumor volume fold increase and the total percentage of CD8+ T cells (of total cells) showing the 95% confidence bands of the best-fit line. Pearson r = −0.6634. The different treatment groups are shown as PBS (black triangles), Ad-LUC (black squares) and Ad-CA.GSK3β (black circles). 1-way unpaired ANOVA was applied. Shown are means ±SEM. Significance shown as * = P < .05, and ** = P < .01.
A significant reduction in the fold increase of tumor volume at day 10 was seen in those mice treated with i.t. injections of Ad-CA.GSK3β in comparison with the PBS control group, while no significant differences were observed between the other groups ()). Increased expression of MHC-II was observed on tumor-derived CD11c+B220−, conventional DC (cDC) in the mice treated with Ad-CA.GSK3β ()). Also, a significant increase in the percentage of activated cDC (MHC-II+/CD86+) was found, as shown in ). Moreover, significantly increased rates of the cross-presenting CD8α+ cDC1 subset (of CD11c+/B220−) and of CD3+CD8+ T cells were similarly observed in mice treated with Ad-CA.GSK3β (). A significant correlation between the frequency of CD8α+ cDC1 with CD8+ T cells ()) on the one hand, and of CD8+ T cells with tumor control on the other ()), confirm improved immune surveillance upon intratumoral GSK3β activation.
Discussion
DC are not only essential for the induction of the anti-tumor T cell response and the generation of long-term immune memory, but they are also vital for recruitment of effector T cells to the TME. As such they have been identified as a major target for tumor immune escape and were shown to be crucial for the efficacy of immunotherapy involving immune checkpoint blockade or adoptive cell transfer.Citation5,Citation6 The ability to modulate human DC development and maturation by interfering in signalling pathways would open the way to enhance the efficacy of immunotherapy in cancer patients through genetic modification of DC or their progenitors in the TME or through the use of clinically applicable kinase inhibitors. In this study, we therefore explored signalling events downstream of known differentiation-inducing or -suppressing cytokines. Using a peptide array of over 1000 known human kinase substrates allowed us to take a functional “snapshot” of the kinome of DC precursors derived from the human MUTZ-3 cell line and ascertain how it was modulated by a cocktail of DC differentiation inducing cytokines (GM-CSF, IL-4, TNFα) or by the cancer-associated and immune suppressive cytokines IL-10 and IL-6. Using this unbiased exploratory screening approach, we identified GSK3β as a pivotal signalling node in the control of DC differentiation.
GSK3β stood out for its altered activity after cytokine exposure with three separate hyper-phosphorylated substrates in the top 15 of the ranked list of peptides with a modulated phosphorylation state after exposure to the differentiation-inducing cytokine cocktail. This was a clear indication of its relevance to DC development. Moreover, the inferred down-regulation of GSK3β activity after exposure to either IL-10 or IL-6 further suggested that cytokine-mediated suppression of DC in general might require a shut-down of GSK3β. We were able to validate these PepChip findings by inhibition of both MUTZ-3- and MoDC differentiation by a selective GSK3β inhibitor, thus mimicking the effects of immune suppressive cytokines like IL-10 and IL-6.Citation31,Citation35 More importantly, by transducing monocytes and MoDC with an adenoviral vector encoding CA.GSK3β, we were able to overcome IL-10 mediated suppression of monocyte-to-DC differentiation and facilitate phenotypic and functional DC maturation upon stimulation. This finding indicates that inclusion of a transgene encoding constitutively active GSK3β in viral vectors targeted to DC or their immediate precursors might render the in situ transduced DC refractory to the inhibitory effects of tumor-conditioned suppressive cytokine milieus and enhance their T cell activation potential. This was further confirmed in monocyte-to-DC differentiation cultures conditioned by melanoma-derived supernatants, revealing increased resistance to melanoma-induced suppression of monocytes that were adenovirally transduced to express CA.GSK3β. Of note, the inhibitory effects of the employed melanoma cell lines could not be directly related to their release of either IL-10 or IL-6, with significant inhibition of DC differentiation observed even in the absence of either cytokine (as in the case of MEL-JUSO). Importantly, CA.GSK3β improved DC differentiation in each case, showcasing its potential efficacy under different suppressive conditions and its fundamental role in DC differentiation and activation.
The strengths and weaknesses of the employed PepChip system for functional kinome screens should be recognized. While the number of included kinase substrates allows for a comprehensive signalling analysis, the limited robustness of the system and the promiscuity of most kinases (i.e. one peptide substrate may be phosphorylated by multiple kinases, including as yet unidentified ones), limit the PepChip’s power in terms of definitive pathway analysis. Nevertheless, our data demonstrate its utility for screening for novel kinase targets in conjunction with subsequent functional validation. As such it had previously also proven its worth in the identification of signalling events accompanying cancer development and metastasis.Citation36,Citation37
GSK3β is part of a wide range of signal transduction cascades regulating cellular processes such as glycogen metabolism, differentiation, cytoskeletal organization, cell cycle regulation, proliferation, and apoptosis. GSK3β can phosphorylate several different substrates that each play a role in different cellular signalling pathways. It is well known that GSK3β controls the Wnt/β-catenin signalling pathway, which is involved in cell-cell communication, embryonic development, and cancer, and has also been implicated in DC differentiation.Citation38 Active (i.e. non-phosphorylated) GSK3β promotes degradation of β-catenin and thereby acts as a negative regulator of Wnt signalling. The involvement of the Wnt pathway in regulation of DC development was indeed suggested by our PepChip kinome analyses revealing down-regulation by the differentiation-inducing cytokine cocktail of Casein Kinase 2 (CK2) activity, based on phosphorylation of a substrate derived from T-cell Transcription Factor-4 (Tcf) (ranked 1st with a significant 16.7-fold decrease in activity, ); Tcf together with Lymphoid enhancer binding factor (Lef) forms a transcription factor complex activating transcription of target genes downstream from β-catenin.Citation39 Furthermore, presenilin, a GSK3β substrate with a 4.51-fold increased phosphorylation level under influence of the differentiation-inducing cytokine cocktail (), has been reported to interfere with β-catenin signalling.Citation40,Citation41
The direct involvement of GSK3β in inflammation mediation has been broadly studied, showing that the inhibition of GSK3β induces higher expression of IL-10 and lowers the release of pro-inflammatory cytokines such as IL-12.Citation34,Citation42,Citation43 Our findings also demonstrate that the alteration of the functionality of GSK3β directly affects the cytokines released by the DC, with significant downregulation of IL-10 production upon enforced expression of CA.GSK3β. Contrasting observations regarding the role of GSK3β in DC differentiation have been published previously.Citation33,Citation44 Of note, these seemingly contradictory observations may be explained by differences in intracellular and environmental contexts between studies, resulting in the activation of different signalling cascades which in turn may be differentially affected by GSK3β kinase activity. Indeed, most GSK3β substrates require priming/phosphorylation by other kinases. Differential priming of GSK3β substrates (e.g. by elements of the MAPK pathways involved in DC maturation) may lead to opposing effects of GSK3β activity signalling on DC development and maturation under inflammatory or suppressed conditions. Nevertheless, most studies point to a clear role of Wnt signaling in DC differentiation,Citation38,Citation45–Citation48 wherein the induction of active β-catenin in DC programs them towards a more tolerogenic state producing high levels of IL-10Citation49 as well as promoting regulatory T cell proliferation.Citation46
Both the JAK2/STAT3 and p38-MAPK pathways have been implicated in disturbed DC differentiation by us and by othersCitation25–Citation28,Citation31,Citation45,Citation50,Citation51 and both were found upregulated upon IL-10 exposure as demonstrated by our Pepchip analysis (see )). We previously showed that combined inhibition of the JAK2/STAT3 and p38-MAPK pathways consistently counteracted inhibition of MoDC differentiation by a plethora of tumor types.Citation31 We have so far been unable to specifically link these signalling events to IL-10 or indeed to any other tumor-associated cytokine. This is most likely due to the complex, concerted, and possibly synergistic effects of multiple tumor-derived suppressive factors. Interestingly, we previously found that siRNA-mediated knockdown of STAT3 also effectively prevented the generation of CD14+ cells during IL-10-modulated DC maturation induction.Citation22 As this was also achieved by transduction of the DCs with constitutively active GSK3β, this is consistent with cross-talk between these pathways. Also, p38-MAPK signalling is known to lead to GSK3β inactivation and activation of the canonical Wnt/β-catenin signalling pathway.Citation52 Indeed, p38/ERK1/2 signalling can also induce COX2 activity and so enhance the release of prostaglandin-E2 (PGE2),Citation53 which in turn can induce GSK3β phosphorylation and Wnt signalling,Citation50 and suppress DC differentiation. Qian et al. further demonstrated that ERK-mediated inactivation of GSK3 in regulatory DC led to high levels of β-catenin resulting in the secretion of IL-10.Citation54 Altogether, accumulating data point to different tumor-associated factors (e.g. IL-10, IL-6, PGE2) exerting their suppressive effects at various stages of myeloid DC development through converging and communicating signalling elements encompassing the JAK2/STAT3, p38-MAPK, and GSK3β/Wnt pathways.
Our in vivo data support the hypothesis that GSK3β activation in the TME leads to improved tumor control through activation of DC and their recruitment to the tumor site, and subsequent increases in infiltrating effector T cells. Our observation of increased rates of the cDC1 subset is highly relevant in this regard. cDC1 have previously been identified as CD8α+ and/or CD103+ in both lymphoid and peripheral organs, and also specifically in B16 tumors.Citation55–Citation59 Spranger et al. showed that these cross-priming cells were not only crucial for the priming of tumor-specific T cells but also for recruiting them to the tumor site, thus facilitating an anti-tumor immune response and enhancing the efficacy of immune checkpoint blockade.Citation6 Indeed, in keeping with these previous observations, we found significant correlations between cDC1 and CD8+ T cell rates and control of tumor outgrowth; in this context it is important to note that the numbers of mice included in this study and the duration of the experiment were based on analysis of TME immune composition rather than tumor control. Immune exclusion in melanoma, resulting from low intratumoral cDC1 rates, has been linked to activation of the Wnt/β-catenin oncogenic signalling pathway.Citation5 GSK3β is a main regulator of Wnt signalling through the canonical pathway. Activation of GSK3β will lead to the degradation of β-catenin, which could in turn help to overcome immune exclusion and facilitate improved tumor control. Although our in-vivo observations support this scenario, more extended in vivo experiments should be performed in order to address long-term benefits from the treatment.
In conclusion, our data indicate that GSK3β is an attractive target to counteract tumor-induced suppression of DC development and activation. By enforcing constitutive GSK3β activity at the tumor site, DCs may acquire resistance to tumor-imposed immune suppression and so help shape a more immune permissive TME, which in turn may increase the efficacy of immunotherapy, including oncolytic virotherapy and immune checkpoint blockade.
Materials and methods
MUTZ-3 culture, lysate preparation and kinase activity measurements
The human acute myeloid leukemia-derived cell line MUTZ-3 (DSMZ, Braunschweig, Germany), that can be differentiated to fully functional DC (MUTZ-DC),Citation29,Citation30 was maintained in culture medium, consisting of MEM-α (Gibco) supplemented with 20% Fetal Calf Serum (FCS; HyClone), 100 IU/ml sodium penicillin (Yamanouchi Pharma), 100 µg/ml streptomycin sulfate (Radiumfarma-Fisiopharma), 2 mM L-glutamine (Invitrogen Life Technologies), 0.01 mM 2-Mercapto-Ethanol (2-ME, Merck), and 10% conditioned medium from the human renal cell carcinoma cell line 5637, as described.Citation29,Citation30 Prior to kinase profiling, MUTZ-3 cells were washed and placed in low serum (1% FCS) culture medium before overnight culture at a density of 1 million/ml (to a total of 5 million cells per condition) in 6-well tissue culture plates (Greiner). Subsequently, cytokines were added for 90 minutes to study the effects of cytokine-dependent differentiation induction or inhibition of kinase activity in the DC precursors. Either a differentiation-inducing cocktail consisting of 100 ng/mL GM-CSF (Berlex), 2.5 ng/mL TNFα (R&D Systems) and 20 ng/mL IL-4 (R&D Systems) was added, or IL-10 (eBiosciences) or IL-6 (R&D Systems), both at 50 ng/ml, which are concentrations at which DC differentiation is completely blocked.Citation30,Citation31 Cells not exposed to cytokines served as negative control for baseline activity. After 90 minutes of incubation, cells were harvested and washed twice with ice-cold PBS and processed further essentially as described.Citation36,Citation60 The PepChip kinomics Array (Pepscan, Lelystad, The Netherlands) consisting of 1024 peptides representing specific human Tyrosine, Threonine and Serine phosphorylation sites was used to comprehensively evaluate the effects of the different cytokines on the kinome of the MUTZ-DC progenitors. In short, the cells were harvested in 200μl lysis buffer (Mammalian Protein Extraction Reagent) containing HALT protease inhibitor cocktail (1:100) and HALT phosphatase inhibitor cocktail (1:100) (both from Thermo Scientific). The cell lysates were diluted (1:2) in dilution buffer (50 mM HEPES-KOH, pH 7.5, 10 mM MgCl2, 10 mM MnCl2), centrifuged, and 10 µl of the activation mix (50% glycerol, 5mM DTT, 50 mM MgCl2, 50 mM MnCl2, 250 µg/ml PEG8000, 250 µg/ml BSA) with 20 μCiCitation33P-ATP (Amersham Biosciences) was added to 70 µl lysate. The mixture was centrifuged at 14000 rpm for 5 min at RT, and loaded onto the PepChips. The slides were incubated at 37°C for 2 hours in a closed humid box to allow for phosphorylation to take effect. The PepChips were then washed 3 times for 10 min with PBS, 1% SDS, 1mM DTT, followed by 3 times Milli-Q water (Merck). Subsequently, the slides were dried and exposed to a phosphor-imager screen (GE Healthcare) for 72h.
Pepchip data acquisition and statistical analyses
Data acquisition and analysis was performed as described previously.Citation36,Citation37 In short, the acquisition of the peptide array was performed using a phosphor-imager (StormTM, GE Healthcare). Each PepChip kinomics array contained 1024 human peptide sequences spotted in triplicate. Phosphorylation per substrate spot was quantified on a phosphor-imager and corrected for individual background levels using a digital grid and algorithms provided by the manufacturer. Data were normalized between replicates on a chip and between chips by intensities of control substrate spots included in the arrays. An exploratory screen with one set of arrays was performed, followed by a second, independent set, which was included for statistical significance testing. Spot densities, corrected for individual background distributions, were analysed using grid tools provided by the manufacturer. Exposed phosphor-imager screens were scanned and the obtained images from the phosphor-imager (in .GEL format, i.e. with square rooted intensity figures [Fluorescence Imaging – principles and methods, Amersham Biosciences handbook 2002–10, p.134]) with linearized intensities were quantified by ScanAlyse Software (http://graphics.stanford.edu/software/scanalyze/). Data were imported to Microsoft Excel for further analysis. Inconsistent data sets (i.e., SD between the different data points exceeding 1.96 of the mean value) were excluded from further analysis. Spots were averaged and included for dissimilarity measurement to identify induced or reduced kinase activities in the cytokine-exposed DC precursors relative to unexposed precursors. A list of peptides was generated by ranking the spots, resulting in an “up” or “down” assignation for each peptide’s phosphorylation status, which in turn was used to explore cytokine-induced changes in signalling networks.Citation36,Citation37
Statistical significance levels indicated in – (and Supplementary Table 1) were based on a t-test performed with data from two independent PepChip analyses encompassing 2 × 3 data points.
Pepchip data visualization
Upstream kinases for substrate peptides from PepChip (based on literature and provided by the manufacturer, www.pepscan.com; available on request) were mapped from HPRD (Human Protein Reference Database, http://www.hprd.org/) to SwissProt accessions using Biomart (http//www.biomart.org). In case multiple substrate peptides mapped to the same upstream kinases, the median fold change of IL-4/GM-CSF/TNFα vs control and IL-10 or IL-6 vs control were used. Upstream kinases identified in the IL-4/GM-CSF/TNFα condition and the IL-10 condition were combined and a non-redundant kinase list was imported in STRING (http//string-db.org) to derive the protein-protein connectivity table. The connectivity table was loaded in Cytoscape version 2.7 (http//www.cytoscape.org) to visualize protein-protein interactions constructed around GSK3β; nodes were intensity-colored by fold change (attribute table) for the IL-4/GM-CSF/TNFα condition and the IL-10 condition, respectively.
Melanoma cell lines, MUTZ-3 and monocyte-derived DC culture
MUTZ-3 cells were differentiated to DC as described previously.Citation61 In short, cells were differentiated for 6 days in the presence of GM-CSF (100 ng/mL), TNFα (2.5 ng/mL) and IL-4 (20 ng/mL), in the presence or absence of 10 μM SB 415286 (Merck) a selective inhibitor of GSK3β. Cytokines and GSK3β inhibitor were refreshed on day 3. After 6 days the differentiated DC were harvested and the phenotype of the DC was determined by flow cytometric analysis.
The human melanoma cell lines MEL-JUSO, BRO, and SK-MEL-28Citation62 were a kind gift from Dr. Erik Hooijberg, Dr. Saskia Cillessen and Dr. Sue Gibbs, respectively (all Amsterdam UMC, Vrije Universiteit). Their identities were confirmed by short tandem repeat (STR) analysis, using the human cell line authentication service provided by Eurofins based on 21 independent PCR-single-locus-technology, following the ISO 17025 standard guidelines (https://www.eurofinsgenomics.eu/en/genotyping-gene-expression/applied-genomics-services/cell-line-authentication/) . All melanoma cell lines were cultured in Iscove’s Modified Dulbecco’s Medium (IMDM) (BioWhittaker® by Lonza) with 10% heat inactivated (h.i.) fetal calf serum (FCS) (HyClone), 100 IU/mL sodium-penicillin, 100 μg/mL streptomycin, 2 mM L-glutamine and 50 μM β-mercaptoethanol added. Supernatants (SN) from the cell lines were collected from confluent monolayer cultures after 24h at 37°C and 5% CO2.
For the in vivo experiments, the murine melanoma cell line B16.OVA was used, kindly provided by Professor Richard Vile (Mayo Clinic, Rochester, MN, USA). This cell line was cultured in RPMI 1640 supplemented with penicillin (100U/mL), streptomycin (100 μg/mL), L-Glutamine (2mM), 10% of FBS and G-418 (5mg/mL).
MoDC were generated as described previously.Citation31 Peripheral blood mononuclear cells (PBMC) were isolated from healthy human volunteers by density centrifugation over Lymphoprep (Nycomed AS, Oslo, Norway). CD14+ monocytes were isolated from PBMC by CD14+ MACS (Miltenyi Biotec). After washing, the cells were collected for (>95%) purity check by flow cytometric analysis or differentiated for 6 days in RPMI 1640 with HEPES and L-Glutamine (Lonza BioWhittaker) supplemented with 10% fetal bovine serum (FBS; HyClone), 100 IU/ml sodium penicillin (Yamanouchi Pharma), 100 µg/ml streptomycin sulfate (Radiumfarma-Fisiopharma), 2 mM L-glutamine (Invitrogen Life Technologies), and 0.01 mM 2-ME (Merck), 100 ng/ml GM-CSF (Immunotech) and 20 ng/ml IL-4 (Strathmann Biotec, Hamburg, Germany). Monocytes were plated in a T75 flask at 4 million per flask or in a 48 well plate at a 0.12 million per well. To inhibit GSK3β signaling during DC differentiation, 10 μM SB 415286 was administered to the monocytes, 30 minutes prior to administration of GM-CSF and IL-4 (GM4) (see Supplementary Figure 1a). After 6 days of differentiation, DC were harvested and analyzed by flow cytometric analysis or cultured together with allogeneic lymphocytes in a mixed leukocyte reaction (MLR), see Supplementary Figure 1a.
To determine the effect of GSK3β activation on IL-10 and melanoma SN modulated DC differentiation, monocytes were cultured with GM-CSF (100ng/ml), IL-4 (20ng/ml), IL-10 (10 ng/ml) or exposed to 30% of melanoma-derived SN. Thirty minutes prior to administration of the cytokines or supernatants, the monocytes were transduced with an adenovirus serotype 5 containing the cDNA encoding a constitutively active form of GSK3β (Ad-CA.GSK3β; a kind gift of Dr Hyo-Soo Kim and co-workers, Seoul, Korea),Citation63 at a multiplicity of infection (MOI) of 500 pfu. An Adenovirus encoding Luciferase (Ad-LUC) was used to control for the effect of virus infection at the same MOI of 500 following the same procedure. After 6 days of differentiation, DC were either harvested and used for flow cytometric or MLR analysis or exposed to irradiated CD40L-expressing J558 cells in a 1:1 ratio together with 1000 IU/mL of recombinant human interferon gamma (rh(IFN)-γ) (e-Bioscience) in GM-CSF and IL-4 containing MoDC culture medium (see Supplementary Figure 1b); after 24h, the SN were collected and analyzed by Cytometric Bead Array (CBA) analysis using the Inflammation kit of BD Biosciences) and cells were harvested and phenotypically evaluated by flow cytometric analysis.
To determine the effects of GSK3β activation during IL-10 exposed maturation of MoDC, 6-day cultured and differentiated immature MoDC (iMoDC) were transduced with Ad-CA.GSK3β or Ad-LUC, at MOI 500 pfu. 24h after transduction, a maturation-inducing cytokine cocktail consisting of 50 ng/ml TNFα (R&D Systems), 100 ng/ml IL-6 (R&D Systems), 25 ng/ml IL-1β (R&D Systems) and 1 μg/ml PGE2 (Sigma-Aldrich) was added (with or without 40ng/mL of IL-10) (See Supplementary Figure 1c). After 48h, cells were harvested and evaluated for phenotypic maturation by flow cytometric analysis.
Incucyte live imaging
Monocytes were obtained and cultured into MoDC as previously described. Monocytes under GM4+ Ad-LUC, GM4+ IL-10+ Ad-LUC, and GM4+ IL-10+ Ad-CA.GSK3β were incubated for 6 days at 37°C and 5% CO2 in the IncuCyte® (Essen Bioscience), and pictures were taken of the culture wells every 4 hours. The images were analyzed with IncuCyte ZOOM software (Essen Bioscience).
Western blot
Cell lysates were generated using 1x RIPA buffer (ThermoFisher) in combination with protease and phosphatase inhibitor (ThermoFisher) and protein concentration was determined using the BCA Protein Assay Kit following the manufacturer’s instructions (ThermoFisher). Denatured lysates were loaded onto a pre-cast 4–20% protein gel (BioRad) and blotted using standard methods.Citation31 For protein detection, the blots were incubated overnight with primary antibodies against total GSK3β and pS9GSK3β both at 1:1000 (Cell Signaling Technology) and an antibody against Histone H3 was used as a loading control at 1:1000 (Cell Signaling Technology). Hereafter, blots were incubated for 1h with a secondary 680RD labeled antibody (Goat anti-Rabbit) in a 1:10000 dilution (LI-COR). Fluorescence detection was used to visualize the protein bands by Licor Odyssey machine. Quantification of the bands was determined by the use of ImageJ software.
In vivo study
4–6 week old C57 BL/6JOlaHsd mice were commercially obtained (Envigo, Indianapolis, IN, USA). After one week of quarantaine, mice were kept in a Biosafety level 2 facility and were subcutaneously engrafted in the left flank with 2.5 × 10⁵ of the B16.OVA cells in 100 µl of RPMI 1640 (not supplemented). When the tumors reached a volume of 3mm (after 10 days), animals were randomly assigned to the different treatment groups (n = 4 per group) and treatment commenced (at day 0); for treatment schedule see ). Mice were injected intratumorally with 50µl of PBS, Ad-LUC or Ad-CA.GSK3β, containing 108 viral particles (vp), using 30G insulin needles. Mice received the same treatment at day 0, 1, 3, 6 and 9. Tumors were measured every day after start of treatment with the use of an electronic calliper. Tumor volume was calculated as length * (width)2 * 0.5. Tumor volume fold increase was defined as (tumor volume at day 10)/(tumor volume at day 0)*100. Mice were observed daily and euthanized at a pre-determined time point (day 10) to compare the immune status of the different treatment groups. NB: one mouse in the Ad-LUC control group was lost to TME composition analysis due to an open wound on the tumor. Biological samples were then collected and processed (i.e. passed through 70 mm cell strainers in order to obtain a single-cell suspension) for analysis by Flow Cytometry.
Flow cytometry
APC-, PE-, PerCPCy5.5-, FITC-, BV711-, PECy7-, BV421, BV650- and AF700- labeled antibodies directed against human CD14, CD34, CD1a, CD40, CD16, CD4, CD8 (BD Biosciences), CD83 (Coulter Immunotech, Marseilles, France), CD209/DC-specific ICAM-grabbing nonintegrin (DC-SIGN; BD Pharmingen), CD141/BDCA3 (Miltenyi Biotec), CD80, CD86, CD1a, CD14, CD83 (BD Pharmingen), PD-L1 (eBioscience), CD40, PD-L2, CD3 (BD Horizon) and CD45, HLA-ABC (Biolegend) were used for flow cytometric analyses. Antibody staining was performed in PBS supplemented with 0.1% BSA and 0.02% sodium-azide for 30 min at 4°C. To determine DC transduction efficiency of Ad.CA.GSK3β (which also encodes the hemagglutinin (HA) marker gene), DC were harvested and permeabilized using the BD Fix-Perm kit, following manufacturer’s guidelines. After fixation and permeabilization, a FITC-labeled anti-HA antibody was added (Miltenyi Biotec). After 30 minutes incubation, cells were washed and analyzed. Analyses were performed on a FACSCalibur or Fortessa flow cytometer using Cellquest-Pro analysis software (BD Biosciences) or Kaluza flow cytometry analysis software (Beckman Coulter).
For the in vivo data, FITC-, PE-, PE-CF594-, PE-Cy5-, PerCP-Cy5.5- and PE-Cy7- labeled antibodies directed against mouse CD11c, CD86, CD8α, CD3 (BD Horizon), B220, MHC-II, CD45 (Biolegend), and CD8β (eBioscience) were used for flow cytometric analyses. Staining was performed as described above. Measurements were done with the Sony SH800Z cytometer (Sony, Tokyo, Japan) and data further analyzed with Kaluza flow cytometry analysis software (Beckman Coulter).
Mixed leukocyte reaction (MLR)
An MLR was performed with 6 day-differentiated immature MoDC (iMoDC) that were added as stimulator cells to round-bottom, 96-well, tissue-culture plates at 104/well. As responder cells, 105 peripheral blood lymphocytes (PBL) labeled with 3μM 5(6)-Carboxyfluorescein (CFSE, Sigma Aldrich) per well were used, which were obtained from PBMC after CD14+ monocyte depletion by MACS (Miltenyi Biotec). Stimulation of PBL was performed in duplicate. Unstimulated PBL were used as negative controls. Cells were cultured in IMDM (Lonza) supplemented with 10% pooled human serum (Sanquin Blood Supply, Amsterdam, The Netherlands), 100 IU/ml penicillin and 100 μg/ml streptomycin. At day 6, supernatants were collected and samples were taken from each well and T cell proliferation (by CFSE dilution) was determined by flow cytometric analysis.
Cytokine measurement
MoDC, cultured in the presence or absence of the GSK3β inhibitor SB 415286 (10 μM), or transduced by Ad-CA.GSK3β or Ad-LUC, both at a MOI of 500, were stimulated for 24 hours with interferon (IFN)-γ (e-Bioscience) and irradiated J558 cells transfected with CD40L as described previouslyCitation6. The levels of IL−12p70, IL−10, IL−6, IL−8, TNFα and IL−1β produced by the immature or mature DCs were determined by Cytometric Bead Array (CBA) analysis (BD Biosciences, San Diego CA) according to the manufacturer’s protocol (BD, 551811).
Additionally, the expression of INF-γ, IL-10 and IL-4 produced by the T cells, cultured as described in “Mixed lymphocyte reaction” paragraph, was determined using Cytometric Bead Array (CBA) analysis (BD Biosciences, San Diego CA) according to the manufacture’s protocol (BD, 560484).
Statistical analyses
Differences between test conditions were analyzed by paired 2-sided Student’s T-test, 1-way unpaired ANOVA using Fisher LSD test, or 2-way ANOVA matched multiple comparisons using Sidak corrections, in the case of the PepChip data in conjunction with False Discovery Rate analysis, using Microsoft Excel or Prism GraphPad v5.0 software. Differences were considered significant when p < .05.
Ethical statement
Experimental protocols were reviewed and approved by the ethical committee from the National Animal Experiment Board of the Regional State Administrative Agency of Southern Finland, and all the procedures were carried out in accordance with the recommendations in the Act on the Protection of Animals Used for Scientific or Educational Purpose (497/2013) and Government Decree on the Protection of Animals Used for Scientific or Educational Purposes (564/2013) as well as the European Directive2010/63/EU.
Authorship contributions
M.L.G, D.O., and J.J.L. designed and performed research, analyzed and interpreted data, and wrote the manuscript; I.M. and S.M.L. performed research and collected and analyzed data; H.D., C.R.J., and S.R.P. analyzed data; D.C.A.Q., V.C.C. and J.M.S. provided technical support; J.J. and H.M.W.V. provided materials and reagents; B.H., J.J., T.M., R.v.d.V., V.W.v.B., A.H. and R.J.S. designed research; T.D.d.G designed research, analyzed and interpreted data, and wrote the manuscript.
Conflict of interest
A.H. is shareholder in Targovax ASA and in TILT Biotherapeutics Ltd.
Supplemental Material
Download Zip (5.6 MB)Acknowledgments
The authors thank Tereza Brachtlova and Riikka Havunen for technical assistance. This study was supported by the Netherlands Organization for Scientific Research (NWO-VIDI grant 917-56-321), the Dutch Cancer Society (KWF grant 2018-12070), by a Work Visit Grant of the Amsterdam Infection and Immunity Institute, and received funding from the European Union’s Horizon 2020 research and innovation programme under grant agreement No. 643130, and from the Jane and Aatos Erkko Foundation, HUCH Research Funds (EVO), Sigrid Juselius Foundation, Finnish Cancer Organizations, University of Helsinki, and TILT Biotherapeutics Ltd.
Supplemental material
Supplemental data for this article can be accessed on the publisher’s website.
Additional information
Funding
References
- Steinman RM. Lasker basic medical research award. Dendritic cells: versatile controllers of the immune system. Nat Med. 2007;13:1155–1159. doi:10.1038/nm1643.
- Hangalapura BN, Timares L, Oosterhoff D, Scheper RJ, Curiel DT, de Gruijl TD. CD40-targeted adenoviral cancer vaccines: the long and winding road to the clinic. J Gene Med. 2012;14:416–427. doi:10.1002/jgm.1648.
- Kreutz M, Tacken PJ, Figdor CG. Targeting dendritic cells–why bother? Blood. 2013;121:2836–2844. doi:10.1182/blood-2012-09-452078.
- Steinman RM. Decisions about dendritic cells: past, present, and future. Annu Rev Immunol. 2012;30:1–22. doi:10.1146/annurev-immunol-100311-102839.
- Spranger S, Bao R, Gajewski TF. Melanoma-intrinsic beta-catenin signalling prevents anti-tumour immunity. Nature. 2015;523:231–235. doi:10.1038/nature14404.
- Spranger S, Dai D, Horton B, Gajewski TF. Tumor-residing batf3 dendritic cells are required for effector T cell trafficking and adoptive T cell therapy. Cancer Cell. 2017;31:711–723 e714. doi:10.1016/j.ccell.2017.04.003.
- Ribas A, Dummer R, Puzanov I, VanderWalde A, Andtbacka RHI, Michielin O, Olszanski AJ, Malvehy J, Cebon J, Fernandez E, et al. Oncolytic virotherapy promotes intratumoral T cell infiltration and improves anti-PD-1 immunotherapy. Cell. 2017;170:1109–1119 e1110. doi:10.1016/j.cell.2017.08.027.
- Tivnan A, Heilinger T, Lavelle EC, Prehn JH. Advances in immunotherapy for the treatment of glioblastoma. J Neurooncol. 2017;131:1–9. doi:10.1007/s11060-016-2299-2.
- Ben-Neriah Y, Karin M. Inflammation meets cancer, with NF-kappaB as the matchmaker. Nat Immunol. 2011;12:715–723. doi:10.1038/ni.2060.
- Mantovani A, Allavena P, Sica A, Balkwill F. Cancer-related inflammation. Nature. 2008;454:436–444. doi:10.1038/nature07205.
- Mantovani A, Allavena P, Sozzani S, Vecchi A, Locati M, Sica A. Chemokines in the recruitment and shaping of the leukocyte infiltrate of tumors. Semin Cancer Biol. 2004;14:155–160. doi:10.1016/j.semcancer.2003.10.001.
- Zou W. Immunosuppressive networks in the tumour environment and their therapeutic relevance. Nat Rev Cancer. 2005;5:263–274. doi:10.1038/nrc1586.
- Qin A, Coffey DG, Warren EH, Ramnath N. Mechanisms of immune evasion and current status of checkpoint inhibitors in non-small cell lung cancer. Cancer Med. 2016;5:2567–2578. doi:10.1002/cam4.819.
- Pollard JW. Tumour-educated macrophages promote tumour progression and metastasis. Nat Rev Cancer. 2004;4:71–78. doi:10.1038/nrc1256.
- Allavena P, Piemonti L, Longoni D, Bernasconi S, Stoppacciaro A, Ruco L, Mantovani A. IL-10 prevents the differentiation of monocytes to dendritic cells but promotes their maturation to macrophages. Eur J Immunol. 1998;28:359–369. doi:10.1002/(SICI)1521-4141(199801)28:01<359::AID-IMMU359>3.0.CO;2-4.
- De Smedt T, Van Mechelen M, De Becker G, Urbain J, Leo O, Moser M. Effect of interleukin-10 on dendritic cell maturation and function. Eur J Immunol. 1997;27:1229–1235. doi:10.1002/eji.1830270526.
- Enk AH, Angeloni VL, Udey MC, Katz SI. Inhibition of Langerhans cell antigen-presenting function by IL-10. A role for IL-10 in induction of tolerance. J Immunol. 1993;151:2390–2398.
- Steinbrink K, Wolfl M, Jonuleit H, Knop J, Enk AH. Induction of tolerance by IL-10-treated dendritic cells. J Immunol. 1997;159:4772–4780.
- Allavena P, Piemonti L, Longoni D, Bernasconi S, Stoppacciaro A, Ruco L, Mantovani A. IL-10 prevents the generation of dendritic cells from CD14+ blood monocytes, promotes the differentiation to mature macrophages and stimulates endocytosis of FITC-dextran. Adv Exp Med Biol. 1997;417:323–327.
- Buelens C, Verhasselt V, De Groote D, Thielemans K, Goldman M, Willems F. Interleukin-10 prevents the generation of dendritic cells from human peripheral blood mononuclear cells cultured with interleukin-4 and granulocyte/macrophage-colony-stimulating factor. Eur J Immunol. 1997;27:756–762. doi:10.1002/eji.1830270326.
- Lindenberg JJ, van de Ven R, Lougheed SM, Zomer A, Santegoets SJ, Griffioen AW, Hooijberg E, van Den Eertwegh AJ, Thijssen VL, Scheper RJ, et al. Functional characterization of a STAT3-dependent dendritic cell-derived CD14(+) cell population arising upon IL-10-driven maturation. Oncoimmunology. 2013;2:e23837. doi:10.4161/onci.23837.
- de Gruijl TD, Sombroek CC, Lougheed SM, Oosterhoff D, Buter J, van Den Eertwegh AJ, Scheper RJ, Pinedo HM. A postmigrational switch among skin-derived dendritic cells to a macrophage-like phenotype is predetermined by the intracutaneous cytokine balance. J Immunol. 2006;176:7232–7242. doi:10.4049/jimmunol.176.12.7232.
- Lindenberg JJ, Oosterhoff D, Sombroek CC, Lougheed SM, Hooijberg E, Stam AG, Santegoets SJ, Tijssen HJ, Buter J, Pinedo HM, et al. IL-10 conditioning of human skin affects the distribution of migratory dendritic cell subsets and functional T cell differentiation. PLoS One. 2013;8:e70237. doi:10.1371/journal.pone.0070237.
- Sombroek CC, Stam AG, Masterson AJ, Lougheed SM, Schakel MJ, Meijer CJ, Pinedo HM, van Den Eertwegh AJ, Scheper RJ, de Gruijl TD. Prostanoids play a major role in the primary tumor-induced inhibition of dendritic cell differentiation. J Immunol. 2002;168:4333–4343. doi:10.4049/jimmunol.168.9.4333.
- Nefedova Y, Cheng P, Gilkes D, Blaskovich M, Beg AA, Sebti SM, Gabrilovich DI. Activation of dendritic cells via inhibition of Jak2/STAT3 signaling. J Immunol. 2005;175:4338–4346. doi:10.4049/jimmunol.175.7.4338.
- Wang T, Niu G, Kortylewski M, Burdelya L, Shain K, Zhang S, Bhattacharya R, Gabrilovich D, Heller R, Coppola D, et al. Regulation of the innate and adaptive immune responses by Stat-3 signaling in tumor cells. Nat Med. 2004;10:48–54. doi:10.1038/nm976.
- Yu H, Kortylewski M, Pardoll D. Crosstalk between cancer and immune cells: role of STAT3 in the tumour microenvironment. Nat Rev Immunol. 2007;7:41–51. doi:10.1038/nri1995.
- Yu H, Pardoll D, Jove R. STATs in cancer inflammation and immunity: a leading role for STAT3. Nat Rev Cancer. 2009;9:798–809. doi:10.1038/nrc2734.
- Masterson AJ, Sombroek CC, De Gruijl TD, Graus YM, van der Vliet HJ, Lougheed SM, van Den Eertwegh AJ, Pinedo HM, Scheper RJ. MUTZ-3, a human cell line model for the cytokine-induced differentiation of dendritic cells from CD34+ precursors. Blood. 2002;100:701–703. doi:10.1182/blood.v100.2.701.
- Santegoets SJ, van Den Eertwegh AJ, van de Loosdrecht AA, Scheper RJ, de Gruijl TD. Human dendritic cell line models for DC differentiation and clinical DC vaccination studies. J Leukoc Biol. 2008;84:1364–1373. doi:10.1189/jlb.0208092.
- Oosterhoff D, Lougheed S, van de Ven R, Lindenberg J, van Cruijsen H, Hiddingh L, Kroon J, van Den Eertwegh AJ, Hangalapura B, Scheper RJ, et al. Tumor-mediated inhibition of human dendritic cell differentiation and function is consistently counteracted by combined p38 MAPK and STAT3 inhibition. Oncoimmunology. 2012;1:649–658. doi:10.4161/onci.20365.
- Tan YF, Leong CF, Cheong SK. Observation of dendritic cell morphology under light, phase-contrast or confocal laser scanning microscopy. Malays J Pathol. 2010;32:97–102.
- Rodionova E, Conzelmann M, Maraskovsky E, Hess M, Kirsch M, Giese T, Ho AD, Zoller M, Dreger P, Luft T. GSK-3 mediates differentiation and activation of proinflammatory dendritic cells. Blood. 2007;109:1584–1592. doi:10.1182/blood-2006-06-028951.
- Maixner DW, Weng HR. The role of glycogen synthase kinase 3 beta in neuroinflammation and pain. J Pharm Pharmacol. 2013;1:001. doi:10.13188/2327-204X.1000001.
- van Cruijsen H, Oosterhoff D, Lindenberg JJ, Lougheed SM, Fehres C, Weijers K, van Boerdonk R, Giaccone G, Scheper RJ, Hoekman K, et al. Glioblastoma-induced inhibition of Langerhans cell differentiation from CD34(+) precursors is mediated by IL-6 but unaffected by JAK2/STAT3 inhibition. Immunotherapy. 2011;3:1051–1061. doi:10.2217/imt.11.107.
- van Baal JW, Diks SH, Wanders RJ, Rygiel AM, Milano F, Joore J, Bergman JJ, Peppelenbosch MP, Krishnadath KK. Comparison of kinome profiles of Barrett’s esophagus with normal squamous esophagus and normal gastric cardia. Cancer Res. 2006;66:11605–11612. doi:10.1158/0008-5472.CAN-06-1370.
- Azijli K, Yuvaraj S, Peppelenbosch MP, Wurdinger T, Dekker H, Joore J, van Dijk E, Quax WJ, Peters GJ, de Jong S, et al. Kinome profiling of non-canonical TRAIL signaling reveals RIP1-Src-STAT3-dependent invasion in resistant non-small cell lung cancer cells. J Cell Sci. 2012;125:4651–4661. doi:10.1242/jcs.109587.
- Swafford D, Manicassamy S. Wnt signaling in dendritic cells: its role in regulation of immunity and tolerance. Discov Med. 2015;19:303–310.
- Tapia JC, Torres VA, Rodriguez DA, Leyton L, Quest AF. Casein kinase 2 (CK2) increases survivin expression via enhanced beta-catenin-T cell factor/lymphoid enhancer binding factor-dependent transcription. Proc Natl Acad Sci U S A. 2006;103:15079–15084. doi:10.1073/pnas.0606845103.
- Soriano S, Kang DE, Fu M, Pestell R, Chevallier N, Zheng H, Koo EH. Presenilin 1 negatively regulates beta-catenin/T cell factor/lymphoid enhancer factor-1 signaling independently of beta-amyloid precursor protein and notch processing. J Cell Biol. 2001;152:785–794. doi:10.1083/jcb.152.4.785.
- Xia X, Qian S, Soriano S, Wu Y, Fletcher AM, Wang XJ, Koo EH, Wu X, Zheng H. Loss of presenilin 1 is associated with enhanced beta-catenin signaling and skin tumorigenesis. Proc Natl Acad Sci U S A. 2001;98:10863–10868. doi:10.1073/pnas.191284198.
- Cortes-Vieyra R, Bravo-Patino A, Valdez-Alarcon JJ, Juarez MC, Finlay BB, Baizabal-Aguirre VM. Role of glycogen synthase kinase-3 beta in the inflammatory response caused by bacterial pathogens. J Inflamm (Lond). 2012;9:23. doi:10.1186/1476-9255-9-23.
- Wang H, Brown J, Garcia CA, Tang Y, Benakanakere MR, Greenway T, Alard P, Kinane DF, Martin M. The role of glycogen synthase kinase 3 in regulating IFN-beta-mediated IL-10 production. J Immunol. 2011;186:675–684. doi:10.4049/jimmunol.1001473.
- Alessandrini A, De Haseth S, Fray M, Miyajima M, Colvin RB, Williams WW, Benedict Cosimi A, Benichou G. Dendritic cell maturation occurs through the inhibition of GSK-3beta. Cell Immunol. 2011;270:114–125. doi:10.1016/j.cellimm.2011.04.007.
- Zhou J, Cheng P, Youn JI, Cotter MJ, Gabrilovich DI. Notch and wingless signaling cooperate in regulation of dendritic cell differentiation. Immunity. 2009;30:845–859. doi:10.1016/j.immuni.2009.03.021.
- Manoharan I, Hong Y, Suryawanshi A, Angus-Hill ML, Sun Z, Mellor AL, Munn DH, Manicassamy S. TLR2-dependent activation of beta-catenin pathway in dendritic cells induces regulatory responses and attenuates autoimmune inflammation. J Immunol. 2014;193:4203–4213. doi:10.4049/jimmunol.1400614.
- Valencia J, Hernandez-Lopez C, Martinez VG, Hidalgo L, Zapata AG, Vicente A, Varas A, Sacedon R. Wnt5a skews dendritic cell differentiation to an unconventional phenotype with tolerogenic features. J Immunol. 2011;187:4129–4139. doi:10.4049/jimmunol.1101243.
- Zizzari IG, Napoletano C, Botticelli A, Caponnetto S, Calabro F, Gelibter A, Rughetti A, Ruscito I, Rahimi H, Rossi E, et al. TK inhibitor pazopanib primes DCs by downregulation of the beta-catenin pathway. Cancer Immunol Res. 2018;6:711–722. doi:10.1158/2326-6066.CIR-17-0594.
- Jiang A, Bloom O, Ono S, Cui W, Unternaehrer J, Jiang S, Whitney JA, Connolly J, Banchereau J, Mellman I. Disruption of E-cadherin-mediated adhesion induces a functionally distinct pathway of dendritic cell maturation. Immunity. 2007;27:610–624. doi:10.1016/j.immuni.2007.08.015.
- Wang S, Hong S, Yang J, Qian J, Zhang X, Shpall E, Kwak LW, Yi Q. Optimizing immunotherapy in multiple myeloma: restoring the function of patients’ monocyte-derived dendritic cells by inhibiting p38 or activating MEK/ERK MAPK and neutralizing interleukin-6 in progenitor cells. Blood. 2006;108:4071–4077. doi:10.1182/blood-2006-04-016980.
- Xie J, Qian J, Yang J, Wang S, Freeman ME 3rd, Yi Q. Critical roles of Raf/MEK/ERK and PI3K/AKT signaling and inactivation of p38 MAP kinase in the differentiation and survival of monocyte-derived immature dendritic cells. Exp Hematol. 2005;33:564–572. doi:10.1016/j.exphem.2005.03.001.
- Bikkavilli RK, Feigin ME, Malbon CC. p38 mitogen-activated protein kinase regulates canonical Wnt-beta-catenin signaling by inactivation of GSK3beta. J Cell Sci. 2008;121:3598–3607. doi:10.1242/jcs.032854.
- Harizi H, Limem I, Gualde N. CD40 engagement on dendritic cells induces cyclooxygenase-2 and EP2 receptor via p38 and ERK MAPKs. Immunol Cell Biol. 2011;89:275–282. doi:10.1038/icb.2010.94.
- Qian C, Qian L, Yu Y, An H, Guo Z, Han Y, Chen Y, Bai Y, Wang Q, Cao X. Fas signal promotes the immunosuppressive function of regulatory dendritic cells via the ERK/beta-catenin pathway. J Biol Chem. 2013;288:27825–27835. doi:10.1074/jbc.M112.425751.
- Den Haan JM, Lehar SM, Bevan MJ. CD8(+) but not CD8(-) dendritic cells cross-prime cytotoxic T cells in vivo. J Exp Med. 2000;192:1685–1696. doi:10.1084/jem.192.12.1685.
- Schulz O, Reis E Sousa C. Cross-presentation of cell-associated antigens by CD8alpha+ dendritic cells is attributable to their ability to internalize dead cells. Immunology. 2002;107:183–189. doi:10.1046/j.1365-2567.2002.01513.x.
- Fujimoto K, Karuppuchamy T, Takemura N, Shimohigoshi M, Machida T, Haseda Y, Aoshi T, Ishii KJ, Akira S, Uematsu S. A new subset of CD103+CD8alpha+ dendritic cells in the small intestine expresses TLR3, TLR7, and TLR9 and induces Th1 response and CTL activity. J Immunol. 2011;186:6287–6295. doi:10.4049/jimmunol.1004036.
- Preynat-Seauve O, Schuler P, Contassot E, Beermann F, Huard B, French LE. Tumor-infiltrating dendritic cells are potent antigen-presenting cells able to activate T cells and mediate tumor rejection. J Immunol. 2006;176:61–67. doi:10.4049/jimmunol.176.1.61.
- Dunne PJ, Moran B, Cummins RC, Mills KH. CD11c+CD8alpha+ dendritic cells promote protective immunity to respiratory infection with bordetella pertussis. J Immunol. 2009;183:400–410. doi:10.4049/jimmunol.0900169.
- Parikh K, Diks SH, Tuynman JH, Verhaar A, Lowenberg M, Hommes DW, Joore J, Pandey A, Peppelenbosch MP. Comparison of peptide array substrate phosphorylation of c-Raf and mitogen activated protein kinase kinase kinase 8. PLoS One. 2009;4:e6440. doi:10.1371/journal.pone.0006440.
- Santegoets SJ, Masterson AJ, van der Sluis PC, Lougheed SM, Fluitsma DM, van Den Eertwegh AJ, Pinedo HM, Scheper RJ, de Gruijl TD. A CD34(+) human cell line model of myeloid dendritic cell differentiation: evidence for a CD14(+)CD11b(+) Langerhans cell precursor. J Leukoc Biol. 2006;80:1337–1344. doi:10.1189/jlb.0206111.
- Johnson JP, Demmer-Dieckmann M, Meo T, Hadam MR, Riethmuller G. Surface antigens of human melanoma cells defined by monoclonal antibodies. I. Biochemical characterization of two antigens found on cell lines and fresh tumors of diverse tissue origin. Eur J Immunol. 1981;11:825–831. doi:10.1002/eji.1830111015.
- Park KW, Yang HM, Youn SW, Yang HJ, Chae IH, Oh BH, Lee MM, Park YB, Choi YS, Kim HS, et al. Constitutively active glycogen synthase kinase-3beta gene transfer sustains apoptosis, inhibits proliferation of vascular smooth muscle cells, and reduces neointima formation after balloon injury in rats. Arterioscler Thromb Vasc Biol. 2003;23:1364–1369. doi:10.1161/01.ATV.0000081633.53390.B4.