
ABSTRACT
Organotypic tumor slices represent a physiologically-relevant culture system for studying the tumor microenvironment. Systematic characterization of the tumor slice culture system will enable its effective application for translational research. Here, using flow cytometry-based immunophenotyping, we performed a comprehensive characterization of the immune cell composition in organotypic tumor slices prepared from four syngeneic mouse tumor models and a human liver tumor. We found that the immune cell compositions of organotypic tumor slices prepared on the same day as the tumor cores were harvested are similar. Differences were primarily observed in the lymphocyte population of a clinical hepatocellular carcinoma case. Viable populations of immune cells persisted in the tumor slices for 7 days. Despite some changes in the immune cell populations, we showed the utility of mouse tumor slices for assessing responses to immune-modulatory agents. Further, we demonstrated the ability to use patient-derived xenograft tumor slices for assessing responses to targeted and cytotoxic drugs. Overall, tumor slices provide a broadly useful platform for studying the tumor microenvironment and evaluating the preclinical efficacy of cancer therapeutics.
Introduction
The two most daunting challenges in curing cancer are: (i) Tumor cells are heterogeneous and evolving, ultimately leading to drug resistance; and (ii) the stromal and immune cells are hijacked such that their functions in tumor surveillance and host protection are compromised. Some forms of cancer in a subset of patients have been successfully treated using immuno-oncology therapies that enable host cells to regain their normal anti-tumor functionsCitation1. However, we are still far from having effective therapies for all cancers, especially solid tumors. Furthermore, progress is limited by the lack of model systems that reflect the complexity of host-tumor cell interactions and are amenable to medium- or high-throughput assays.
Cultured cell-based approaches provide high-throughput capability within a simplified cellular context. However, cultured cell systems are limited, because they lack the native tumor microenvironment. Organoids are synthetic tissue systems that incorporate basic features of tissue architecture. Compared with cell culture systems, organoids have the advantage of including cells within a more physiological and morphologically complex context. However, these systems have a lower-throughput capability than that of cell culture systems and take weeks to months to generate.
Organotypic tumor slice cultures provide an opportunity to study tumor cell behavior in the context of an intact microenvironment and native extracellular matrix.Citation2–Citation4 Many cell types, such as immune cells, endothelial cells, and cancer cells, and morphological structures, such as blood and lymph vessels, in the native tumor slice can be easily visualized using fluorescently-conjugated antibodies and live-tissue imaging. Thus far, tumor slices have been used to test the effect of cytotoxic drugs primarily on the cancer cells in the slice.Citation4–Citation6 Moreover, a thorough systemic characterization of immune cell population and comparison of the tumor slice with its original tumor is lacking.Citation2
Here, we describe organotypic tumor slice cultures for the study of the tumor immune microenvironment and the response to immune-modulatory agents. We characterized the immune cell composition in organotypic tumor slices prepared from 4 syngeneic mouse tumor models derived from subcutaneously injected cancer cells and from a human liver cancer. We phenotyped tumor-infiltrating CD45+ leukocytes of both the tumor cores and the tumor slices by multiplex flow cytometry to understand the immune composition of these slices and how similar they are to that of the original tumors. Further, we monitored the immune cells in slices from subcutaneous mouse pancreatic or breast tumors over 7 days to understand how these populations change over time. After an initial decline in the overall cell viability, the percentage of CD45+ cells in the total viable cells was stable from days 3–7 after harvest. Among the CD45+ cells, macrophages were the predominant type of immune cell in the slices, similar to the immune cells detected in many human solid tumors.Citation7 Using the mouse pancreatic and colon cancer cell models and a clinically resected liver tumor sample, we showed that the immune cells in the slices responded predictably to an immuno-modulator, interferon γ (IFNγ) and the anti-programmed death- ligand 1 (PD-L1) check point inhibitor blockade, indicating that this platform is useful for screening immuno-modulators or combination treatments containing such agents. Finally, using samples from patient-derived xenograft (PDX) tumors, we compared organotypic tumor slices to organoid cultures from the same xenograft. We found that many responses to cytotoxic drugs and targeted therapies in organotypic tumor slices are similar to the responses of the matched organoids; however, some notable differences occur. Thus, our results showed that organotypic tumor tissue slices are an effective model system that can be used to systematically decipher the biological pathways in tumor cells, stromal cells, and tumor-associated immune cells in the context of the tumor environment.
Materials and methods
Cell culture
The syngeneic mouse tumor cell lines Py8119 breast adenocarcinoma (American Type Culture Collection (ATCC), CRL 3278); MC38 colon carcinoma (Kerafast, ENH204-FP); B16.F10 melanoma (kindly provided by Dr. Dastmalchi, University of Florida); Panc02 pancreatic ductal adenocarcinoma (kindly provided by Dr. Partecke, University of Greifswald); CT26 colon carcinoma (ATCC, CRL-2638); 4T1 breast cancer (ATCC, CRL-2539) were obtained and maintained in their respective media formulations. All the cell culture media were supplemented with 10% fetal bovine serum (FBS), 1% Penicillin-Streptomycin (P/S) antibiotic, and 500 µm of β-mercaptoethanol. Specific medium preparations for each cell line were Py8119 (F-12K base medium); MC38 (DMEM base with 2 mM glutamine, 0.1 mM nonessential amino acids, 1 mM sodium pyruvate, 10 mM HEPES and 50 µg/ml gentamycin sulfate); B16.F10 (DMEM base with 1 mM sodium pyruvate); Panc02 (DMEM base). All cells were maintained at 37°c in 5% CO2- humidified atmosphere. All the cell culture reagents were purchased from Gibco and ATCC.
Animal studies
All mouse experiments were performed according to the recommendations in the Guide for the Care and Use of Laboratory Animals of the Animal Welfare Act and the National Institutes of Health guidelines for the care and use of animals in biomedical research. Male and female C57BL/6J (B6) mice and female BALB/c mice of 6–8 week of age were obtained from the Jackson Laboratories and housed under specific pathogen-free conditions in the Fred Hutch animal facility. Gender and age were matched for all the syngeneic mouse tumor model experiments. Briefly, 1–2 × 10Citation6 syngeneic tumor cells were mixed with 50 µl of Matrigel membrane matrix (Corning, 356234) and injected subcutaneously (s.c) in the right flank of B6 or BALB/c mice using a 27 or 30g needle. The tumors were measured twice per week using digital calipers (Fisher Scientific, 1464817) and sacrificed as soon as they reached a volume of 1000 mmCitation3. In addition to syngeneic murine tumor models, we also obtained tumor samples from breast and colon PDX repositories and from a patient undergoing liver resection at the University of Washington Medical Center (UWMC) for hepatocellular carcinoma (HCC). The liver tissues were kindly provided by Dr. Yeung (UWMC) for our studies through an IRB-approved biorepository.
Organotypic tumor slice preparation
Cores of 6 mm in diameter were punched from the sacrificed murine tumors and resected liver tissue using a biopsy punch (Integra Miltex, 33–36) and stored in BELZER-UW solution (Bridge to Life Ltd). Some of the excised cores were retained for whole tumor phenotyping and the remaining were cut into 200–300 µm organotypic tumor slices using the Leica VT1200S vibratome microtome (Nussloch) with HBSS as the cutting medium. Tumor slices were cultured individually on 12-mm, 0.4-µm thick organotypic inserts or as groups of 3 in 30-mm inserts (Millipore, PICM01250) using 24-well or 6-well plates. The slices were cultured in 1 × advanced-Dulbecco’s Modified Eagle Medium (DMEM) supplemented with 5% FBS, 1× GlutaMAX, 0.5 × P/S, 1× Insulin-Transferrin-Selenium supplement. and 15 mM HEPES (pH 7.2–7.5) (all from Gibco) as previously described.Citation8 The organotypic tumor slice cultures were maintained in a 37°C incubator with a 5% CO2-humidified atmosphere. The culture medium was replaced every two to three days. A minimum of 3 tumor slices (Day 0 – Day 7) and 2 tumor cores (Day 0) were harvested from all the tumor models for immunophenotyping.
Tumor digestion
The tumor dissociation method was adapted from an existing protocol.Citation9 In brief, the tumor core was first manually chopped into smaller chunks and incubated with 2 ml of serum-free DMEM medium containing 100 µg/ml of hyaluronidase (Sigma, H3506) and 20 µl of Liberase TL (Roche, 5401020001) in a 6-well plate. This enzymatic mix was resuspended every 15 min for a period of 60–90 min until the core was completely digested. DNase-1 (6 µl; stock 4800 µ/ml) was added during the last 30 min of dissociation to avoid cell clumping. The tumor slice was dissociated using a similar procedure using 300 µl of serum-free DMEM with 100 µg/ml hyaluronidase and 3 µl of Liberase TL in a 24-well plate for 30 min. The dissociation mix was resuspended every 5–10 min, and 2 µl of DNAse-1 was added during the last 15min.
Both the dissociations were terminated by adding complete DMEM medium and then the cells were filtered through a 70-µm cell strainer to remove clumps and debris. The filtered cells were spun at 300g for 5 min, resuspended in 1× phosphate buffered saline (PBS, pH 7.4) and counted using a cell counter (Nexelcomm). This single-cell suspension of tumor cells was used for immunophenotyping by flow cytometry.
Immunophenotyping by flow cytometry
Tumor immunophenotyping was performed using two separate panels to identify the lymphoid and myeloid lineage cells. Nonspecific binding was reduced by incubating single-cell suspensions of the tumor core or slice with the Fc receptor-blocking solution containing 10% rabbit serum and anti-CD16/32 (clone 2.4G2) in staining buffer (5% FBS, 10% sodium azide in PBS) for 10 min. The cells were stained for 30 min on ice with fluorophore-conjugated antibodies purchased from Biolegend or BD Biosciences (Supplementary Table S1). After the 30 min of surface labeling, cells were washed and stained with fixable eFluor 780 dye (ebioscience, 65-0865-14) to determine overall viability for all samples. Intracellular staining for the CD68 macrophage marker was performed using ebioscience fixation (#420801) and permeabilization (#421002) solutions according to the manufacturer’s instructions. Data were acquired using the BD FACSymphony (BD biosciences) instruments and analyzed with Flowjo (Treestar). At least 30,000 events were acquired per sample. Compensation was performed using single stains; dead cells and doublets were eliminated by gating on a dye differentiating live and dead cells or on scatter characteristics or both. The immune cell populations were gated according to their known cell surface markers (), Supplementary Figure S1).
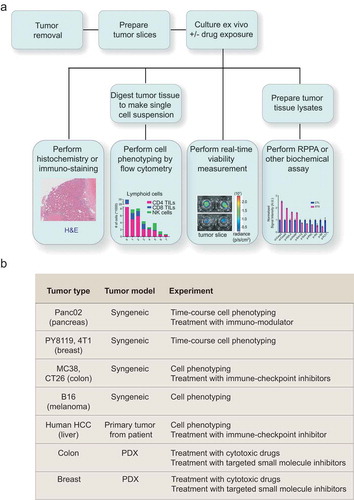
Figure 1. Organotypic tumor slices can be made from a broad range of tumor tissues and used to test multiple hypotheses. (a) A schematic showing the experimental workflows in which organotypic tumor slice cultures can be used. (b) A summary of different tumor slice cultures used in this study and the experiments performed.
Functional assays in organotypic tumor slices
For the functional assays, the cultured organotypic tumor slices were treated with immunomodulators or cytotoxic agents for fixed time points. Tissue slices were treated with 1000 and 10,000U of mouse IFN-γ (Shenandoah Biotechnology, 200-16AF) for 48–60 hr; 10 μg of human anti PD-L1 antibody (Bioxcell, BE0285), mouse anti-PD-L1 antibody (Bioxcell, BE0101), anti-cytotoxic T lymphocyte antigen 4 (CTLA-4) antibody (Bioxcell, BE0164), rat IgG2b,K (Bioxcell, BE0090) or mouse IgG2b (Bioxcell, BE0086) for 48 hr. Unstimulated and IgG treated slices served as controls and a minimum of 3 tumor slices were analyzed for each condition at the end of the assay (48–60 hr). Responses were measured by flow cytometry-based immunophenotyping or reverse-phase protein array. In addition to the lymphoid and myeloid panel used for immunophenotyping, functional assays included antibodies against activation and inhibitory markers: CD27, CD80, CD86, MHC-II, PD-1, PDL-1 and CD44 (Supplementary Table S1).
PDX tumor slices and cytotoxic drug treatment
PDX tumor slices were prepared as described previously.Citation4 Briefly, dissected PDX tumor tissues were molded into a 6 mm core using a biopsy punch. The cores were cut into 250 µm slices using Leica Vibratome VT1200. Slices were immediately placed on inserts in 24-well plates and incubated with Williams’ Medium containing 12 mM nicotinamide, 150 nM ascorbic acid, 2.25 mg/ml sodium bicarbonate, 20 mM HEPES, 50 mg/ml of additional glucose, 1 mM sodium pyruvate, 2 mM L-glutamine, 1% (v/v) ITS, 20 ng/ml EGF, 40 IU/ml penicillin and 40 ug/ml streptomycin. After 24 hours, slices were exposed to drugs at varying concentrations for 72 hours (Supplementary Table S2). Overall tumor tissue viability was measured using RealTime Glo (Promega, G9711) according to manufacturer’s instructions. Images were taken before (Day 0) and after drug treatment (Day 6) using IVIS Spectrum instrument (Perkin Elmer).
Reverse phase protein array analysis
Protein microarrays were printed and processed as described previously.Citation10 Tumor slice lysates were printed onto 16-pad nitrocellulose coated slides (Grace Biolabs, GBL505116) using Aushon 2470 microarrayer (Aushon BioSystems). Each sample was printed in triplicate and slides were stored at – 20°C until processing. RPPA slides were washed with 1 M Tris-HCl (pH 9.0) for 2–4 days to remove SDS. Slides were then washed 2–3 times with PBS for 5 min each and blocked with Odyssey Blocking Buffer (OBB) (Licor, 927–40000) for one hour at room temperature. After blocking, arrays were incubated with primary antibodies in OBB at 4°C overnight. Next day, arrays were washed thrice with PBS and incubated with IRDye labeled secondary antibodies in OBB for 1 hr at room temperature. Following incubation, slides were scanned using Licor Odyssey CLX Scanner (LiCOR). Total signal intensity from each spot was quantified using Array-Pro analyzer software package (Media Cybernetics). The measurement of a specific protein from an individual sample was normalized to total b-actin (Sigma, A1978).
Statistical analysis
Analyses were performed using GraphPad Prism 6.0 software. The graphs show standard error of means (SEM) for all the samples and comparisons were done using two-tailed unpaired student t test and 2-way ANOVA unless otherwise indicated. Statistical significance was defined as *p < .05, **p < .01, ***p < .001, ****p < .0001.
Results
Organotypic tumor tissue slices can be used to investigate multiple hypotheses through diverse experimental approaches ()). Here, we prepared tumor slices from various syngeneic mouse tumor models and assessed their immune cell populations and response to anti-cancer drugs ()).
Immunophenotyping the tumor immune microenvironment in the organotypic tumor slices and tumor tissues
The immune landscape of tumor tissue slices has previously only been characterized using limited immunohistochemistry and immunofluorescent staining techniques.Citation11–Citation13 Those studies characterized the immune cell population using limited cell surface markers, such as CD3 for T cells, F4-80 for macrophages, and CD45 for total leukocytes. To obtain a more comprehensive view of the diverse and dynamic immune landscape in tumor slices, we applied a multicolor flow cytometry-based immunophenotyping approach. Our multicolor panels with 8–10 markers could identify more than 10 immune cell populations and their functional subtypes (Supplementary Figure S1, Table S1) in single-cell suspensions of tumor cores and slices derived from syngeneic mouse tumor models and clinical human specimens. We developed a gating strategy to phenotype the immune cell populations ()).
Figure 2. Immunophenotyping of organotypic tumor slices reveals a complex immune population. (a) The gating strategy used for identifying the immune cell composition in tumor samples is represented using polychromatic dot plots of cells from a mouse tumor derived from subcutaneously injected syngeneic breast cancer cells (Py8119). Cells were analyzed on the day of tumor harvest (Day 0). Viable cells gated in the top left were depleted of doublets based on scatter plot characteristic and separated into CD45+ and CD45− populations. Lymphocytes were gated as % CD45+ cells – T cells: CD3+ B220−; B cells: B220+ CD3−. T cell subsets were gated as % CD3+ cells – CD4+ CD8− TILs and CD8+ CD4− TILs. Myeloid cells were gated as % CD45+ cells – TAM: CD11b+ F4-80+/CD11b+ CD68+/CD163+ CD66b−; TANs: CD11b+ F4-80− Ly6G+/CD11b+ CD66b+; TA-Monocytes: CD11b+ F4-80− Ly6G− Ly6C+ and TADCs: CD11b+ F4-80− Ly6G− Ly6C− CD11c+. See Supplementary Figure S1 for additional information. (b) The immune landscape of both the tumor core and organotypic tumor slices on Day 0 from various mouse syngeneic tumor models and a clinical case of HCC. N = 2–6 cores and 2–12 slices from ≥2 independent experiments for all syngeneic tumors. N = 3 cores and 3 slices for HCC clinical case. Error bars represent SEM.
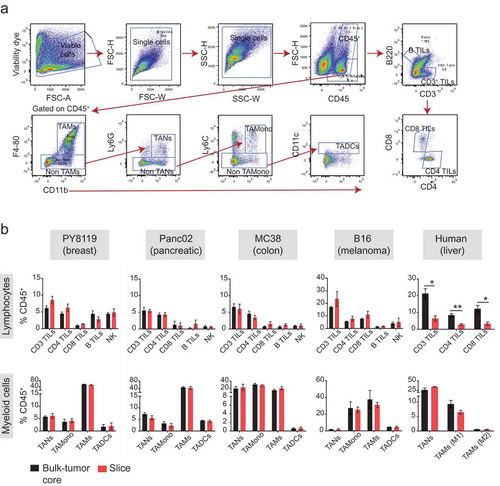
We compared the immune landscape of the tumor slice and primary tumor tissue, both prepared on the day of tumor harvest, from syngeneic mouse tumor models (breast, Py8119, 4T1; pancreatic, Panc02; colon, MC38; melanoma, B16) and a clinical sample of hepatocellular carcinoma (HCC) (), Supplementary Figure S4(a)).
Leukocytes identified by the common leukocyte antigen (CD45+) were found to infiltrate the tumor in varying proportions (5–60%) depending upon the type of tumor. Among the different leukocyte (CD45+) population that exist in mouse and human tumor samples, the following populations were immunophenotyped from both the sample sets: CD4+ and CD8+ tumor-infiltrating lymphocytes (TILs), tumor- associated macrophages (TAMs) and tumor-associated neutrophils (TANs). In addition to the above-mentioned immune cells, we also detected natural killer (NK) cells, tumor-associated dendritic cells (TADCs), tumor-infiltrating B cells (B TILs) and tumor-associated monocytes (TAMonocytes) from the mouse tumor samples. Overall, the frequencies of immune populations (presented as % of CD45+, ), Supplementary Figure S4(a)) were similar between the primary tumor and the slice; however, TILs tended to exhibit greater differences than did other types of immune cells. For example, in the clinical case of HCC, there were fewer CD3+, CD4+, and CD8+ TILs in the slices than in the tumor tissue (), right). Nonetheless, the detection of all the immune cells that are known to infiltrate the tumorCitation14–Citation16 in the tumor slice and the similarity of their immune landscape with the primary tumor indicated that the tumor slice is representative of the primary tumor tissue.
Time course phenotyping of the tumor immune compartment in organotypic tumor slice cultures
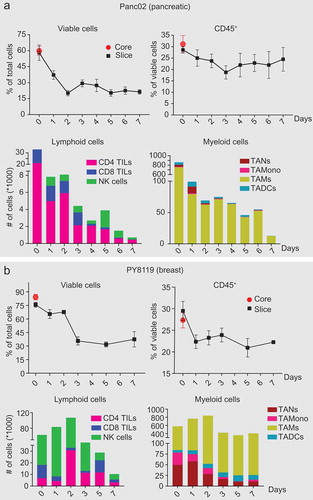
Immune cell populations have variable half-lives.Citation17,Citation18 To ascertain how the immune cell populations changed as the organotypic tumor slices were cultured, we monitored the immune cell populations daily in slices from the mouse pancreatic tumor model (Panc02) (); Supplementary Figure S2) and the mouse breast cancer tumor model (Py8119) (); Supplementary Figure S3) and (4T1) (Supplementary Figure S4(b)) for 7 days. On day 0, the total number of viable cells as measured by FACS in the tumor core and the slices for each tumor model was comparable (,b), Top & Supplementary Figure S4(b), top). The Py8119 model had higher overall viability than the Panc02 and the 4T1 model. We observed a sharp decline in viability from 24 to 48hr, which we predict relates to damage during tissue slice preparation. Overall viability was stable for each tumor model by day 3. For the 4T1 and Panc02 model, the percent of viable CD45+ TILs were consistent through day 7 (), Supplementary Figure S4 top); whereas for the Py8119 model CD45+ TILs decreased by day 1 and then remained stable through day 7 () top). The tumor models also exhibited differences in the proportions of the different populations of immune cells and differences in their dynamics (,b), and Supplementary Figure S4(b), bottom). For example, the Panc02 model was predominantly composed of TAMs (80% of myeloid cells) and CD4+ T cells (60 – 70% of lymphoid cells), whereas Py8119 and 4T1 model was enriched with TANs, TA-Monocytes, TADCs and TAMs in myeloid population and NK cells in lymphoid population. This indicated that the organotypic tumor tissue culture system reflects the unique immune characteristics of different types of tumors.Citation19 These tumor-specific immune cell characteristics also indicated that there are different tumor- and model-specific time windows for performing analysis of specific immune-targeted therapies.
Figure 3. Major immune cell populations in organotypic tumor slice cultures persist for 7 days. Immunophenotying of tumor slices from mouse tumors derived from subcutaneously injected syngeneic (a) pancreatic (Panc02) and (b) breast cancer cells (Py8119) was performed daily or every other day from Day 0 to Day 7. Plots showing (Top) percentage of viable cells and CD45+ leukocytes; (Bottom) Cell count of each of the immune cell populations in a slice. N = 4–10 slices per timepoint from 2 independent experiments. Error bars represent SEM.
Effect of IFNγ and immune checkpoint blockade on immune cell populations in organotypic tumor slice culture
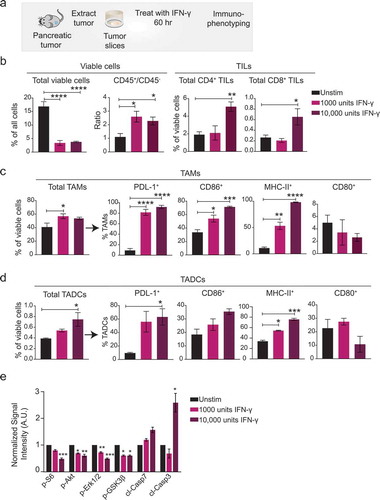
To determine if the immune cell populations in organotypic tumor slice cultures respond to immunomodulatory stimulation, we tested the response of tumor slices from the Panc02 model to the pro-inflammatory cytokine, IFNγ ()). IFNγ is an anti-viral cytokine known for its central role in the regulation of immune cascades, such as antigen presentation, cell proliferation, and cell survival, and for its pro- and anti-tumorigenic effects on the tumor microenvironment.Citation20–Citation22 We applied IFNγ to the slice cultures on day 0 and performed immunophenotyping for cell type and activation status after 60 hours. IFNγ dramatically decreased overall slice viability by 5- fold compared to untreated control slices from the same tumor ()). However, there was a 2–2.5-fold increase in the ratio of viable leukocytes (CD45+) to other cells (CD45−) in the treated slices, indicating that IFNγ was more toxic to non-leukocytes ()). Also as expected, IFNγ altered the phenotype of the tumor-infiltrating immune cells. The higher concentration of IFNγ increased the relative abundance of CD4+ and CD8+ TILs ()). TAMs and TADCs were also affected by IFNγ (,d)). IFNγ exposure significantly increased the amounts of the co-stimulatory markers CD86 and MHC-II, but not the amount of CD80, on TAMs ()). The stimulatory marker MHC-II also markedly increased on TADCs ()). IFNγ exposure also significantly increased the amount of the immune checkpoint target PDL-1 on both TAMs and TADCs (,d)), which could contribute to their pro-tumorigenic role in cancer. Finally, we evaluated aggregate changes in the growth factor signaling and apoptosis in slices treated with control or IFNγ using reverse phase proteins arrays (RPPA). We found IFNγ-treatment led to significant decrease in the phosphorylation of several kinases involved in the growth factor signaling including Erk1 and Erk2, Akt, and S6 ()). Consistently, we found IFNγ -treatment caused increase in the amounts of the apoptotic markers including cleaved caspase 3 ()). Over all, IFNγ-induced changes in the immune cell population correlated with the decline in viability of the non-leukocytes, and concomitant increase in apoptosis signaling suggesting that IFNγ triggered an immune-mediated attack on the cancer cells in the pancreatic tumor slices.
Figure 4. Stimulation of pancreatic tumor slices with IFNγ alters the immune cell population and activation state. (a) Tumors from Panc02 cells injected into syngeneic mice were harvested, slices prepared, and IFNγ was added. After 60 hr, immunophenotyping was performed. Control slices were cultured for 60 hr without IFNγ. (b) Plots showing (Left) overall viability and ratio of viable leukocytes to non-leukocytes; (Right) % of CD4+ and CD8+ TILs. Plots showing the proportion of cells positive for stimulatory or inhibitory markers on (c) TAMs and (d) TADCs. N = 3 tumor slices per treatment. Error bars represent SEM. * denotes p < .05, ** denotes p < .01, *** denotes p < .001, and **** denotes p < .0001. (e) Plot of changes in the signal intensity of proteins associated with growth factor signaling and apoptosis n Panc02 tumor slices after treatment with IFNγ as measured by RPPA. Data are normalized to the intensity for each protein in the control slices. Data are shown as mean ± SEM (N = 4). * denotes p < .05, ** denotes p < .01, *** denotes p < .001, and **** denotes p < .0001, ANOVA/Dunnet.
Next, to expand the repertoire of immune-modulatory agents, we first evaluated the response of primary HCC tumors to anti-PD-L1 blockade. Tumor slices prepared from freshly resected liver tumors from two HCC patients were exposed to anti-PD-L1 antibody or control for 48 hours and immunophenotyping was performed as described above. We found that anti-PD-L1 treatment significantly enhanced the frequency of total CD3+ T cells and cytotoxic CD8+ T cell population ()). In addition, we found a > 2-fold increase in the percentage of CD8+ T cells expressing CD27 and that the levels of CD27 on CD8+ T cells also significantly increased ()). CD27 is a marker associated with T cell memory and anti-tumor immunity,Citation23–Citation25 suggesting that these HCC tumor slices responded to the uplift of immune-suppression by PD-L1 blockade.
Figure 5. PD-L1 blockade expands and activates TIL population in HCC and CT26 tumor slices. (a–b) Slices prepared from clinical HCC samples were incubated with anti-human PD-L1 antibody or culture media for 48 hr . Immunophenotyping was performed at the end of the assay. (a) Plots showing % of CD3+ (left) and CD8+ (right) TILs. (b) Plots showing the proportion of cells positive for a stimulatory marker CD27 and its median intensity on CD8+ TILs. n = 6-9- tumor slices per treatment from two independent experiments of 2 clinical HCC cases. (c-e). Slices prepared from CT26 colon cancer model were treated with anti-PD-L1 antibody, anti-CTLA-4 antibody or their combination for 48hr followed by FACS-based imunophenotyping. Plots showing (c) % of viable CD45+ leukocytes and (d) the levels of PD-L1 on leukocytes. (e) Plots displaying (Left) % of CD3+ TILs, (Middle) the levels of activation (CD44) and (Right) inhibitory (PD-1) markers on the surface of CD3+ TILs. n = 4–8 tumor slices per treatment. Error bars represent SEM. * denotes p < .05, ** denotes p < .01, *** denotes p < .001, and **** denotes p < .0001.
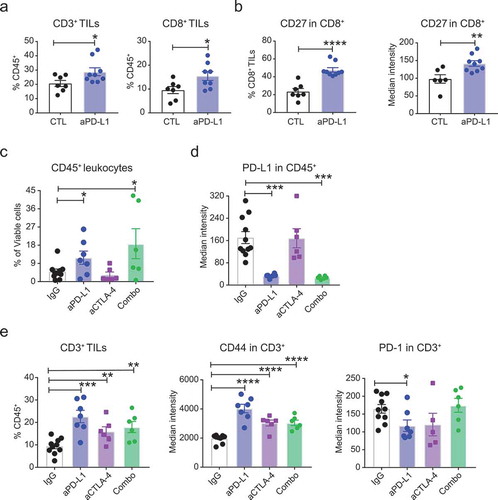
Next, we evaluated the response of CT26 tumor slices to anti-PD-L1, anti-CTLA-4 treatment or their combination. Tumor slices were exposed to anti-PD-L1 or anti-CTLA-4 antibody or their combination for 48 hr. Respective IgG antibodies were used as treatment controls. We found both PD-L1 blockade and its combination with anti-CTLA-4 treatment increased the frequency of CD45+ leukocytes on the tumor slices by 2-3-fold ()). This increase was accompanied by a substantial and significant decrease in the levels of PD-L1 on CD45+ leukocytes ()). Further, we found both anti-PD-L1 and anti-CTLA-4 antibodies and the combination treatment significantly increased the frequency of total CD3+ T cells and the levels of activation marker CD44 on these T cells (), left & middle). We also observed a significant decrease in the levels of PD-1 on CD3+ T cells upon treatment with anti-PD-L1 antibody but not with anti-CTLA-4 treatment or the combination treatment (), right). Overall, these data suggest that tumor slices and the immune components present in these slices are responsive to immunomodulators including cytokines and checkpoint inhibitors. The dynamic alteration of the immune microenvironment in response to immunomodulators and the consistency of the response with the effects of these agents in tumor cell lines and modelsCitation24,Citation26–Citation33 validates the usefulness of organotypic tumor slice culture as an exvivo and pre-clinical tumor model for testing cancer immunotherapy.
Drug response in tumor slices prepared from patient-derived xenograft models
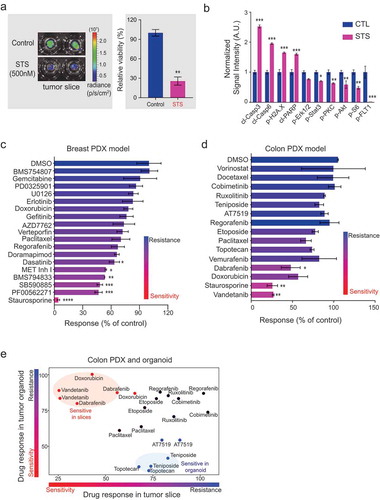
Patient-derived xenograft (PDX) models are an attractive system for testing personalized cancer treatments. PDX models are generated from tumors removed from patients and injected into an immune-compromised mouse or a mouse with a humanized immune system. We prepared organotypic tumor slices from a colon cancer PDX model.Citation34 We tested the effect of staurosporine (an inhibitor of multiple kinasesCitation35) on the viability of organotypic tumor slices from colon PDX tumors using real-time monitoring of (a) bioluminescence-based reagent (), left). A 96-hour exposure of the colon tumor slices to 500 nM staurosporine triggered a significant decrease in viability of the colon tumor slice (), right). Because staurosporine causes the accumulation of DNA damage and ultimately apoptosis,Citation36 we evaluated the relative abundance of markers of apoptosis (cleaved caspase 3, cleaved caspase 6, and cleaved PARP), a marker of DNA damage (phosphorylated H2A.X), as well as the abundance of several proteins phosphorylated by kinases inhibited by staurosporine (Erk1 and Erk2, Stat3, PKC, Akt, and S6, and FLT). Using RPPA, we found significant increases in the amounts of the apoptotic markers and the marker of DNA damage ()). Consistent with the inhibition of kinases, we observed a decrease in the amounts of phosphorylated proteins involved in growth factor signaling and responses ()). Further, we measured response to several chemotherapeutics including a panel of FDA-approved drugs in a triple negative breast cancer (TNBC)and colon PDX tumor slices (,d), Table S2). In general, we found most of the inhibitors were ineffective on tumor slices except for Met Kinase inhibitor I, BMS794833, SB590885, and PF00562271 in TNBC model and dabrafenib, doxorubicin, and vandetanib in the colon PDX model. These data are consistent with previous study of the same TNBC model showing effective response to BMS794833.Citation37 Similarly, consistent with a previous study of the organoid model from prepared from the same colon tumor,Citation34 we found that most cytotoxic drugs, including vorinostat, docetaxel, and etoposide, were ineffective on colon tumor slices ()).
Organoids are synthetic tissue systems that exhibit anchorage-independent growth and incorporate basic features of tissue architecture. Organoid models, including those derived from PDX models, are used for assessing the ex vivo efficacy of drugs. To examine the differences in drug responsiveness between organoids and organotypic tumor slice cultures, we compared the efficacy of 15 drugs in organoids and tumor slice cultures prepared from the same colon cancer PDX model. We found that the most drugs exhibited the same effect or lack thereof in both organoid and tumor slice models ()). For example, both tumor models were sensitive to paclitaxel, etoposide, and AT7519, and both were resistant to regorafenib, cobimetinib, and ruxolitinib. Notably, tumor slice cultures were more sensitive to vandetanib, dabrafenib, and doxorubicin; whereas organoids were more sensitive to teniposide and topotecan ()).
Collectively, these results demonstrate the usefulness of organotypic tumor slice culture for pharmacological testing. Furthermore, we developed a method for delivery of drugs into the tumor tissue slices using a perfusion system and a simple assay for measuring viability by bioluminescence. When combined with automated slice preparation, the drug delivery method and viability assay enable the application of organotypic tumor slice cultures for rapid testing of drug sensitivity with medium-high throughput.
Discussion
To overcome the challenges associated with cell culture and organoid models of cancer, we characterized organotypic tumor slice cultures, which are prepared from native tissues and preserve the original inter- and intra-tissue heterogeneity and the morphological organization and architecture of tumor tissue. Our work builds on decades of pioneering work from neuroscience in which brain slices are often used for studying synaptic function.Citation38,Citation39 Large numbers of thin slices of tumor (~200 – 250 μm) can be prepared with an automated vibratome, and these slices retain the original architecture and cellular composition of the tumor for days to weeks, depending on the tumor. Each slice has a consistent surface area large enough to reflect the inter- and intra-tissue heterogeneity and maintains the cellular spatial organization. Thus, compared to either cell culture systems, which lack tissue architecture and cellular heterogeneity, or organoids, which take weeks to months to generate, have limited cellular components of the tumor microenvironment, and are prone to cultivation bias and selection,Citation40 organotypic tumor slice cultures represent an ex vivo system that is fast to prepare and is highly similar to in vivo cancer.
Furthermore, we showed that the organotypic tumor slice cultures serve as a versatile platform for studying the tumor immune cell environment and its response to immune-modulatory drugs. We also provide evidence that this system represents a platform to obtain biologically relevant ex vivo data for measuring drug response. Slices prepared on the day that tumors were removed had similar numbers of viable cells and similar proportions of CD45+ immune cells as those in the tumor cores. We confirmed that the immune cell populations in the slices responded to immune modulators. For example, we observed an upregulation of co-stimulatory markers, CD86 and MHC-II, on macrophages and dendritic cells upon stimulation with the pro-inflammatory cytokine IFNγ. In addition, we demonstrate that anti-PD-L1 treatment significantly enhanced the frequency of total CD3+ T cells and cytotoxic CD8+ T cell population in HCC tumor slices (). The large number of slices that can be prepared from a tumor core enable multiple independent experiments, from in situ labeling to biochemical assays to cell phenotyping, under both control conditions and in response to pharmacological manipulation.
Comparison with organoid models revealed that the most drugs exhibited the same effect or lack thereof in both organoid and tumor slice models ()). However, tumor slice cultures were more sensitive to vandetanib, and dabrafenib; whereas organoids were more sensitive to teniposide and topotecan ()). We predict that the differences in sensitivity between the two models relate to differences in cell populations or biophysical differences, such as the stiffness of the extracellular matrix and strength of cellular attachments. For example, treatment of colon PDX slices with vandetanib (2 μM) significantly decreased overall slice viability (,e)), whereas this drug had no effect on the growth of the organoid culture ()). Vandetanib is a VEGFR inhibitor that inhibits angiogenesis.Citation4Citation2 The difference in toxicity between the PDX tissue slices and the organoid may result from the presence of endothelial cells and blood vessels only in the tissue slice system. Thus, by targeting endothelial cells in the tumor slices, vandetanib resulted in reduced viability of the cells in the PDX tumor slice preparation. These data suggested that organoids and tumor tissue cultures from the same tumor are not equivalent with regard to their pharmacological profiles.
Figure 6. Tumor tissue slices prepared from PDX models respond to various cytotoxic and targeted therapeutics. (a) Ex vivo measurement of tissue viability in colon PDX tumor slices. Left, representative IVIS images of viability signal measured in staurosporine (500 nM)-treated slices (N = 2) compared with DMSO-treated control slices (N = 3) after 96 hours. Right, Plot of total flux signal (mean ± SEM) for each treatment condition. p < .01, t-test. (b) Graph of changes in the signal intensity of proteins associated with apoptosis and growth factor signaling in colon PDX slices after treatment with staurosporine (500 nM) as measured by RPPA. Data are normalized to the intensity for each protein in the control slices. Data are shown as mean ± SEM (N ≥ 3). *** denotes p < .001, ** denotes p < .01, *denotes p < .05, t-test (corrected for multiple comparison, Holm-Sidak method). (c) Plot showing the response of breast PDX tumor slices to 18 kinase inhibitors and chemotherapeutic drugs. Data are shown as mean ± SEM (N = 3). * denotes p < .05, ** denotes p < .01, *** denotes p < .005, **** denotes p < .001, ANOVA/Dunnet. (d) Plot showing the response of colon PDX tumor slices to 15 kinase inhibitors and chemotherapeutic drugs. Data are shown as mean ± SEM (N ≥ 2). * denotes p < .05, ** denotes p < .01, ANOVA. (e) Comparison of drug responses in colon PDX tumor slices and matched PDX organoids. Drugs with greater sensitivity in tumor slices compared with organoids are shown in red circles; drugs with greater sensitivity in organoids compared with slices are shown in blue circles. Black circles are drugs with a consistent effect on both systems. Each replicate is plotted separately.
Finally, our profiling of immune cell populations in organotypic tumor slice cultures prepared from commonly used syngeneic mouse models provides a valuable resource for the cancer community interested in using these preclinical models for their studies. We anticipate that organotypic tumor slice cultures will become a valuable system for drug screening and acquiring data that can be used to predict drug responses. As the number of FDA-approved drugs increases, the desire and demand for testing combination therapies far exceed the ability to conduct such studies in patients; a surrogate platform such as the tumor slice culture provides an idea approach to address the needs for improved delivery of precision medicine.
Author Contributions
RS, MC and TSG conceived the study. MC, and JSS prepared tumor slices. RS and MC performed immune-phenotyping. MC performed the drug screen. NNA provided technical assistance with slice culture. RY and HLK provided HCC tumor samples/slices. OE, and HB provided colon PDX tumor. RS, MC and TSG wrote the manuscript.
Supplemental Material
Download PDF (27.9 MB)Acknowledgments
NNA is a recipient of the Fred Hutchinson Cancer Research Center Interdisciplinary Dual Mentor Fellowship in Cancer Research. We thank Nancy Gough for helpful comments on the manuscript. We also thank staff at the Fred Hutch Flow Cytometry Core for their help and support throughout this project.
Disclosure Statement
The authors report no conflict of interest.
Supplementary material
Supplemental data for this article can be accessed on the publisher’s website.
Additional information
Funding
Related Research Data
References
- Chen L, Han X. Anti–PD-1/PD-L1 therapy of human cancer: past, present, and future. J Clin Invest. 2015;125:1–13. doi:10.1172/JCI80011.
- Hickman JA, Graeser R, de Hoogt R, Vidic S, Brito C, Gutekunst M, van der Kuip H. Three-dimensional models of cancer for pharmacology and cancer cell biology: capturing tumor complexity in vitro/ex vivo. Biotechnol J. 2014;9:1115–1128. doi:10.1002/biot.201300492.
- Meijer TG, Naipal KA, Jager A, van Gent DC. Ex vivo tumor culture systems for functional drug testing and therapy response prediction. Future Sci OA. 2017;3:FSO190. doi:10.4155/fsoa-2017-0003.
- Vaira V, Fedele G, Pyne S, Fasoli E, Zadra G, Bailey D, Snyder E, Faversani A, Coggi G, Flavin R, et al. Preclinical model of organotypic culture for pharmacodynamic profiling of human tumors. Proc Natl Acad Sci U S A. 2010;107:8352–8356. doi:10.1073/pnas.0907676107.
- Naipal KA, Verkaik NS, Sánchez H, van Deurzen CHM, Den Bakker MA, Hoeijmakers JHJ, Kanaar R, Vreeswijk MPG, Jager A, van Gent DC. Tumor slice culture system to assess drug response of primary breast cancer. BMC Cancer. 2016;16:78. doi:10.1186/s12885-016-2119-2.
- van der Kuip H, Mürdter TE, Sonnenberg M, McClellan M, Gutzeit S, Gerteis A, Simon W, Fritz P, Aulitzky WE. Short term culture of breast cancer tissues to study the activity of the anticancer drug taxol in an intact tumor environment. BMC Cancer. 2006;6:86. doi:10.1186/1471-2407-6-86.
- Poh AR, Ernst M. Targeting macrophages in cancer: from bench to bedside. Front Oncol. 2018;8:49. doi:10.3389/fonc.2018.00049.
- Wu X, Roberto JB, Knupp A, Kenerson HL, Truong CD, Yuen SY, Brempelis KJ, Tuefferd M, Chen A, Horton H, et al. Precision-cut human liver slice cultures as an immunological platform. J Immunol Methods. 2018;455:71–79. doi:10.1016/j.jim.2018.01.012.
- Crosby EJ, Routh ED, Pullikuth A, Jin G, Su J, Chou JW, Hoadley KA, Print C, Knowlton N, Black MA, et al. Complimentary mechanisms of dual checkpoint blockade expand unique T-cell repertoires and activate adaptive anti-tumor immunity in triple-negative breast tumors. Oncoimmunology. 2018;7:e1421891. doi:10.1080/2162402X.2018.1490854.
- Sevecka M, Wolf-Yadlin A, MacBeath G. Lysate microarrays enable high-throughput, quantitative investigations of cellular signaling. Mol Cell Proteomics. 2011;10:M110–005363. doi:10.1074/mcp.M110.005363.
- Jiang X, Seo YD, Sullivan KM, Pillarisetty VG. Establishment of slice cultures as a tool to study the cancer immune microenvironment. Methods Mol Biol. 2019;1884:283–295. doi:10.1007/978-1-4939-8885-3_20.
- Peranzoni E, Bougherara H, Barrin S, Mansuet-Lupo A, Alifano M, Damotte D, Donnadieu E Ex vivo imaging of resident CD8 T lymphocytes in human lung tumor slices using confocal microscopy. J Vis Exp. 2017. doi:10.3791/55709.
- Jiang X, Seo YD, Chang JH, Coveler A, Nigjeh EN, Pan S, Jalikis F, Yeung RS, Crispe IN, Pillarisetty VG. Long-lived pancreatic ductal adenocarcinoma slice cultures enable precise study of the immune microenvironment. Oncoimmunology. 2017;6:e1333210. doi:10.1080/2162402X.2017.1333210.
- Lechner MG, et al. Immunogenicity of murine solid tumor models as a defining feature of in vivo behavior and response to immunotherapy. J Immunother (hagerstown, Md.: 1997). 2013;36:477.
- Broz ML, Binnewies M, Boldajipour B, Nelson A, Pollack J, Erle D, Barczak A, Rosenblum M, Daud A, Barber D, et al. Dissecting the tumor myeloid compartment reveals rare activating antigen-presenting cells critical for T cell immunity. Cancer Cell. 2014;26:938. doi:10.1016/j.ccell.2014.11.010.
- Azad A, Yin Lim S, D’Costa Z, Jones K, Diana A, Sansom OJ, Kruger P, Liu S, McKenna WG, Dushek O, et al. PD‐L1 blockade enhances response of pancreatic ductal adenocarcinoma to radiotherapy. EMBO Mol Med. 2017;9:167–180. doi:10.15252/emmm.201606674.
- Tough DF, Sprent J. Life span of naive and memory T cells. Stem Cells. 1995;13:242–249. doi:10.1002/stem.5530130305.
- Janssen WJ, Bratton DL, Jakubzick CV, Henson PM. Myeloid cell turnover and clearance. Microbiol Spectr. 2016;4:1–16.
- Mosely SIS, Prime JE, Sainson RCA, Koopmann J-O, Wang DYQ, Greenawalt DM, Ahdesmaki MJ, Leyland R, Mullins S, Pacelli L, et al. Rational selection of syngeneic preclinical tumor models for immunotherapeutic drug discovery. Cancer Immunol Res. 2017;5:29–41. doi:10.1158/2326-6066.CIR-16-0114.
- Schoenborn JR, Wilson CB. Regulation of interferon‐γ during innate and adaptive immune responses. Adv Immunol. 2007;96:41–101. doi:10.1016/S0065-2776(07)96002-2.
- Castro F, Cardoso AP, Gonçalves RM, Serre K, Oliveira MJ. Interferon-gamma at the crossroads of tumor immune surveillance or evasion. Front Immunol. 2018;9:847. doi:10.3389/fimmu.2018.00847.
- Mandai M, Hamanishi J, Abiko K, Matsumura N, Baba T, Konishi I. Dual faces of IFNgamma in cancer progression: a role of PD-L1 induction in the determination of pro- and antitumor immunity. Clin Cancer Res. 2016;22:2329–2334. doi:10.1158/1078-0432.CCR-16-0224.
- Reiser J, Banerjee A. Effector, memory, and dysfunctional CD8(+) T cell fates in the antitumor immune response. J Immunol Res. 2016;2016:8941260. doi:10.1155/2016/8941260.
- Gattinoni L, Lugli E, Ji Y, Pos Z, Paulos CM, Quigley MF, Almeida JR, Gostick E, Yu Z, Carpenito C, et al. A human memory T cell subset with stem cell-like properties. Nat Med. 2011;17:1290–1297. doi:10.1038/nm.2446.
- Powell DJ Jr., Dudley ME, Robbins PF, Rosenberg SA. Transition of late-stage effector T cells to CD27+ CD28+ tumor-reactive effector memory T cells in humans after adoptive cell transfer therapy. Blood. 2005;105:241–250. doi:10.1182/blood-2004-06-2482.
- Cornetta K, Berebitsky D, Behnia M, Traycoff C, Srour EF, Sledge GW. A retroviral vector expressing human interferon gamma upregulates MHC antigen expression in human breast cancer and leukemia cell lines. Cancer Gene Ther. 1994;1:91–98.
- Park IA, Hwang S-H, Song IH, Heo S-H, Kim Y-A, Bang WS, Park HS, Lee M, Gong G, Lee HJ, et al. Expression of the MHC class II in triple-negative breast cancer is associated with tumor-infiltrating lymphocytes and interferon signaling. PLoS One. 2017;12:e0182786. doi:10.1371/journal.pone.0182786.
- Detjen K, Farwig K, Welzel M, Wiedenmann B, Rosewicz S. Interferon gamma inhibits growth of human pancreatic carcinoma cells via caspase-1 dependent induction of apoptosis. Gut. 2001;49:251–262. doi:10.1136/gut.49.2.251.
- Chew V, Chen J, Lee D, Loh E, Lee J, Lim KH, Weber A, Slankamenac K, Poon RTP, Yang H, et al. Chemokine-driven lymphocyte infiltration: an early intratumoural event determining long-term survival in resectable hepatocellular carcinoma. Gut. 2012;61:427–438. doi:10.1136/gutjnl-2011-300509.
- Flecken T, Schmidt N, Hild S, Gostick E, Drognitz O, Zeiser R, Schemmer P, Bruns H, Eiermann T, Price DA, et al. Immunodominance and functional alterations of tumor-associated antigen-specific CD8+ T-cell responses in hepatocellular carcinoma. Hepatology. 2014;59:1415–1426. doi:10.1002/hep.26731.
- Selby MJ, Engelhardt JJ, Johnston RJ, Lu L-S, Han M, Thudium K, Yao D, Quigley M, Valle J, Wang C, et al. Preclinical development of ipilimumab and nivolumab combination immunotherapy: mouse tumor models, in vitro functional studies, and cynomolgus macaque toxicology. PLoS One. 2016;11:e0161779. doi:10.1371/journal.pone.0161779.
- Binder DC, Schreiber H. Dual blockade of PD-1 and CTLA-4 combined with tumor vaccine effectively restores T-cell rejection function in tumors–letter. Cancer Res. 2014;74:632; discussion 635. doi:10.1158/0008-5472.CAN-13-3514.
- Beavis PA, Henderson MA, Giuffrida L, Davenport AJ, Petley EV, House IG, Lai J, Sek K, Milenkovski N, John LB, et al. Dual PD-1 and CTLA-4 checkpoint blockade promotes antitumor immune responses through CD4(+)Foxp3(-) cell-mediated modulation of CD103(+) dendritic cells. Cancer Immunol Res. 2018;6:1069–1081. doi:10.1158/2326-6066.CIR-18-0291.
- Pauli C, Hopkins BD, Prandi D, Shaw R, Fedrizzi T, Sboner A, Sailer V, Augello M, Puca L, Rosati R, et al. Personalized in vitro and in vivo cancer models to guide precision medicine. Cancer Discov. 2017;7:462–477. doi:10.1158/2159-8290.CD-16-1154.
- Bello T, Gujral TS. KInhibition: a kinase inhibitor selection portal. iScience. 2018;8:49–53. doi:10.1016/j.isci.2018.09.009.
- Bertrand R, Solary E, O’Connor P, Kohn KW, Pommier Y. Induction of a common pathway of apoptosis by staurosporine. Exp Cell Res. 1994;211:314–321. doi:10.1006/excr.1994.1093.
- Bruna A, Rueda OM, Greenwood W, Batra AS, Callari M, Batra RN, Pogrebniak K, Sandoval J, Cassidy JW, Tufegdzic-Vidakovic A, et al. A biobank of breast cancer explants with preserved intra-tumor heterogeneity to screen anticancer compounds. Cell. 2016;167:260–274. e222. doi:10.1016/j.cell.2016.08.041.
- Knowles WD, Schwartzkroin PA. Local circuit synaptic interactions in hippocampal brain slices. J Neurosci. 1981;1:318–322.
- Teyler TJ. Brain slice preparation: hippocampus. Brain Res Bull. 1980;5:391–403. doi:10.1016/s0361-9230(80)80009-8.
- Dahl-Jensen S, Grapin-Botton AJD. The physics of organoids: a biophysical approach to understanding organogenesis. Development. 2017;144:946–951. doi:10.1242/dev.143693.
- Li L, Yu J, Jiao S, Wang W, Zhang F, Sun S. Vandetanib (ZD6474) induces antiangiogenesis through mTOR–HIF-1 alpha–VEGF signaling axis in breast cancer cells. Onco Targets Ther. 2018;11:8543. doi:10.2147/OTT.