
ABSTRACT
The efficacy of cancer immunotherapy may be improved by increasing the number of circulating tumor-reactive T cells. The bone marrow is a priming site and reservoir for such T cells. The characteristics of bone marrow-derived tumor-reactive T cells are poorly understood in patients with non-small-cell lung cancer (NSCLC). To compare the responsiveness of tumor antigen-reactive T cells from the bone marrow with matched peripheral blood samples in patients with resectable NSCLC, we used flow cytometry, cytokine capture assays and enzyme-linked immunospot assays to examine the responsiveness of T cells to 14 tumor antigens in matched bone marrow and peripheral blood samples from patients with resectable NSCLC or benign tumors and tumor-free patients. T cells with reactivity to tumor antigens were detected in the bone marrow of 20 of 39 (51%) NSCLC patients. The panel of tumor antigens recognized by bone marrow-derived T cells was distinct from that recognized by peripheral blood-derived T cells in NSCLC patients. Unlike for peripheral blood T cells, the presence of tumor-reactive T cells in the bone marrow did not correlate with recurrence-free survival after curative intent resection of NSCLC. T cells with reactivity to tumor antigens are common in the bone marrow of patients with NSCLC. Tumor-reactive T cells of the bone marrow have the potential to significantly broaden the total repertoire of tumor-reactive T cells in the body. To clarify the role of tumor-reactive T cells of the bone marrow in T cell-based immunotherapy approaches, clinical studies are needed (ClinicalTrials.gov: NCT02515760).
Introduction
Lung cancer is one of the most frequently diagnosed malignancies and the leading cause of cancer-related death.Citation1 Non-small-cell lung cancer (NSCLC) constitutes nearly 85% of all new cases.Citation2 Following complete resection and adjuvant chemotherapy, the 5-year survival rate of patients with NSCLC is only approximately 60%, mostly due to postoperative recurrence.Citation3,Citation4 Moreover, the clinical benefits that are expected from targeted therapies are limited in the adjuvant setting.Citation5 The approval of checkpoint inhibitor therapies has provided new therapeutic options for treating lung cancer. However, response rates are approximately 25% in most trials.Citation6,Citation7 As shown in our previous study, the peripheral blood from patients with NSCLC harbors tumor-reactive T cells, and the presence of these circulating T cells correlates with improved recurrence-free survival (RFS).Citation8 However, peripheral blood T cells represent only 2 to 2.5% of the total T cell population in the body.Citation9 A tempting speculation is that the effectiveness of checkpoint inhibitor therapy would be enhanced by properly mobilizing preexisting tumor-reactive T cells from other anatomical sites. The bone marrow is a priming site and reservoir for T cells specific for blood-borne tumor-associated antigens (TAs).Citation10–Citation12 The presence of functional tumor-reactive T cells in the bone marrow has been reported in solid cancers.Citation13–Citation15 However, little is known about tumor-reactive bone marrow-derived T cells (BMTCs) in NSCLC. Data on bone marrow physiology are lacking because the bone marrow is surrounded by thick cortical bone, which impedes direct observations and experimental approaches.Citation16 This prospective study was conducted in a cohort of patients undergoing surgery for NSCLC, where bone marrow puncture could be performed under the same general anesthesia. The main objective was to compare the responsiveness of T cells from the bone marrow to a panel of tumor-associated antigens with the responsiveness of matched peripheral blood T cellsCitation8 in patients with resectable NSCLC. Secondary objectives were to determine the functional activity and frequencies of T cell subgroups in the bone marrow and finally to correlate these findings with RFS.
Results
Study population
Sixty-five patients undergoing curative intent lung cancer surgery were enrolled for bone marrow and corresponding peripheral blood analyses. Of these patients, 34 remained enrolled for the RFS analysis (Figure, Supplemental Data 1). The characteristics of the 34 enrolled patients with bone marrow and matched peripheral blood samples are summarized in . We previously published some of these characteristics in a study on peripheral blood samples obtained from 51 patients with NSCLC.Citation8
Table 1. Characteristics of the 34 patients with NSCLC who were assessed for the presence of bone marrow- and peripheral blood-derived TA-reactive T cells using the ELISPOT analysis.
TA-reactive T cells frequently reside in the bone marrow
We assessed endogenous T cell responses to a panel of synthetic peptides of 14 well-described NSCLC-associated antigens using an IFN-γ ELISPOT assay as described previously.Citation8 Figure, Supplemental Data 2 illustrates the data from one exemplary patient with NSCLC. Data on the presence of these TA-reactive T cells were available from the peripheral blood and corresponding bone marrow of 39 patients. We detected BMTCs that reacted to any of the tested TAs in approximately 50% of the patients with NSCLC (20 of 39 patients) (). Due to the small number of cases, no statistically reliable comparisons could be made among patients with adenocarcinoma, adenosquamous carcinoma, squamous cell carcinoma or large cell carcinoma in the ELISPOT assays. The subgroups were therefore summarized as NSCLC. In terms of response, patients with NSCLC mostly showed BMTC reactivity to 2 or 3 TAs (). Four of the 5 patients with benign tumors and 4 of the 7 tumor-free patients also presented TA-reactive T cells in the bone marrow, suggesting that the spontaneous T cell reactivity toward TAs in the bone marrow is not exclusively related to NSCLC (). The frequencies of TA-reactive T cells in the peripheral blood were significantly higher (p = .0028) than those in the corresponding NSCLC bone marrow samples (), and this pattern was not different from that observed in the tumor-free patients (p = .4687), while the opposite pattern was observed in patients with benign tumors (p < .0001) (). T cell reactivity, as determined by the mean IFN-γ spot counts divided by the negative control spot count, was lower in the bone marrow from the patients with NSCLC than that in the bone marrow from the patients with benign tumors and tumor-free patients (). A comparison of the total number of TAs recognized per patient in both compartments revealed significantly higher frequencies in the bone marrow and peripheral blood combined than those in either of these compartments alone, indicating that the TA-reactive T cell repertoire in the bone marrow significantly expands the total endogenous TA-reactive T cell repertoire (). The most commonly recognized TAs in the bone marrow of patients with NSCLC, which were different from the TAs recognized in the peripheral blood, were p53, heparanase, MUC-1 and EGFR (). We detected BMTC responses to 11 of the 14 tested peptides in the 5 patients with benign tumors and against only 6 of the 14 tested peptides in the tumor-free patients (). The mean IFN-γ spot counts in the bone marrow were significantly increased for RHAMM in patients with NSCLC (Figure, Supplemental Data 3A) and for EGFR, survivin, MAGE-A3, RHAMM and WT-1 in the patients with benign tumors (Figure, Supplemental Data 3B).
Figure 1. (A) Response rates of PBTCs (PB samples available from n = 51 patients) and BMTCs (BM samples available from n = 39 patients) to TAs in the patients with NSCLC or benign tumors or tumor-free patients categorized by the number of different TAs recognized, as determined using the ELISPOT assay. (B) Higher frequencies of TA-specific TCs were observed in the PB than in the BM in NSCLC patients. The fold increase was calculated by comparing the mean IFN-γ spot count with the count of the IgG controls for all TA-containing wells used to assess samples from the patients with NSCLC or benign tumors or tumor-free patients with ELISPOT. P-values were determined using two-tailed Mann-Whitney and Wilcoxon matched-pairs signed rank tests. (C) – (D) Data from the 39 patients with PB and corresponding BM samples illustrating the response rate in responders alone, as determined using the ELISPOT assay (C), and the total number of TAs recognized per patient in the different compartments (D). (A) – (D) For a better visualization of TC responsiveness in BM versus PB, we show PB data that were published in our previous study.Citation8 P-values were determined using two-tailed Wilcoxon matched-pairs signed rank tests. Ad/CMV, adenovirus/cytomegalovirus; BM, bone marrow; ELISPOT, enzyme-linked immunospot; PB, peripheral blood; PBTCs, peripheral blood-derived T cells; TA, tumor-associated antigen.
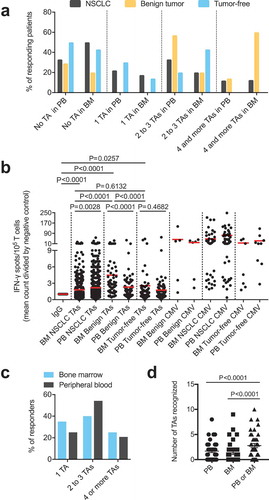
Figure 2. (A) – (C) Response rates for each of the 14 TA-specific peptides in the BM from the patients with NSCLC compared with those for patients with benign tumors or tumor-free patients. (D) – (F) Response rates for each of the 14 TA-specific peptides in the PB and BM from the patients with NSCLC or benign tumors or the tumor-free patients. Numerical data “X/Y” indicate the number of patients with PBTCs responding to a particular TA (X) relative to the total number of patients tested for TA responsiveness (Y). (D) – (F) For a better visualization of TC responsiveness in BM and PB, we show PB data that were published in our previous study.Citation8.
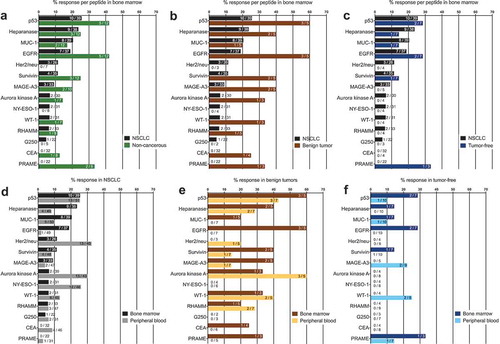
The highest response rates in the bone marrow and in the peripheral blood were observed for the TAs Her2/neu, aurora kinase A, NY-ESO-1 and p53. In the patients with NSCLC, we detected predominant responses in the peripheral blood to carcinoembryonic antigen (CEA), NY-ESO-1, WT-1, aurora kinase A, Her2/neu and G250, whereas the TA-reactive responses to p53, heparanase and EGFR were more pronounced in the bone marrow (). Thus, TA-reactive T cells were frequently detected in the bone marrow of patients with resectable NSCLC.
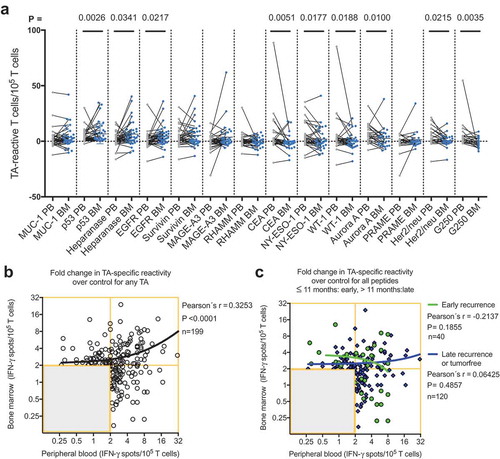
Figure 3. (A) Responses of PBTCs (gray points) and the corresponding BMTCs (blue points) from 39 patients with NSCLC to any of the 14 tested NSCLC-associated antigens. The gray line between two points indicates the TA-specific spot counts of the PBTCs and BMTCs from the same patient. The mean TA-specific IFN-γ spot counts minus the mean IgG (negative control) IFN-γ spot counts are shown. P-values were determined using two-tailed Wilcoxon matched-pairs signed rank tests. For a better visualization of TC responsiveness in BM and PB, we show PB data that were published in our previous study.Citation8 (B) Scatterplot showing the cumulative BMTC data in relation to PBTC responsiveness to any of the 14 tested TAs in 39 patients with NSCLC. BMTC responsiveness increased as PBTC responsiveness increased (two-tailed p < .0001, Pearson’s correlation coefficient r = 0.325, R2 = 0.106). (C) We defined early recurrence as tumor recurrence within 11 months after surgery.Citation4 Scatterplot showing the cumulative BMTC data in relation to PBTC responsiveness to any of the 14 tested TAs in the patients with NSCLC recurrence following curative intent surgery within 11 months postsurgery (defined as early recurrence) compared with >11 months postsurgery (defined as late recurrence or tumor-free). The linear regression line of the patients with early recurrence (green line) was not significantly different from the linear regression line of the patients with late recurrence or tumor-free patients (blue line). (B) – (C) The frequencies of TA-specific TCs are shown as the fold increases in the mean TA-specific IFN-γ spot counts (calculated relative to the mean IgG control spot counts). The values in the lower left quadrants were not considered TA-specific responses and were excluded (n = 238 in (B) and n = 278 in (C)) from the regression analysis. Only the TC responses of 2 or more IFN-γ spot counts greater than the mean IgG control spot counts (n = 199 in (B) and n = 160 in (C)) were deemed positive and included in the regression analysis. The black line represents the linear regression line. BMTCs, bone marrow-derived T cells; NSCLC, non-small-cell lung cancer; PBTC, peripheral blood-derived T cell; TA, tumor-associated antigen.
T cell subset composition in the bone marrow
In patients with minimal residual disease, the effector and memory subtypes of TA-reactive T cells confer immune protection and thereby prevent the outgrowth of occult micrometastases. We investigated the T cell subtypes in freshly prepared samples from an additional 4 patients with NSCLC using flow cytometry. The T cells were identified according to established definitionsCitation8,Citation17–Citation19 as T central memory (TCM) cells, effector T cells (Teff), T effector memory (TEM) cells or T naive/stem-like memory (TN/SCM) cells. We defined TN/SCM cells as antigen-experienced stem-like memory T cells (TSCM) that display a naive-like phenotype in conjunction with the capacity to reconstitute the full diversity of memory and effector T lymphocytes.Citation17 Similar to the peripheral blood-derived T cells (PBTCs), the BMTCs predominantly exhibited a TN/SCM phenotype (Figure, Supplemental Data 4A). The CD4/CD8 T cell ratio in the bone marrow was similar to that in the peripheral blood (Figure, Supplemental Data 4B).
TA-reactive t cells in the bone marrow predominantly secrete TNF-α
Previous observations in a murine infection modelCitation20 and a colorectal cancer studyCitation21 suggested that the capacity of T cells to confer immune protection was associated with the TNF-α-secreting subpopulation. We assessed cytokine secretion by individual T cell subsets upon stimulation with synthetic peptides derived from the TAs p53, heparanase, EGFR, and MUC-1 or from IgG as a control by combining flow cytometry-based T cell phenotyping with cytokine capture assays. TNF-α and IFN-γ secretion were detected in CD4+ and CD8 + T cells, but this secretion did not reach statistical significance in 5 patients (Figure, Supplemental Data 5A and B). Individual (Figure, Supplemental Data 6) and cumulative (Figure, Supplemental Data 7) data from the TNF-α cytokine capture assays revealed strong TA-reactive responsiveness in CD4+ and CD8+ BMTCs with high interindividual heterogeneity within the T cell subgroups, mainly among the effector memory and effector T cells.
Spatial distribution of T cell responsiveness per TA
According to several studies, human memory T cells have a distinct tissue distribution.Citation22 We aimed to answer the question of whether the anatomical distribution of the T cell response was related to TA identity. For each patient, we plotted the frequencies of TA-reactive PBTCs against the corresponding frequencies of TA-reactive BMTCs. The resulting scatterplots (Figure, Supplemental Data 8) show the correlation between the responsiveness of the PBTCs and the corresponding BMTCs from the same patient with NSCLC to any of the 14 tested TAs. The linear regression analysis suggested significant correlations for the TAs EGFR, MAGE-A3, CEA, NY-ESO-1, WT-1, PRAME and Her2/neu. The slopes of the red linear regression lines indicated predominant responses of the PBTCs to each TA. The cumulative data from all patients and each TA (n = 437) showed an approximately 4-fold increase in the peripheral blood response as the bone marrow response increased (right lower scatterplot in Figure, Supplemental Data 8).
Type of TA-reactive T cell response
We defined 5 types of TA-specific responses to characterize the predominant type of TA-specific response in detail: dominance of PBTC over BMTC responsiveness, dominance of BMTC over PBTC responsiveness, concordant BMTC and PBTC responsiveness, a dichotomy in the responses in the PB and BM subsets and a broad response pattern with values in all quadrants without assignment to any of the latter types. Additionally, depending on the number of peptides that elicited a positive response, we categorized the strength of the overall TA-specific response of each patient as follows: nonresponse as no positive peptides, a weak response as 1–33% positive peptides, an intermediate response as 34–67% positive peptides, and a strong response as greater than 67% positive peptides (Figure, Supplemental Data 9A and B). The predominant response types were peripheral blood over bone marrow dominance and no clear pattern. All 4 patients with the concordant-type response showed a strong TA-specific response in terms of high IFN-γ spot counts (Figure, Supplemental Data 9A and B). Strong responses were mainly observed in the patients with peripheral blood over bone marrow dominance, a broad response or concordance (Figure, Supplemental Data 9C). Peptides elicited ≥8-fold and single IFN-γ responses in 12 of the 39 patients. In these 12 patients, 6 responses were detected in only the peripheral blood, 3 were detected in only the bone marrow and 3 were detected in both. The patients with concordant peripheral blood and bone marrow TA-reactive responses exhibited stronger overall responses. Taken together, single high TA-specific responses were more likely to be elicited in the PBTCs than in the corresponding BMTCs.
T cell response and clinical parameters
We next investigated the correlations between the T cell response and clinical parameters that have been reported to impact the tumor-reactive immune response.Citation23 We did not observe a correlation between the T cell response and tumor stage (Figure, Supplemental Data 10), whereas a trend toward lower TA-reactive T cell counts in the peripheral blood of the patients with lymphangitic carcinomatosis was observed (p = .084; Figure, Supplemental Data 11D). In patients with NSCLC, significantly higher TA-reactive T cell counts were detected in the bone marrow of the patients with serum CEA levels greater than the median value (Figure, Supplemental Data 11C). No correlations were observed between the T cell response and histology dichotomized into squamous and nonsquamous types (Figure, Supplemental Data 11B). Higher numbers of TA-reactive T cells were significantly correlated with white blood cell (WBC) counts exceeding the median value (Figure, Supplemental Data 11D).
Correlations between the peripheral blood and bone marrow responses
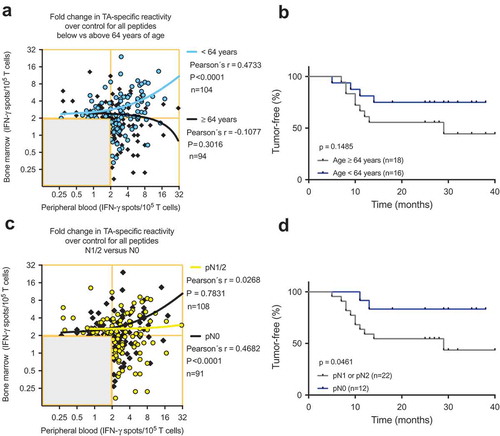
As immune cells are not static but rather circulate throughout the vascular and lymphatic systems, immune responses encompass several body compartments, such as the peripheral blood, bone marrow and tumor. We hypothesized that a strong peripheral blood response would accompany a weak bone marrow response and vice versa. Therefore, the cumulative data of the TA-reactive BMTC responses were plotted against the corresponding PBTC responses. The resulting scatterplots revealed a significant correlation between increasing bone marrow responsiveness and increasing peripheral blood responsiveness (Pearson’s correlation coefficient r = 0.33, p < .0001; ). No significant difference was observed in this dataset when comparing the correlations between the patients with early recurrence, late recurrence or a tumor-free follow-up (). The PBTC response increased as the BMTC response increased in the patients with TA-specific responses that were present in the peripheral blood but absent in the bone marrow (PB+BM-; blue line in ), as well as PB-BM+ and PB+BM+ responses (). Notably, the correlation was statistically significant only in the patients with TA-reactive responses that were present in the peripheral blood but absent in the bone marrow (PB+BM-) (Pearson’s correlation coefficient r = 0.333, R2 = 0.111, p = .033, n = 41). We investigated the postoperative follow-up in these patients () and observed a trend toward improved RFS in the patients with circulating TA-reactive T cells and the absence of TA-reactive BMTCs (). In general, the presence of any TA-reactive BMTCs was not associated with RFS (p = .728, 2-sided log-rank test; ) or overall survival (p = .340, 2-sided log-rank test; data not shown) after a median follow-up time of 25.5 months. In patients younger than 64 years, bone marrow responsiveness increased as peripheral blood responsiveness increased, which was significantly different from the pattern in the patients older than 63 years (). Younger patients showed a trend toward better RFS. A similar pattern was observed in the patients with a smoking history of 40 pack-years or more (Figure, Supplemental Data 12). A cumulative smoking history of 40 pack-years or more was associated with better RFS (p = .094, log-rank test). In the patients with pathologically confirmed absence of lymph node metastasis (pN0) postoperatively, bone marrow responsiveness was strongly correlated with peripheral blood responsiveness (p < .0001; ). Linear regression analyses showed a statistically significant difference between the correlation patterns for the patients with and without lymph node metastases (p = .003; ). RFS was improved in the patients with pN0 metastasis versus pN1 or pN2 lymph node metastasis (). The statistically significant association between lymphangitic carcinomatosis and RFS (p = .0003, log-rank test) confirmed this observation (Figure, Supplemental Data 13). Other factors known to influence RFS are shown in supplemental (Table, Supplemental Data 14). Sixteen of 34 patients underwent adjuvant chemotherapy, which was significantly correlated with postoperative stage II and higher (two-sided Chi-square test, p = .0052). During the observation period, 13 of the 34 patients experienced tumor recurrence, which was not associated with adjuvant chemotherapy (two-sided Chi-square test, p = .1830). After adjusting for variables within multivariable Cox regression, i.e., taking into account adjuvant chemotherapy, lymphangitic carcinomatosis, pathological lymph node status, postoperative UICC stage and patient age, the influence of the TA-reactive T cells in the bone marrow on tumor-free survival was not statistically significant (Table, Supplemental Data 15–18). This effect remained statistically not significant when modified multivariable models, e.g., with postoperative stage as an alternative variable, were applied.
Figure 4. (A) Cumulative BMTC data in relation to PBTC responsiveness in the patients with TA-specific responses in the PB but not in the BM (PB+BM-; blue line; Pearson’s correlation coefficient r = 0.333, R2 = 0.111, p = .033, n = 41) compared with patients with TA-specific responses in the BM but not the PB (PB-BM+; yellow line; Pearson’s correlation coefficient r = 0.266, R2 = 0.071, p = .122, n = 35) or patients with TA-specific responses in the PB and BM (PB+BM+; red line; Pearson’s correlation coefficient r = 0.433, R2 = 0.187, p = .140, n = 13). The frequencies of TA-specific TCs are shown as the fold increases in the mean TA-specific IFN-γ spot counts (calculated relative to the mean IgG control spot counts). TA-specific responsiveness was tested against 14 TAs in patients with NSCLC. RFS was not different between the patients with NSCLC with or without preoperative TA-responsive BMTCs. (B). Survival curves are plotted for all four scenarios of present/absent TA-specific BMTCs and PBTCs. (C) – (D). Patients were classified as TA responders when the triplicate IFN-γ spot counts for a specific peptide were significantly different from the counts for the IgG control peptide (p-value<0.05 by a t-test). Kaplan-Meier survival curves were compared using the log-rank test (B) – (D). TA-specific responsiveness to 14 TAs was assessed in patients with NSCLC. BMTC, bone marrow-derived T cell; NSCLC, non-small-cell lung cancer; PBTC, peripheral blood-derived T cell; RFS, recurrence-free survival; TA, tumor-associated antigen.
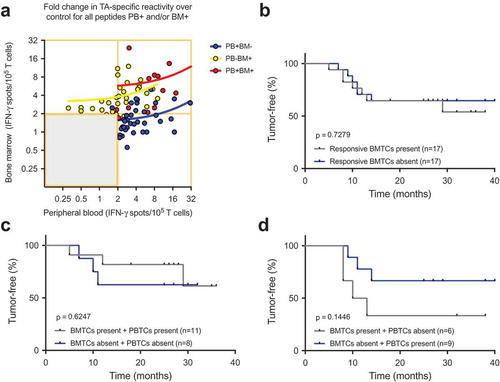
Figure 5. (A) and (C) Scatterplots showing the cumulative BMTC data in relation to PBTC responsiveness to any of the 14 tested TAs in patients with NSCLC (A) younger than 64 years and patients older than 63 years and (C) in patients with pathologically confirmed lymph node metastasis in the final pathology assessment (yellow linear regression line) compared with patients with no lymph node metastasis (black linear regression line). (A) Linear regression analyses showed a statistically significant difference between the slopes (p < .001). In the patients younger than 64 years, BMTC responsiveness increased as PBTC responsiveness increased (two-tailed p < .0001, Pearson’s correlation coefficient r = 0.456, R2 = 0.208). (C) Linear regression analyses showed a statistically significant difference between the slopes (p = .003). In the patients with no lymph node metastasis, BMTC responsiveness increased as PBTC responsiveness increased (two-tailed p < .0001, Pearson’s correlation coefficient r = 0.468, R2 = 0.219). (A) and (C) The frequencies of TA-specific TCs are shown as the fold increase in the mean TA-specific IFN-γ spot counts (calculated relative to the mean IgG control spot counts). The values in the lower left quadrants were excluded, n = 240 in (A) and n = 239 in (C). (B) and (D) Kaplan-Meier survival curves suggested (B) improved RFS in the younger patients (blue) compared with patients older than 63 years of age (gray) and (D) improved RFS in the patients with no lymph node metastasis (blue) compared with patients with pN1 or pN2 lymph node metastasis (gray) (two-tailed p = .046, log-rank test). BMTC, bone marrow-derived T cell; NSCLC, non-small-cell lung cancer; PBTC, peripheral blood-derived T cell; TA, tumor-associated antigen.
Discussion
We demonstrated that the bone marrow of almost every second patient with resectable NSCLC harbored high frequencies of T cells reactive to TAs. To the best of our knowledge, this prospective study is the first to investigate tumor-reactive T cells in bone marrow and peripheral blood samples of the same patients with NSCLC and to show that such tumor-reactive T cells in the bone marrow significantly complemented the total endogenous tumor-reactive T cell repertoire in the body.
We investigated endogenous T cell responses to 14 NSCLC-associated antigens in peripheral blood and corresponding bone marrow samples from 39 patients with NSCLC, 5 patients with benign tumors and 7 tumor-free patients using an IFN-γ ELISPOT assay. We detected T cells that reacted to any of the TAs in the bone marrow and in the peripheral blood of 50% and 67% of the patients with NSCLC, respectively (). Similar frequencies of TA-reactive responses have been reported in patients with other cancers, such as melanoma,Citation24 colon cancerCitation25 and pancreatic cancer.Citation14 The highest combined response rates were observed for the proto-oncogene Her2/neu, the cell cycle protein aurora kinase A, the cancer/testis antigen NY-ESO-1 and the tumor suppressor p53 (), all of which are currently under investigation in clinical trials.Citation26–Citation29
In patients with NSCLC, the frequencies of TA-reactive T cells in the bone marrow were significantly lower (p = .0028; ) than those in the corresponding peripheral blood sample from the same patient. As shown in our previous study, the presence of preoperatively detected endogenous TA-reactive T cells in the peripheral blood was associated with improved RFS in 51 patients following curative intent surgery for NSCLC.Citation8 In contrast, in 34 of these 51 patients, we did not detect a prognostic value for the preoperatively detected endogenous TA-reactive T cells in the bone marrow (p = .7279; ). The differences in the prognostic values of the TA-reactive T cells in the peripheral blood and bone marrow may be explained by the distinct immune microenvironments of these two anatomical sites. The few existing human studies on bone marrow suggest that CD4+ CD25+ regulatory T cells represent 20–60% of the CD4 + T cells in the bone marrow, which is approximately 3-times higher than the percentage in other anatomical sites, such as the spleen.Citation30 In addition, tumor antigen-reactive regulatory T cells in the bone marrow can significantly suppress tumor antigen-reactive T cell responses in the bone marrow, an observation that we reported previously.Citation31,Citation32 The suppression of potentially autoreactive T cells by regulatory T cells, which is an important function of the bone marrow to minimize self-reactivity and avoid autoimmune disease, may also affect the reactivity toward TAs that reach the bone marrow. The latter mechanism may explain not only the lower frequencies of TA-reactive T cells in the bone marrow but also the strong IFN-γ responses that were primarily observed in the peripheral blood (Figure, Supplemental Data 9C). The immunosuppressive microenvironment of the bone marrow is presumed to cause the frequent occurrence of metastasis to the bone marrow.Citation33 Thus, the results of our ELISPOT assays for the bone marrow samples may primarily represent a regulatory T cell response in contrast to the primarily effector T cell response in the peripheral blood. Studies on the cell composition in bone marrow have primarily focused on the functional differences within different regions inside a bone but not necessarily between different bones. The results of one study suggest that the cell composition in the bone marrow is not significantly different among different sampling sites.Citation34 Due to limited data, it remains unclear whether there are differences in bone marrow localization among memory T cells found within the sternum, vertebrae, iliac crest or other bones.Citation35 Therefore, we cannot exclude the possibility that the absence of a correlation between TA-reactive T cells from the bone marrow and recurrence-free survival may depend on the site of bone marrow puncture. The lack of data regarding the metabolic profile of memory T cells in the bone marrow, which is a distinct anatomical site for memory T cells,Citation35 additionally complicates this explanation.
The frequency of TA reactivity is known to be much higher among memory T cells than that among naive T cells. Correspondingly, we detected TA-specific responses in the effector and memory CD4+ and CD8 + T cell subsets that were comparable to the peripheral blood results from the same patientsCitation8 and have also been reported for the bone marrow in patients with colorectal cancerCitation21 and multiple myeloma.Citation36 Our extensive correlation analyses revealed that TA-specific responses were predominantly detected in the peripheral blood and were less common in the bone marrow. Farber et al.Citation22 discussed this sequestration of memory T cell specificities in distinct anatomical compartments as a physiological mechanism to maintain immune homeostasis in the body. The site-specific functional impairment of preexisting TA-reactive T cells may be due to insufficient stimulation or direct immunosuppression within the bone marrow.
In patients with NSCLC, the TA-reactive T cells in the bone marrow combined with the TA-reactive T cells in the corresponding peripheral blood significantly enriched the total repertoire of TA-reactive T cells in the body (). This finding confirms the hypothesis that the bone marrow may represent a lymphoid niche for TA-reactive T cells.Citation16 Correspondingly, an analysis of matched bone marrow and peripheral blood samples from 61 healthy adults undergoing hip replacement showed that compared with the peripheral blood, the population of human bone marrow memory T cells is not activated but remains in the G0 phase of the cell cycle in terms of proliferation, transcription, and mobility.Citation37 A murine chronic virus infection model also showed that blockade of the PD-L1/PD-1 axis induces the proliferation of a population of T cells with low PD-1 expression.Citation38 This preexisting T cell-mediated immunity, which is restrained by T cell suppression, has been discussed as a mechanism for generating durable clinical responses following checkpoint inhibition therapy in many patients with cancer.Citation23
This prospective study is limited by the small sample size and the lack of a validation cohort, which may restrict the generalizability of the results. However, most studies sample only the peripheral blood even though the vast majority of memory T cells reside in anatomical sites such as the bone marrow, intestines, lungs and skin.Citation22 To the best of our knowledge, this study is the first to reveal the correlation between TA-reactive T cells in peripheral blood and bone marrow samples from the same patient with NSCLC. Active and specific immunization in patients with resectable NSCLC is reasonable as the immune system must combat minimal residual disease in the postoperative setting and is likely still intact. According to a randomized controlled study of patients with stage IV colon cancer, postoperative active and specific immunization with an autologous tumor vaccine is associated with a 35% improvement in long-term survival over 10 years,Citation39 which was presumed to be due to the activation and mobilization of preexisting tumor-reactive memory T cells from the bone marrow.Citation40 Successful antitumor immune responses following PD-1/PD-L1 blockade require reactivation and clonal proliferation of antigen-experienced T cells present in the tumor microenvironment.Citation41 As peripheral blood T cells represent only 2 to 2.5% of the total T cell complement in the body, the bone marrow may serve as a reservoir and site of recruitment for tumor-reactive T cells. With regard to immune checkpoint inhibitors, the question arises as to whether the rate of nonresponders could be reduced if tumor-reactive T cells could be recruited from the bone marrow.
Taken together, in this pilot study, we demonstrated that T cells in the bone marrow have the potential to significantly expand the responsiveness of T cells against tumor antigens in the body. Clinical studies are necessary to clarify the role of tumor-reactive T cells from the bone marrow in T cell-based immunotherapy approaches.
Materials and methods
Study approval and patients
The Ethics Committee in Heidelberg approved this prospective study (approval number: S-515/2013; ClinicalTrials.gov registration ID: NCT02515760). All investigations were performed in accordance with the principles embodied in the Declaration of Helsinki. This trial was conducted at the Department of Thoracic Surgery at Heidelberg University Hospital. The numbers of patients enrolled in the study and included in the analysis are outlined in the flow diagram shown in Figure, Supplemental Data 1.
Peripheral blood and bone marrow
Fresh peripheral blood samples were obtained preoperatively and processed as described previously.Citation8 Following general anesthesia, the right or left anterior superior iliac crest of the patient, who was lying in a supine position, was punctured with a bone marrow biopsy needle (Illinois needle, DIN1518X, CareFusion, Waukegan, IL) under sterile conditions. Thirty-five milliliters of bone marrow blood was aspirated and anticoagulated with 5 mL of heparin (Heparin-Natrium 25000 I.E./5 ml, Leo Pharma, Neu-Isenburg, Germany). The samples were immediately subjected to Ficoll gradient centrifugation (Biochrom, Berlin, Germany), and the cells in the interface were collected as previously described.Citation8,Citation42
Surgery
All patients underwent general anesthesia and endobronchial double-lumen intubation. Surgery was performed through a video-assisted thoracoscopic approach or a thoracotomy approach with systematic nodal dissection in all patients with cancer.Citation43,Citation44 Diagnoses were made by pathologists with expertise in lung cancer (AW and EH) ().
Cell purification and culture
Cell purification and culture for the interferon gamma (IFN-γ) enzyme-linked immunospot (ELISPOT) and cytokine capture assays were performed using previously described methods.Citation8,Citation42,Citation45
Antigens
The Peptide Synthesis Facility of the German Cancer Research Center (DKFZ, Heidelberg, Germany) provided all polypeptides, which were designed to contain the known immunogenic HLA-A*0201 T cell epitope, as described previously in detail.Citation8
IFN-γ ELISPOT assay
ELISPOT assays were performed as previously described.Citation8 Briefly, antigen-pulsed DCs were incubated with autologous T cells at a 1:5 ratio for 40 h. Quantification was performed using a CTL Analyzer (Cellular Technology), and individuals were considered responders if the spot numbers in the triplicate test wells significantly (two-sided Student’s t-test with p < .05 as the responder criterion) exceeded the numbers in the control wells.
Cytokine capture assay and analysis by flow cytometry
Cytokine capture assays and flow cytometry were performed using previously described methods.Citation8 Briefly, T cells were cocultured with autologous DCs (5:1 ratio), pulsed with peptides, polyclonally stimulated with staphylococcal enterotoxin B (SEB) as a positive control, or maintained in normal medium as a negative control. Tumor necrosis factor alpha (TNF-α) and IFN-γ secretion detection kits (Miltenyi Biotec GmbH) were used to label secreted cytokines as described previously.Citation21 The following reagents were used: yellow dead cell stain (Life Technologies GmbH; L34959; 1:1,000), anti-human CD4-PerCP-Cy5.5 (clone RPA T4, BD), anti-CD8-V450 (RPA T8, BD), anti-CD45RA-APC-H7 (clone H100, BD), and anti-CD62L-PE-Cy7 (clone DREG56, eBioscience) antibodies. Data were collected using the FACSCanto instrument with FACSDiva software (BD, San Jose, CA). We used the same gating strategy as reported previously.Citation8 The data were analyzed and visualized using FlowJo 10.4 software (FlowJo, Ashland, OR) and GraphPad Prism version 7 (GraphPad, San Diego, CA).
Postoperative follow-up
The postoperative follow-up consisted of chest X-rays every three months and a chest CT scan every six months. Tumor recurrence was confirmed by the institutional tumor board. The primary end point was RFS, calculated from the time of tumor resection. Patients with high-risk UICC stage IB and stages II and higher were considered for adjuvant chemotherapy.
Statistical analyses
The experimental results were assessed using paired and unpaired two-tailed Student’s t-tests. The impact of TA-reactive T cell responses on RFS was analyzed separately for the 14 TAs using univariate Cox models. Due to the small sample size and to maintain consistency among all scatterplots, Pearson correlation was used to analyze the association between the frequency of T cells in peripheral blood and bone marrow. For analyses of continuous data from small samples, we used a t-test.Citation46,Citation47 A p-value <0.05 was considered statistically significant. Owing to the high number of comparisons, the resulting p-values could not be adjusted for multiplicity and are therefore of a purely descriptive nature. Statistical analyses were performed using SPSS Statistics version 23 (IBM, Armonk, NY) and GraphPad Prism version 7.
Disclosure of potential conflicts of interest
The authors report no conflict of interest.
Informed consent
Appropriate permission and written consent were obtained from all patients included in this study.
Supplemental Material
Download Zip (1.6 MB)Supplementary material
Supplemental data for this article can be accessed on the publisher’s website.
Additional information
Funding
References
- Siegel RL, Miller KD, Jemal A. Cancer statistics, 2017. CA Cancer J Clin. 2017;67(1):1–12. doi:10.3322/caac.21387.
- Ettinger DS, Akerley W, Borghaei H, Chang AC, Cheney RT, Chirieac LR, D’Amico TA, Demmy TL, Govindan R, Grannis FW, et al. Non-small cell lung cancer, version 2.2013. J Natl Compr Canc Netw. 2013;11(6):645–653. doi:10.6004/jnccn.2013.0084.
- Asamura H, Goya T, Koshiishi Y, Sohara Y, Eguchi K, Mori M, Nakanishi Y, Tsuchiya R, Shimokata K, Inoue H, et al. A Japanese lung cancer registry study: prognosis of 13,010 resected lung cancers. J Thorac Oncol. 2008;3(1):46–52. doi:10.1097/JTO.0b013e31815e8577.
- Yamauchi Y, Muley T, Safi S, Rieken S, Bischoff H, Kappes J, Warth A, Herth FJ, Dienemann H, Hoffmann H. The dynamic pattern of recurrence in curatively resected non-small cell lung cancer patients: experiences at a single institution. Lung Cancer. 2015;90(2):224–229. doi:10.1016/j.lungcan.2015.09.010.
- Goss GD, O’Callaghan C, Lorimer I, Tsao MS, Masters GA, Jett J, Edelman MJ, Lilenbaum R, Choy H, Khuri F, et al. Gefitinib versus placebo in completely resected non-small-cell lung cancer: results of the NCIC CTG BR19 study. J Clin Oncol. 2013;31(27):3320–3326. doi:10.1200/JCO.2013.51.1816.
- Lievense LA, Sterman DH, Cornelissen R, Aerts JG. Checkpoint blockade in lung cancer and mesothelioma. Am J Respir Crit Care Med. 2017;196(3):274–282. doi:10.1164/rccm.201608-1755CI.
- Vachani A, Sequist LV, Spira A. AJRCCM: 100-year anniversary. The shifting landscape for lung cancer: past, present, and future. Am J Respir Crit Care Med. 2017;195(9):1150–1160. doi:10.1164/rccm.201702-0433CI.
- Safi S, Yamauchi Y, Rathinasamy A, Stamova S, Eichhorn M, Warth A, Rauch G, Dienemann H, Hoffmann H, Beckhove P. Functional T cells targeting tumor-associated antigens are predictive for recurrence-free survival of patients with radically operated non-small cell lung cancer. Oncoimmunology. 2017;6(11):e1360458. doi:10.1080/2162402X.2017.1360458.
- Ganusov VV, De Boer RJ. Do most lymphocytes in humans really reside in the gut? Trends Immunol. 2007;28(12):514–518. doi:10.1016/j.it.2007.08.009.
- Mazo IB, Honczarenko M, Leung H, Cavanagh LL, Bonasio R, Weninger W, Engelke K, Xia L, McEver RP, Koni PA, et al. Bone marrow is a major reservoir and site of recruitment for central memory CD8+ T cells. Immunity. 2005;22(2):259–270. doi:10.1016/j.immuni.2005.01.008.
- Feuerer M, Beckhove P, Garbi N, Mahnke Y, Limmer A, Hommel M, Hammerling GJ, Kyewski B, Hamann A, Umansky V, et al. Bone marrow as a priming site for T-cell responses to blood-borne antigen. Nat Med. 2003;9(9):1151–1157. doi:10.1038/nm914.
- Beckhove P, Feuerer M, Dolenc M, Schuetz F, Choi C, Sommerfeldt N, Schwendemann J, Ehlert K, Altevogt P, Bastert G, et al. Specifically activated memory T cell subsets from cancer patients recognize and reject xenotransplanted autologous tumors. J Clin Invest. 2004;114(1):67–76. doi:10.1172/JCI20278.
- Domschke C, Ge Y, Bernhardt I, Schott S, Keim S, Juenger S, Bucur M, Mayer L, Blumenstein M, Rom J, et al. Long-term survival after adoptive bone marrow T cell therapy of advanced metastasized breast cancer: follow-up analysis of a clinical pilot trial. Cancer Immunol Immunother. 2013;62(6):1053–1060. doi:10.1007/s00262-013-1414-x.
- Schmitz-Winnenthal FH, Volk C, Z’Graggen K, Galindo L, Nummer D, Ziouta Y, Bucur M, Weitz J, Schirrmacher V, Buchler MW, et al. High frequencies of functional tumor-reactive T cells in bone marrow and blood of pancreatic cancer patients. Cancer Res. 2005;65(21):10079–10087. doi:10.1158/0008-5472.can-05-1098.
- Sommerfeldt N, Schutz F, Sohn C, Forster J, Schirrmacher V, Beckhove P. The shaping of a polyvalent and highly individual T-cell repertoire in the bone marrow of breast cancer patients. Cancer Research. 2006;66(16):8258–8265. doi:10.1158/0008-5472.can-05-4201.
- Schirrmacher V. Cancer-reactive memory T cells from bone marrow: spontaneous induction and therapeutic potential (Review). Int J Oncol. 2015;47(6):2005–2016. doi:10.3892/ijo.2015.3197.
- Gattinoni L, Lugli E, Ji Y, Pos Z, Paulos CM, Quigley MF, Almeida JR, Gostick E, Yu Z, Carpenito C, et al. A human memory T cell subset with stem cell-like properties. Nat Med. 2011;17(10):1290–1297. doi:10.1038/nm.2446.
- Mueller SN, Gebhardt T, Carbone FR, Heath WR. Memory T cell subsets, migration patterns, and tissue residence. Annu Rev Immunol. 2013:31137–31161. doi:10.1146/annurev-immunol-032712-095954.
- Schwendemann J, Choi C, Schirrmacher V, Beckhove P. Dynamic differentiation of activated human peripheral blood CD8+ and CD4+ effector memory T cells. J Immunol. 2005;175(3):1433–1439. doi:10.4049/jimmunol.175.3.1433.
- Darrah PA, Patel DT, De Luca PM, Lindsay RW, Davey DF, Flynn BJ, Hoff ST, Andersen P, Reed SG, Morris SL, et al. Multifunctional TH1 cells define a correlate of vaccine-mediated protection against Leishmania major. Nat Med. 2007;13(7):843–850. doi:10.1038/nm1592.
- Reissfelder C, Stamova S, Gossmann C, Braun M, Bonertz A, Walliczek U, Grimm M, Rahbari NN, Koch M, Saadati M, et al. Tumor-specific cytotoxic T lymphocyte activity determines colorectal cancer patient prognosis. J Clin Invest. 2015;125(2):739–751. doi:10.1172/JCI74894.
- Farber DL, Yudanin NA, Restifo NP. Human memory T cells: generation, compartmentalization and homeostasis. Nat Rev Immunol. 2014;14(1):24–35. doi:10.1038/nri3567.
- Chen DS, Mellman I. Elements of cancer immunity and the cancer-immune set point. Nature. 2017;541(7637):321–330. doi:10.1038/nature21349.
- Muller-Berghaus J, Ehlert K, Ugurel S, Umansky V, Bucur M, Schirrmacher V, Beckhove P, Schadendorf D. Melanoma-reactive T cells in the bone marrow of melanoma patients: association with disease stage and disease duration. Cancer Research. 2006;66(12):5997–6001. doi:10.1158/0008-5472.CAN-04-0484.
- Koch M, Beckhove P, Winkel J, Autenrieth D, Wagner P, Nummer D, Specht S, Antolovic D, Galindo L, Schmitz-Winnenthal FH, et al. Tumor infiltrating T lymphocytes in colorectal cancer: tumor-selective activation and cytotoxic activity in situ. Annals of Surgery. 2006;244(6):986–992. doi:10.1097/01.sla.0000247058.43243.7b.
- Krishnadas DK, Shusterman S, Bai F, Diller L, Sullivan JE, Cheerva AC, George RE, Lucas KG. A phase I trial combining decitabine/dendritic cell vaccine targeting MAGE-A1, MAGE-A3 and NY-ESO-1 for children with relapsed or therapy-refractory neuroblastoma and sarcoma. Cancer Immunol Immunother. 2015;64(10):1251–1260. doi:10.1007/s00262-015-1731-3.
- Li D, Bentley C, Anderson A, Wiblin S, Cleary KLS, Koustoulidou S, Hassanali T, Yates J, Greig J, Nordkamp MO, et al. Development of a T-cell receptor mimic antibody against wild-type p53 for cancer immunotherapy. Cancer Res. 2017;77(10):2699–2711. doi:10.1158/0008-5472.CAN-16-3247.
- Ahmed N, Brawley VS, Hegde M, Robertson C, Ghazi A, Gerken C, Liu E, Dakhova O, Ashoori A, Corder A, et al. Human epidermal growth factor receptor 2 (HER2) -specific chimeric antigen receptor-modified T cells for the immunotherapy of HER2-positive sarcoma. J Clin Oncol. 2015;33(15):1688–1696. doi:10.1200/JCO.2014.58.0225.
- Casey NP, Fujiwara H, Ochi T, Yasukawa M. Novel immunotherapy for adult T-cell leukemia/lymphoma: targeting aurora kinase A. Oncoimmunology. 2016;5(11):e1239006. doi:10.1080/2162402X.2016.1239006.
- Zou L, Barnett B, Safah H, Larussa VF, Evdemon-Hogan M, Mottram P, Wei S, David O, Curiel TJ, Zou W. Bone marrow is a reservoir for CD4+CD25+ regulatory T cells that traffic through CXCL12/CXCR4 signals. Cancer Res. 2004;64(22):8451–8455. doi:10.1158/0008-5472.CAN-04-1987.
- Rathinasamy A, Domschke C, Ge Y, Bohm HH, Dettling S, Jansen D, Lasitschka F, Umansky L, Graler MH, Hartmann J, et al. Tumor specific regulatory T cells in the bone marrow of breast cancer patients selectively upregulate the emigration receptor S1P1. Cancer Immunol Immunother. 2017;66(5):593–603. doi:10.1007/s00262-017-1964-4.
- Schmidt HH, Ge Y, Hartmann FJ, Conrad H, Klug F, Nittel S, Bernhard H, Domschke C, Schuetz F, Sohn C, et al. HLA Class II tetramers reveal tissue-specific regulatory T cells that suppress T-cell responses in breast carcinoma patients. Oncoimmunology. 2013;2(6):e24962. doi:10.4161/onci.24962.
- Nagarsheth N, Wicha MS, Zou W. Chemokines in the cancer microenvironment and their relevance in cancer immunotherapy. Nat Rev Immunol. 2017;17(9):559–572. doi:10.1038/nri.2017.49.
- Pritz T, Landgraf-Rauf K, Herndler-Brandstetter D, Rauf R, Lair J, Gassner R, Weinberger B, Krismer M, Grubeck-Loebenstein B. Bone marrow T cells from the femur are similar to iliac crest derived cells in old age and represent a useful tool for studying the aged immune system. Immun Ageing. 2013;10(1):17. doi:10.1186/1742-4933-10-17.
- Di Rosa F. Two Niches in the Bone Marrow: a hypothesis on life-long T cell memory. Trends Immunol. 2016;37(8):503–512. doi:10.1016/j.it.2016.05.004.
- Choi C, Witzens M, Bucur M, Feuerer M, Sommerfeldt N, Trojan A, Ho A, Schirrmacher V, Goldschmidt H, Beckhove P. Enrichment of functional CD8 memory T cells specific for MUC1 in bone marrow of patients with multiple myeloma. Blood. 2005;105(5):2132–2134. doi:10.1182/blood-2004-01-0366.
- Okhrimenko A, Grun JR, Westendorf K, Fang Z, Reinke S, von Roth P, Wassilew G, Kuhl AA, Kudernatsch R, Demski S, et al. Human memory T cells from the bone marrow are resting and maintain long-lasting systemic memory. Proc Natl Acad Sci U S A. 2014;111(25):9229–9234. doi:10.1073/pnas.1318731111.
- Im SJ, Hashimoto M, Gerner MY, Lee J, Kissick HT, Burger MC, Shan Q, Hale JS, Lee J, Nasti TH, et al. Defining CD8+ T cells that provide the proliferative burst after PD-1 therapy. Nature. 2016;537(7620):417–421. doi:10.1038/nature19330.
- Schulze T, Kemmner W, Weitz J, Wernecke KD, Schirrmacher V, Schlag PM. Efficiency of adjuvant active specific immunization with Newcastle disease virus modified tumor cells in colorectal cancer patients following resection of liver metastases: results of a prospective randomized trial. Cancer Immunol Immunother. 2009;58(1):61–69. doi:10.1007/s00262-008-0526-1.
- Schirrmacher V, Fournier P, Schlag P. Autologous tumor cell vaccines for post-operative active-specific immunotherapy of colorectal carcinoma: long-term patient survival and mechanism of function. Expert Rev Vaccines. 2014;13(1):117–130. doi:10.1586/14760584.2014.854169.
- Sharma P, Hu-Lieskovan S, Wargo JA, Primary RA. Adaptive, and acquired resistance to cancer immunotherapy. Cell. 2017;168(4):707–723. doi:10.1016/j.cell.2017.01.017.
- Feuerer M, Beckhove P, Bai L, Solomayer EF, Bastert G, Diel IJ, Pedain C, Oberniedermayr M, Schirrmacher V, Umansky V. Therapy of human tumors in NOD/SCID mice with patient-derived reactivated memory T cells from bone marrow. Nat Med. 2001;7:452–458.
- Dienemann H, Hoffmann H, Koebe HG. Technique and rationale of lymph node dissection in bronchial carcinoma. Chirurg. 1998;69(4):412–417. doi:10.1007/s001040050431.
- Lardinois D, De Leyn P, Van Schil P, Porta RR, Waller D, Passlick B, Zielinski M, Lerut T, Weder W. ESTS guidelines for intraoperative lymph node staging in non-small cell lung cancer. Eur J Cardiothorac Surg. 2006;30(5):787–792. doi:10.1016/j.ejcts.2006.08.008.
- Reissfelder C, Timke C, Schmitz-Winnenthal H, Rahbari NN, Koch M, Klug F, Roeder F, Edler L, Debus J, Buchler MW, et al. A randomized controlled trial to investigate the influence of low dose radiotherapy on immune stimulatory effects in liver metastases of colorectal cancer. BMC Cancer. 2011;11419. doi:10.1186/1471-2407-11-419.
- Bland JM, Altman DG. Analysis of continuous data from small samples. BMJ. 2009:338a3166. doi:10.1136/bmj.a3166.
- Karulin AY, Caspell R, Dittrich M, Lehmann PV. Normal distribution of CD8+ T-cell-derived ELISPOT counts within replicates justifies the reliance on parametric statistics for identifying positive responses. Cells. 2015;4(1):96–111. doi:10.3390/cells4010096.