
ABSTRACT
A substantial obstacle to the success of adoptive T cell-based cancer immunotherapy is the sub-optimal affinity of T-cell receptors (TCRs) for most tumor antigens. Genetically engineered TCRs that have enhanced affinity for specific tumor peptide-MHC complexes may overcome this barrier. However, this enhancement risks increasing weak TCR cross-reactivity to other antigens expressed by normal tissues, potentially leading to clinical toxicities. To reduce the risk of such adverse clinical outcomes, we have developed an extensive preclinical testing strategy, involving potency testing using 2D and 3D human cell cultures and primary tumor material, and safety testing using human primary cell and cell-line cross-reactivity screening and molecular analysis to predict peptides recognized by the affinity-enhanced TCR. Here, we describe this strategy using a developmental T-cell therapy, ADP-A2M4, which recognizes the HLA-A2-restricted MAGE-A4 peptide GVYDGREHTV. ADP-A2M4 demonstrated potent anti-tumor activity in the absence of major off-target cross-reactivity against a range of human primary cells and cell lines. Identification and characterization of peptides recognized by the affinity-enhanced TCR also revealed no cross-reactivity. These studies demonstrated that this TCR is highly potent and without major safety concerns, and as a result, this TCR is now being investigated in two clinical trials (NCT03132922, NCT04044768).
Introduction
T cell-based immunotherapy is a promising therapeutic option for cancer. CAR-T therapy, using a chimeric-antigen receptor, allows redirecting of T cells toward tumor cell-surface antigens. However, many tumor-specific antigens are intracellular, and so are not targetable using a CAR-T approach. This can be overcome by utilizing T cell receptors (TCRs), which recognize peptide-major histocompatibility complexes (MHC) derived from intracellular proteins. However, an obstacle to the success of TCR-therapy is the low affinity of natural T-cell receptors for most tumor antigens.Citation1–Citation3 T cells bearing TCRs that strongly recognize self-antigens are negatively selected during thymic maturation. As many tumor antigens originate from self-proteins, mature circulating T cells are unable to recognize these antigens with high affinity. There are also low levels of peptide-major histocompatibility complex (MHC) complexes on the surface of some tumor cells.Citation4,Citation5
Genetic engineering of complementary-determining regions to create TCRs with enhanced affinity for specific peptide-MHC complexes could overcome these obstacles.Citation6–Citation11 T cells bearing affinity-enhanced TCRs have demonstrated improved tumor cell recognition and killing in vitro compared to native TCRs.Citation9,Citation12–Citation14 Furthermore, T cells with affinity-enhanced tumor-specific TCRs have shown clinical efficacy.Citation15–Citation19
The T cell specificity for its tumor antigen target suggests there is the potential to avoid general immune-mediated toxicities; however, treatment-induced toxicities have been observed in some adoptive T cell clinical studies.Citation15,Citation20–Citation23 Suggested mechanisms for these include T cell cross-reactivity that is either on-target, where the antigen is not wholly tumor-restricted, or off-target, where the TCR recognizes a mimetic epitope from a separate protein, either on the same HLA as the target or a separate HLA allele (‘alloreactivity’). These toxicities highlight the need for biologically relevant testing, including target expression validation and specificity testing, to minimize clinical toxicity.
Species-level proteomic differences limit the relevance of in vivo toxicological models to assess the risk of on-target and off-target TCR toxicity. We developed an extensive in vitro preclinical testing strategy to evaluate the safety and efficacy of our specific peptide enhanced affinity receptor (SPEAR) T cells, involving human cell testing and molecular analysis. Herein, we apply this strategy to a TCR therapy using ADP-A2M4, which comprises autologous T cells transduced with an affinity-enhanced TCR that recognizes the HLA-A2-restricted MAGE-A4230-239 peptide GVYDGREHTV. MAGE-A4 is a member of an extensive family of cancer/testis antigens;Citation24 its expression is restricted to immune-privileged sitesCitation25-Citation27 as well as cancers.Citation28–Citation31 In non-small cell lung cancer (NSCLC), melanoma, bladder, head and neck, and gastroesophageal cancers, MAGE-A4 is highly expressed in up to 50% of cases,Citation32 and thus MAGE-A4 is an attractive target for TCR therapy.
Results
ADP-A2M4 displays potency in vitro
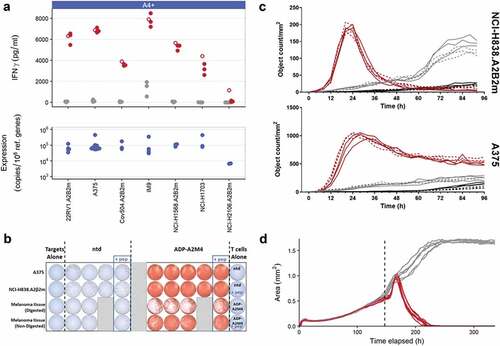
ADP-A2M4 were assessed on their potency against antigen-positive tumor cell lines and primary tumor material in a series of in vitro assays measuring IFNγ release, proliferation, and cytotoxicity. IFNγ release by ADP-A2M4 in response to MAGE-A4+ tumor cell lines and MAGE-A4+ primary melanoma material was measured by cell-ELISA and ELISpot, respectively. Antigen expression was determined by qPCR. ADP-A2M4 produced strong IFNγ responses to MAGE-A4+ cell lines () and MAGE-A4+ primary melanoma material (). ADP-A2M4 CD4+ and CD8+ T-cell subsets proliferated in response to the natively MAGE-A4+ A375 cell line and to antigen-negative cell lines (Colo205 and T2) in the presence of MAGE-A4230-239 peptide (Figure S1). Finally, ADP-A2M4 effectively killed HLA-A*02 and MAGE-A4-expressing cancer cell lines, in standard adherent cell culture () and 3D microtissues (, Video S1).
Figure 1. In vitro efficacy of ADP-A2M4 against MAGE-A4+ and HLA-A*02:01 tumor cells. (a) ADP-A2M4 release IFNγ in response to MAGE-A4+ tumor cell lines. Upper panel: IFNγ release from ADP-A2M4 (red points) and non-transduced T cells (gray points), as determined by cell-ELISA. Unfilled points show response to MAGE-A4231-240 peptide (10–5 M) to demonstrate maximal response. Each point reflects the average response of a single T-cell product in multiple independent experiments (three T cell products tested). Lower panel: MAGE-A4 expression in matched tumor line samples, as determined by qPCR (normalized to expression of reference genes RPL32, HPRT1). (b) ADP-A2M4, but not non-transduced T cells, release IFNγ in response to ex vivo-processed primary melanoma material, as determined by ELISpot. (c) ADP-A2M4 display cytotoxic activity toward two MAGE-A4-expressing tumor lines, as determined by IncuCyte time-lapse microscopy with a caspase-3/7 fluorogenic dye. Each line shows the number of apoptotic target cells within a single well when cultured with ADP-A2M4 (red lines) or non-transduced T cells (gray lines), or in the absence of T cells (black lines). Dashed lines show response to MAGE-A4231-240 peptide (10–5 M) to demonstrate maximal response. Data shown are of one T-cell product, representative of three tested. (d) ADP-A2M4 display cytotoxic activity toward the GFP+MAGE-A4+ tumor line A375 cultured in 3D microtissues, as determined by IncuCyte time-lapse microscopy. Each line shows the area of the microtissue within a single well when cultured with ADP-A2M4 (red lines) or non-transduced T cells (gray lines). Data shown are of one T-cell product, representative of three tested. Dashed vertical line indicates T-cell addition
ADP-A2M4 produces dose-dependent in vivo tumor clearance
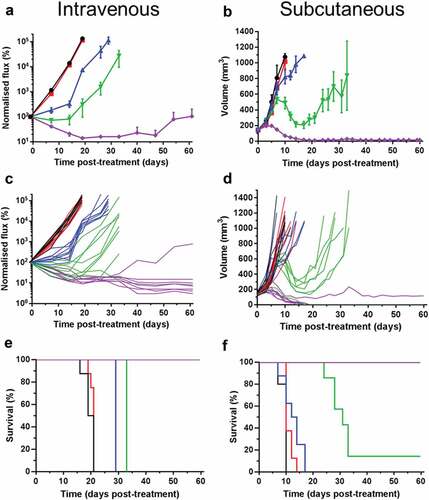
ADP-A2M4 was administered as a single intravenous (i.v.) injection to athymic mice bearing either subcutaneous (s.c.) or i.v. xenografted tumors derived from a human melanoma cell line. Dose-dependent anti-tumor effects were observed against both single, large s.c. tumors and the small diffuse tumors observed following i.v. administration. For both studies, pronounced regression and 100% survival were observed with the highest dose examined (3 × 10⁶ transduced cells) (). A delayed onset of response in the s.c. study relative to the i.v. arm was observed and was most pronounced with the 1 × 10⁶ transduced T-cell dose (), likely reflecting the increased time needed to infiltrate and reduce larger tumors. ADP-A2M4 was well tolerated, with a transient decrease in body weight associated with administration of the highest dose in the i.v. study (Figure S2A). This was not observed with s.c. tumors (Figure S2B) and is likely due to the inflammation associated with T-cell activation in the presence of tumor cells, which accumulated in the lung for several days post-injection.
Figure 2. ADP-A2M4 dose-dependently inhibit the growth of MAGE-A4+ A375 tumors, leading to regression and increased survival in i.v. (a, c, e) or s.c. (b, d, f) xenograft models. A, B: Mean (± SEM) and C, D: individual tumor growth curves, and; e, f: Kaplan Meier survival curves following a single dose of ADP-A2M4 administered on D 0 (n = 7–8 per group, untreated group: n = 5). Black lines: no treatment; red lines: 3 × 10⁶ non-transduced T cells; blue, green, and violet lines: 3 × 10⁵, 1 × 10⁶, and 3 × 10⁶ ADP-A2M4
ADP-A2M4 demonstrates limited cross-reactivity toward antigen-negative cells in vitro
ADP-A2M4 were assessed for off-target cross-reactivity by measuring T-cell activation by IFNγ cell-ELISA after incubation with HLA-A*02:01+ MAGE-A4− primary normal cells and tumor-derived cell lines covering multiple cell types (Table S2). Nearly all MAGE-A4− cell types tested did not induce T-cell activation. However, ADP-A2M4 was found to respond to 4/7 melanocyte lots (Figure S3A) and an antigen-negative melanoma cell line (data not shown). A response was also seen toward a single small airway epithelial cell line, but only after the cells had been maintained in culture for at least eight passages (Figure S3B). In further screening experiments, ADP-A2M4 showed no reactivity toward a second batch of the same lot of cells or other small airway epithelial cells cultured under standard 2D conditions or organotypic conditions (Figure S3C). In all cases, the response of ADP-A2M4 toward target cells in the presence of 10–5 M MAGE-A4230-239 was used to confirm sufficient HLA-A*02:01 expression (data not shown).
ADP-A2M4 off-target cross-reactivity was also assessed by cytotoxic activity and IFNγ and GzB release against terminally differentiated human cells derived from induced pluripotent stem cells (iPSC). No cross-reactive responses were observed for ADP-A2M4 T cells to any of the iPSC-derived cell subtypes tested (cardiomyocytes, astrocytes, endothelial cells; data not shown).
ADP-A2M4 displays alloreactivity toward HLA-A*02:05
ADP-A2M4 were screened against a panel of EBV-transformed B-lymphoblastic cell lines (B-LCLs) expressing a wide range of HLA alleles (Table S3), and T-cell activation was determined by IFNγ cell-ELISA. Several B-LCLs induced a potent response in both ADP-A2M4 and non-transduced T cells, presumably due to endogenous EBV-reactivities, which unfortunately limits the ability to infer safety from these specific lines; ADP-A2M4 but not non-transduced T cells also responded to two lines that expressed HLA-A*02:05 (). Two of three HLA-A*02:05-expressing primary cell lines tested induced a response from ADP-A2M4 ().
Figure 3. ADP-A2M4 display alloreactivity toward HLA-A*02:05. (a) ADP-A2M4 respond to two HLA-A*02:05 EBV-derived B-LCLs (FH25, FH41; blue points) but not other cell lines. (b) ADP-A2M4 react to 2/3 HLA-A*02:05-expressing human primary cells. (c) ADP-A2M4 respond to human primary Schwann cells transduced to express HLA-A*02:05 but not other HLA-A2 alleles. Points in all panels show IFNγ release from ADP-A2M4 (red or blue points) and non-transduced cells (gray points), as determined by cell-ELISA. Each point reflects the average response of a single T-cell product in multiple independent experiments (three T cell products tested)
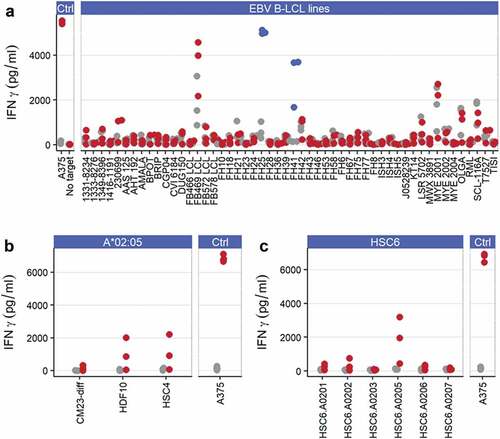
To explore this potential alloreactivity, a panel of common HLA-A2 alleles was lentivirally transduced into a MAGE-A4−HLA-A2− primary Schwann cell line HSC6, and their ability to induce an ADP-A2M4 response was assessed by IFNγ cell-ELISA. The introduction of HLA-A*02:05, but not other HLA-A2 alleles, led to strong ADP-A2M4 responses (), demonstrating ADP-A2M4 alloreactivity. Patients expressing HLA-A*02:05 should therefore not be treated with this TCR.
ADP-A2M4 demonstrates cross-reactivity to MAGE-A8 and MAGE-B2
To determine if the affinity-enhanced TCR recognized other peptides within the MAGE family, peptides from all members of the MAGE protein family with homology to the index peptide were identified through protein sequence alignment (n = 30) and then screened for their ability to stimulate ADP-A2M4 by IFNγ cell-ELISA. Of the homologous peptides tested, 20 triggered a response (>50% of the response to index peptide) by ADP-A2M4 (data not shown). Peptides that produced T-cell responses were investigated by titration from 10−5M–10−11M in an additional IFNγ cell-ELISA. This assay identified four stimulatory peptides, derived from MAGE-A8 (GLYDGREHSV), MAGE-B2 (GVYDGEEHSV), MAGE-B4 (GIYDGKRHLI), and MAGE-B6 (GIYDGILHSI), that warranted further investigation ().
Figure 4. ADP-A2M4 do not display relevant off-target peptide cross-reactivities. (a) ADP-A2M4 respond to MAGE-A8 and MAGE-B2 peptides and less strongly to MAGE-B4 and MAGE-B6 peptides. Data show the shift in logEC50 (ΔlogEC50) from index peptide when ADP-A2M4 were challenged with the peptides of interest. Each point shows the ΔlogEC50 for a single T-cell product (three T cell products tested); black bar indicates geometric mean. Y-axis truncated at 6 to exclude peptides with very weak responses where quantification of response is not reliable. Dashed line: logΔEC50 = 2. (b) ADP-A2M4 respond to Nalm6 cells transduced to express MAGE-A4, MAGE-A8, and MAGE-B2, but not other MAGE proteins. Points show IFNγ release from ADP-A2M4 (red points) and non-transduced cells (gray points), as determined by cell-ELISA. Each point reflects the average response of a single T-cell product in multiple independent experiments (three T cell products tested). (c) X-scan data show that the ADP-A2M4 TCR displays highly asymmetric specificity, with specific reactivity toward the N-terminal half of the index peptide, and promiscuous recognition of peptides containing substitutions within the C-terminal half of the peptide. Data show the response of three T-cell products toward indicated substitutions as fraction of response to MAGE-A4231-240. Substitutions divided by physicochemical properties: Sma: small; Pol: polar; Aci: acidic; Aro: aromatic; Bas: basic; Ali: aliphatic. (d) ADP-A2M4 respond to FMO3, MOT10, and TLR7-derived peptides. Data show ΔlogEC50 from index peptide when ADP-A2M4 were challenged with the peptides of interest. Each point shows the logΔEC50 for a single T-cell product (three T cell products tested); black bar indicates geometric mean. Y-axis truncated at 6 to exclude peptides with very weak responses where quantification of peptide response is not reliable. Dashed line: logΔEC50 = 2. (e) ADP-A2M4 do not respond to DLD-1 or SW480 cells transfected to express FMO3, MOT10, or TLR7 proteins. Points show IFNγ release from ADP-A2M4 (red points) and non-transduced cells (gray points), as determined by cell-ELISA. Each point reflects the average response of a single T-cell product in multiple independent experiments (three T cell products tested)
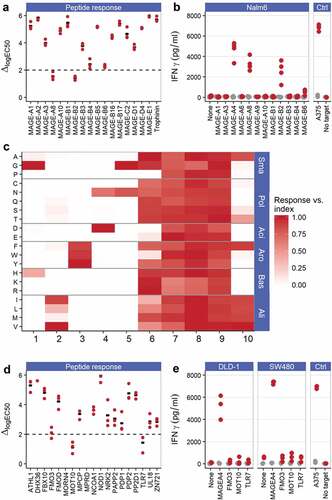
To confirm the reactivity of ADP-A2M4 to these proteins, NALM6 cells (HLA-A*02:01+MAGE−) were transduced to overexpress MAGE-A4, MAGE-A8, MAGE-B2, MAGE-B4, or MAGE-B6, or one of a selection of MAGE family members with identified EC50 values significantly removed from that of index (MAGE-A1, MAGE-A3, MAGE-A6, MAGE-A9, MAGE-A10, MAGE-B1, and MAGE-B3) as negative controls. ADP-A2M4 produced IFNγ against the NALM6 cells expressing MAGE-A4, confirming processing of the parent protein and presentation of the target peptide, reduced IFNγ responses against MAGE-A8 – and MAGE-B2-expressing NALM6 cells, and a very weak response toward MAGE-B6 (). No responses were observed to NALM6 cells expressing other MAGE family members. These data indicate that peptides inducing T-cell responses >2-log weaker than that of the index peptide do not represent a concern for cross-reactivity. Assessment of ADP-A2M4 responses to natively MAGE-B2- and MAGE-A8-expressing tumor lines found some T-cell responses, albeit weaker than those toward MAGE-A4+ tumor lines (Figure S4). A thorough evaluation of the expression profile of these two proteins by qPCR of an in-house normal tissue biobank and querying publicly available RNAseq datasets identified no concerns regarding off-tumor expression, as non-tumor expression is restricted to testes and placenta (data not shown). ADP-A2M4 has been shown to respond to two additional MAGE family member antigens, although the response is too weak to justify clinical use.
Characterization of peptides recognized by ADP-A2M4 revealed no functionally relevant cross-reactivity
To molecularly characterize the specificity of the ADP-A2M4 TCR in detail, thereby identifying the potential repertoire of peptides recognized, we determined the reactivity of the transduced T cells toward 190 modified peptides. In the X-scan,Citation7 each residue of the target peptide was sequentially mutated to all 19 other naturally occurring amino acids. T2 cells were incubated with each of the substituted peptides at a concentration corresponding to the EC90 of response to the index peptide. These cells were then used as targets for ADP-A2M4 in an IFNγ ELISpot.
The TCR specificity for ADP-A2M4 was found to center on the N-terminal positions 1–5 (p1 – p5), where highly restricted recognition was observed (). p6 was more tolerant of amino acid substitution, with 17 amino acids tolerated. Recognition of amino acid substitutions at p7, p8, and p9 was shown to be fully degenerate with all peptides recognized. Less degeneracy was observed at the anchor p10, where eight residues were tolerated.
A pattern-based motif encompassing all potentially tolerated peptides was derived. This motif was used for in silico searches of the human proteome for decamers with the potential for ADP-A2M4 TCR recognition. These searches identified 158 human proteins containing 84 unique decameric sequences contained within the motif, including MAGE-A4, MAGE-A8, and MAGE-B2 (Table S4). The ability of identified peptides to bind to HLA-A*02:01 was predicted using the SMM algorithm,Citation33 and a very permissive threshold for HLA-A*02:01 binding was applied to exclude only the least likely HLA binders. All identified HLA-A*02:01-binding peptides were synthesized and their ability to stimulate ADP-A2M4 determined by IFNγ cell-ELISA. Of these, only three non-MAGE peptides generated a response with a potency at or near the 2-log threshold for concern identified earlier: FMO3, MOT10, and TLR7 (). Overexpression of these genes in two tumor cell lines revealed that none was recognized by ADP-A2M4, indicating that these peptide sequences were not naturally processed and presented from the source proteins ().
Discussion
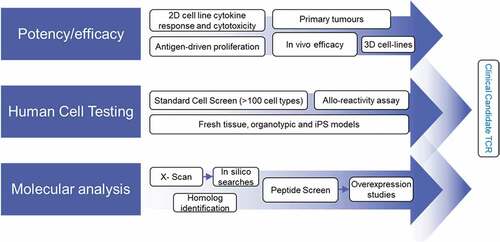
Although affinity-enhanced T-cell therapy is a promising therapeutic option, treatment-induced toxicities have been observed.Citation15,Citation20–Citation23 Suggested mechanisms for these toxicities include TCR reactivity against healthy tissues that is either on-target or off-target.Citation34 The peptide-specific nature of these responses makes in vivo toxicology studies unsuitable since the differences between human and murine proteomes preclude reliable detection of off-target cross-reactivity. Consequently, a robust, biologically relevant preclinical testing strategy for selecting target antigens and TCRs for clinical development is required.Citation34,Citation35 We developed an extensive in vitro preclinical testing protocol to evaluate the safety and efficacy of SPEAR T-cell therapies (). These approaches were developed and expanded from techniques that retrospectively predicted clinical off-target toxicity induced by an affinity-enhanced MAGE-A3 TCR.Citation20
Figure 5. Preclinical screening process for affinity-enhanced TCRs
Efficacy of ADP-A2M4 was assessed using both in vitro and in vivo approaches. In vitro T-cell functional responses, including cytokine release, cytotoxicity, and proliferation, were observed against a panel of MAGE-A4+ target cell lines, including lines cultured as microtissues in a 3D system that reflects in vivo conditions.Citation36 We observed strong responses against a freshly isolated MAGE-A4+ melanoma sample, demonstrating efficacy against clinical tumor material. Furthermore, ADP-A2M4 were able to inhibit and eliminate human tumor cells in a dose-dependent manner in an in vivo xenograft setting.
The likelihood of on-target, off-tumor reactivity can be reduced by stringent assessment of the pattern of target expression. MAGE-A4 is an attractive target for T-cell therapy in this respect, because its non-tumor expression is restricted to immune-privileged sites.Citation25–Citation27
Off-target cross-reactivity is challenging to predict and test preclinically. A level of degeneracy in TCR antigen recognition is established via thymic positive selection during T-cell development, which ensures that circulating T cells can respond to highly diverse pathogenic peptide epitopes.Citation37–Citation39 However, this plasticity means that an apparently tumor-specific TCR might unexpectedly bind off-target to non-cancer-restricted epitopes, leading to clinical toxicity. This risk increases when TCRs are affinity enhanced in vitro, without the safety mechanism of negative thymic selection.Citation10 We screened for potential off-target cross-reactivity using primary cells and cell lines covering multiple cell types from a range of human organ systems, including cells derived from iPSCs, which are more representative of human tissues than standard cell cultures.Citation20 Very few off-target reactivities were observed for ADP-A2M4 against a panel of human primary cells; some responses were observed toward melanocytes and an antigen-negative melanoma cell line. These did not express any MAGE proteins to which the TCR is known to respond, and so the precise target remains unknown. While these necessitate clinical monitoring, they are not believed to represent a clinical risk. In addition, ADP-A2M4 showed low-level cross-reactivity against an antigen-negative small airway epithelial cell line. This cross-reactivity was observed in a single batch of cells, at passages 8 and 9, and thus appears to be an artifact of extended cell culture. Further screening experiments demonstrated no cross-reactivity with small airway epithelial cells either under submerged cell culture conditions or in organoid models.
Alloreactivity can occur when TCRs specific for a peptide-MHC complex display cross-reactivity toward different HLA alleles, with or without significant peptide selectivity. This is commonly observed in the mismatched allogeneic transplant setting but is a potential safety risk for adoptive TCR therapy. ADP-A2M4 displayed alloreactivity toward several HLA-A*02:05-expressing cell types. The lack of cell-type specificity observed suggests that the reactivity either is not peptide-specific or is directed toward a peptide from a ubiquitously expressed protein. Therefore, patients expressing HLA-A*02:05 are excluded from clinical studies with ADP-A2M4.
The MAGE family of proteins displays high homology, and cross-MAGE reactivity was implicated in neurological adverse events in a MAGE-A3 TCR clinical trial.Citation22 Therefore, we assessed if ADP-A2M4 recognizes homologous peptides from other MAGE proteins. We identified two peptides from MAGE-A8 and MAGE-B2 proteins that elicited moderate responses. While MAGE-A8 does appear to have low-level expression in the brain (GTEx portal), the reactivity is considerably weaker than MAGE-A4, and as MAGE-B2 expression is restricted to the testis and placenta, these cross-reactivities do not raise concerns regarding off-target reactions in clinical studies.
We characterized the potential repertoire of all peptides recognized by the affinity-enhanced TCR using the X-scan assay.Citation7,Citation14 A degenerate motif of all tolerated peptides was used in a directed in silico search of the human proteome for peptides with the potential to be recognized. Although three peptides with the ability to stimulate ADP-A2M4 were identified (MOT10, FMO3, TLR7), these peptides were not processed and presented, even after overexpression of the source proteins. The binding motif was unusually asymmetric, with greatly increased specificity at the N-terminal half of the peptide, suggesting a somewhat atypical binding orientation of the TCR. This asymmetric binding motif is also present in the parental TCR (data not shown), indicating that this was not an artifact of the affinity enhancement process.
The mispairing of introduced α and β TCR chains with endogenous TCRs has been proposed as a potential safety concern for adoptive TCR-based T cell therapy.Citation40,Citation41 As yet, however, no clinical adverse events have been demonstrated to be related to mispairing. As quantifying the risk of this preclinically remains intractable, this mispairing was not evaluated in this study.
These studies cannot completely eliminate the risk of adverse events due to off-target reactivity in the clinic. In particular, several novel approaches to evaluating TCR specificity have been recently published, which allow the identification of mimotope peptides with minimal sequence similarity to the known index peptide,Citation42,Citation43 in contrast to the X-scan which is limited to relatively conservative substitutions. In addition, the primary cell screen is performed without regard to the gene expression profile of the cell types and would benefit from a more systematic approach to selecting cells, with the aim of maximizing genomic coverage amongst the panel of cells tested. These cells could additionally be treated with IFNγ to induce the immunoproteosome and replicate the immunopeptidome exposed during inflammatory events.
In conclusion, we have identified efficacy and no major safety concerns for ADP-A2M4 in these preclinical studies, and this TCR is now being tested in the clinic for treatment of multiple cancers (NCT03132922). Furthermore, this preclinical testing strategy is being employed to evaluate additional enhanced affinity TCR candidates, aiming to expand options for adoptive T-cell therapy against cancer.
Materials and methods
Primary cells and cell lines
Tumor cells, suppliers and maintenance media used are listed in Table S1. For certain assays, cell lines transduced or transfected with an antigen/HLA molecule/fluorescent or luminescent tag were used as target cells.
Primary human cells (Table S2) were cultured, per the suppliers’ instructions. All cells were kept in culture until the day of the assays, when they were counted and washed in RPMI supplemented with penicillin/streptomycin, L-glutamine, and 10% FBS (R10) prior to plating for assays.
B-LCLs (Table S3) were used as targets for alloreactivity screening. These were cultured in R10.
Induced pluripotent stem cells (iCells®, Cellular Dynamics International Inc.) were cultured per manufacturer’s instructions. Cardiomyocytes, astrocytes, and endothelial cells (from the same HLA-A2+ donor) were used to test the reactivity of affinity-enhanced T cells.
All cell lines were screened for mycoplasma contamination (Mycoplasma Experience), and authenticity and purity confirmed by STR analysis (LGC).
Primary tumor material
Primary melanoma tumor material was processed to a single cell suspension from cryopreserved tissue using the gentleMACS Octo Dissociator (Miltenyi). Material was divided in two: one sample was enzymatically digested using a tumor dissociation kit (Miltenyi), per manufacturer’s instructions, and the other was processed without enzyme addition. Primary tumor cells were cultured in Melanocyte Growth Medium-4 (Lonza) prior to use.
ADP-A2M4 TCR and T-cell transduction
The MAGE-A4-specific ADP-A2M4 TCR was generated by affinity enhancing a TCR isolated from a healthy donor, as previously described.Citation7,Citation12,Citation14 To prepare ADP-A2M4, T cells were isolated from peripheral blood mononuclear cells from healthy human donors by CD3/CD28 bead pulldown and incubated overnight with CD3/CD28 antibody-coated beads in the presence of 100units/ml rhIL-2. Activated T cells were lentivirally transduced to express the affinity-enhanced TCR, as previously described,Citation7 and expanded for up to 13 d in large-scale cultures on a Xuri W25 bioreactor (GE Healthcare) to mimic preparations for clinical use. T cell purity, CD4/CD8 ratio, and transduction efficiency were determined by flow cytometry (Table S5). Non-transduced T cells were activated and expanded from the same donors for use as negative controls.
IFNγ ELISpot
Assays were undertaken with an IFNγ ELISpot kit (BD Pharmingen) per manufacturer’s instructions. T cells were defrosted, rested for 2 h, washed, and plated at 2–5 × 10⁴/well. Plates were incubated overnight (37°C/5% CO2), developed per manufacturer’s instructions, and evaluated on a CTL Immunospot Series 4 ELISpot Analyzer (CTL Ltd.). Non-transduced T cells were used as negative controls. Assays were repeated in triplicate, except when there was insufficient primary tumor material.
Cytotoxicity
Cytotoxicity was measured using an IncuCyte ZOOM (Essen Bioscience). iCell Cardiomyocytes and Astrocytes were plated in 96-well plates at recommended densities. iCell Endothelial cells were plated at slightly higher densities to improve monolayer formation (7.5 × 10³/well). All iCell subtypes were plated several days prior to the assay to allow for adherence and differentiation. Other cell lines were seeded the day prior to assay, at varying densities (1.5–3 × 10⁴/well). On the day of the assay, iCells or primary cells were washed three times in PBS to remove the culture medium. Assay medium was added containing IncuCyte™ Kinetic Caspase-3/7 Apoptosis Assay Reagent (Essen Biosciences; 5μM). All assay plates were imaged to confirm the monolayer had not been disrupted by washing. T cells were defrosted, rested, and added at 6 × 10⁴ T cells/well. MAGE-A4230-239 peptide was added to certain wells as a positive control (10−5M). Wells were imaged every 2, 3, or 4 h.
ELISAs
Supernatants were collected and analyzed for IFNγ and granzyme B (GzB) using the Human IFNγ DuoSet ELISA and the Human Granzyme B DuoSet ELISA (both R&D Systems), respectively, with the use of a luminescent HRP substrate (Glo Substrate, R&D Systems). Luminescence was measured using the FLUOstar Omega plate reader (BMG Labtech).
IFNγ cell-ELISA
Cell-based ELISAs were carried out as previously published.Citation44 Target cells, effector T cells (104/well) and/or peptide, or IFNγ standards, were plated in 384-well plates after overnight plate coating with IFNγ capture antibody. After 48 h, the plates were washed and developed for IFNγ cell-ELISA, per manufacturer’s instructions (R&D DuoSet Human IFNγ ELISA kit), with the use of a luminescent HRP substrate (Glo Substrate, R&D Systems). Luminescence was measured using a FLUOstar Omega plate reader.
Proliferation
T-cell proliferation in response to antigen was determined by flow cytometry. T cells were defrosted and rested for 26 h at 2 × 10⁶/mL in RPMI without tryptophan prior to loading with the proliferation dye VPD450. VPD450-stained T cells were incubated alone or with irradiated T2s, Colo205, or A375 target cells (~96, ~96, ~48 Gy, respectively; E:T ratio: 5:1), in the presence or absence of MAGE-A4230-239 peptide (10−5M). After 3 d co-culture, cells were harvested and stained with antibodies for Vα24 (specific for ADP-A2M4 TCR), CD3, CD4, CD8, and 7AAD viability dye for analysis on a Fortessa flow cytometer (BD Bioscience). Cells that have undergone division in each condition are expressed as percentage of cells with reduced VPD450 (% VPD-low).
X-scan
A panel of synthetic peptides containing all possible single-amino-acid substitutions at all positions in the index MAGE-A4230-239 peptide was designed. This comprised 19 peptides for each position in the index peptide; 191 total peptides including index peptide were synthesized (Peptide Protein Research Limited; >90% pure). The response of TCR-transduced T cells toward T2 cells in the presence of each peptide and to the index peptide was determined by IFNγ ELISpot. Effectors were used between 2 and 2.5 × 10⁴ cells/well, and peptides were added at a concentration equal to the EC90 of the index peptide (10–9.5M). Substitutions were defined as tolerated by the TCR where the response was >10% of the response to the index peptide. Substitutions for which at least one TCR product in one assay gave >10% response but the overall average was <10% were deemed marginal and were reassessed using a peptide titration and the response at the index EC90 concentration was determined by interpolation. The substitution was included in the motif if the interpolated response was >10% of the index response.
Bioinformatic analysis of X-scan data
A pattern-based motif was generated to encompass all residues tolerated at each position. Decameric sequences contained within the human proteome that comply with the derived motif were identified using an in-house R script to query a local copy of the UniProtKB/Swiss-Prot databaseCitation45 with splice variants, supplemented with coding variants extracted from dbSNP.Citation46 The ability of identified peptides to bind to HLA-A*02:01 was determined using the stabilized matrix method (SMM) algorithm,Citation33 and poor binders (predicted KD > 30000 nM) were excluded from further analysis.
3D cell culture method
To visualize killing of 3D microtissues by ADP-A2M4, A375 (MAGE-A4+ melanoma) cells were lentivirally transduced with cop-GFP (Santa Cruz Biotech). GFP+ cells were selected and maintained using puromycin and were seeded into ultra-low adhesion 384-well microplates (SBio) at 1.2 × 10³ cells/well and incubated at 37°C/5% CO2 to form 3D microtissues of ~800 µm in diameter. After 6 d, transduced or non-transduced T cells were added at 2 × 10⁴ cells/well. 3D microtissues were imaged in an Incucyte ZOOM every 4 h following target seeding. Raw fluorescent images were exported using Essen Biosciences proprietary software and microtissue area analyzed using a custom Axiovision software macro (Zeiss).
Quantitative PCR analysis
Total RNA was extracted from cells or tissue using the RNeasy Mini kit (Qiagen), and cDNA was prepared using the qScript cDNA SuperMix (Quanta Biosciences) per manufacturer’s protocol. Quantitative PCR (qPCR) was carried out on the QuantStudio7 Real-time PCR system (ThermoScientific) using the QuantiTect Probe and QuantiTect Multiplex Probe PCR kits (Qiagen).
Gene expression was quantified by comparing the CT value of the test samples to a standard curve with a known number of copies (plasmid). Data are represented following normalization to the average of two housekeeping genes (RPL32 and HPRT1).
In vivo efficacy
A375 tumor cells were transduced with a GFP/luciferase (GFP/luc) lentiviral construct, with GFP+ cells sorted to purity. The in vivo anti-tumor efficacy of ADP-A2M4 was evaluated in two xenograft models using this A375 GFP/luc line, against either a large s.c. tumor or small disseminated tumors produced by i.v. tumor cell injection. All procedures were certified according to the UK Animals (Scientific Procedures) Act, 1986. Female NOG mice (NOD.Cg-Prkdcscid Il2rgtm1Sug/JicTac, 4–6 weeks old, Taconic Biosciences, Inc.) were maintained in individually ventilated cages, with food and water available ad libitum. All non-imaging procedures were performed in a class II biological safety cabinet. Animals were inspected daily and weighed at least three times per week.
Efficacy i.v.: 106 A375 GFP/luc cells in 100μl RPMI were injected into the lateral tail vein. Six days post-injection (D −1), mice received luciferin (150 mg/kg i.p.) prior to anesthesia (2% isoflurane/2 l/min O2) and bioluminescent/x-ray overlay imaging (luciferin to imaging = 8 min., Bruker In Vivo Xtreme imaging system). Animals were randomized into experimental groups based on luciferase signal strength (photon flux).
Efficacy s.c.: 5 × 10⁶ A375 GFP/luc-transfected tumor cells in 100 μl RPMI were injected into the left flank s.c. Sixteen days post-injection (D 0), animals were randomized into experimental groups based on tumor volume (measured with calipers) according to the formula:
Volume = tumor length x perpendicular tumor width2/2.
On the day of T-cell injection (D 0), non-transduced T cells and ADP-A2M4 from the same healthy donor were defrosted and rested in R10 for 2h/37°C. The concentration of live cells was determined using trypan blue dye exclusion, and T cells were prepared as 3 × 10⁵, 1 × 10⁶, or 3 × 10⁶ transduced T cells in 100μl injection volume.
Animals in the i.v. study arm were imaged at least once weekly, with control animals culled on D 21. Treated but otherwise healthy animals were culled once tumor burden had reached a comparable level. In the s.c. arm, volume was measured twice weekly, with otherwise healthy animals culled once tumors had grown to ~1000 mm3.
Airway organoid culture
25% v/v growth factor reduced (GFR) Matrigel was seeded into 96-well plates in PneumaCult-ALI medium (Stemcell Technologies). After overnight gelation, small airway epithelial cells (Epithelix SARL) were seeded in PneumaCult-ALI medium containing 5% v/v GFR Matrigel (differentiation medium). Cells were fed every 2–3 d for ~28 d; basal cells differentiated into organoids containing multiple airway cell types. Cultures included basal, goblet, club, and ciliated cells (qPCR for p63, MUC5AC, SCGB1A1, and FOXJ1, respectively). The organoids displayed a large lumen in which beating cilia were observed and mucins produced, as determined by Alcian blue staining and by immunohistochemistry for MUC5AC (data not shown).
Two to three days prior to T-cell addition, control cell lines A375 and Caski were seeded into Matrigel beds. All plates were washed in R10 before T cells were added with or without exogenous peptide. Supernatants were harvested after 96 h and assessed for T-cell IFNγ and GzB secretion by ELISA.
Disclosure of potential conflicts of interest
All authors are employed by and have stock or stock options in Adaptimmune.
Authors’ contributions
Conception and design: J.P. Sanderson, A.B. Gerry
Acquisition of data: D.J. Crowley, G.E. Wiedermann, H.M. Tunbridge, T. Ahmed, L.L. Quinn, K.L. Crossland, T.V. Cornforth, K. Howe
Analysis and interpretation of data: J.P. Sanderson, M. Saini, R.J. Abbott, V.E. Anderson, B. Tavano, C. Barnes, M. Maroto, A.B. Gerry
Writing review, and/or revision of the manuscript: J.P. Sanderson, D.J. Crowley, G.E. Wiedermann, K.L. Crossland, H.M. Tunbridge, M. Saini, R.J. Abbott, V.E. Anderson, B. Tavano, C. Barnes, T. Ahmed, M. Maroto, A.B. Gerry
Study supervision: J.P. Sanderson, M. Saini, R.J. Abbott, V.E. Anderson, B. Tavano, C. Barnes, M. Maroto, A.B. Gerry
Supplemental Material
Download ()Acknowledgments
We are grateful to William Lawrance and Eleanor Bagg (protein engineering of the ADP-A2M4 TCR), Adriano Quattrini, Neil Cartwright and Preetha Viswanathan (generated the large-scale T cell preps), Annette Pachnio and Caitriona O’Connor (T cell phenotyping and characterization), Natasha Towle and members of the Target Validation department (target cell characterization), and our blood donors. Editorial support and formatting assistance were provided by Elizabeth Haygreen, who was contracted and compensated by Adaptimmune, and by Justina Stadanlick.
Supplementary material
Supplemental data for this article can be accessed on the publisher’s website.
Additional information
Funding
References
- Fournier C, Martin F, Zitvogel L, Kroemer G, Galluzzi L, Apetoh L. Trial watch: adoptively transferred cells for anticancer immunotherapy. Oncoimmunology. 2017;6:e1363139. doi:10.1080/2162402X.2017.1363139.
- Ping Y, Liu C, Zhang Y. T-cell receptor-engineered T cells for cancer treatment: current status and future directions. Protein Cell. 2018;9:254–11. doi:10.1007/s13238-016-0367-1.
- Aleksic M, Liddy N, Molloy PE, Pumphrey N, Vuidepot A, Chang K-M, Jakobsen BK, Robbins PF, Morgan RA, Feldman SA, et al. Different affinity windows for virus and cancer-specific T-cell receptors: implications for therapeutic strategies. Eur J Immunol. 2012;42:3174–3179. doi:10.1002/eji.201242606.
- Garrido F, Cabrera T, Aptsiauri N. “Hard” and “soft” lesions underlying the HLA class I alterations in cancer cells: implications for immunotherapy. Int J Cancer. 2010;127:249–256. doi:10.1002/ijc.25270.
- Bossi G, Gerry AB, Paston SJ, Sutton DH, Hassan NJ, Jakobsen BK. Examining the presentation of tumor-associated antigens on peptide-pulsed T2 cells. Oncoimmunology. 2013;2:e26840.
- Manning TC, Parke EA, Teyton L, Kranz DM. Effects of complementarity determining region mutations on the affinity of an alpha/beta T cell receptor: measuring the energy associated with CD4/CD8 repertoire skewing. J Exp Med. 1999;189:461–470. doi:10.1084/jem.189.3.461.
- Border EC, Sanderson JP, Weissensteiner T, Gerry AB, Pumphrey NJ. Affinity-enhanced T-cell receptors for adoptive T-cell therapy targeting MAGE-A10: strategy for selection of an optimal candidate. Oncoimmunology. 2018;8: e1532759.
- Manning TC, Schlueter CJ, Brodnicki TC, Parke EA, Speir JA, Garcia KC, Teyton L, Wilson IA, Kranz DM. Alanine scanning mutagenesis of an αβ T cell receptor: mapping the energy of antigen recognition. Immunity. 1998;8:413–425. doi:10.1016/S1074-7613(00)80547-6.
- Robbins PF, Li YF, El-Gamil M, Zhao Y, Wargo JA, Zheng Z, Xu H, Morgan RA, Feldman SA, Johnson LA, et al. Single and dual amino acid substitutions in TCR CDRs can enhance antigen-specific T cell functions. J Immunol. 2008;180:6116–6131. doi:10.4049/jimmunol.180.9.6116.
- Tan MP, Gerry AB, Brewer JE, Melchiori L, Bridgeman JS, Bennett AD, Pumphrey NJ, Jakobsen BK, Price DA, Ladell K, et al. T cell receptor binding affinity governs the functional profile of cancer-specific CD8+ T cells. Clin Exp Immunol. 2015;180:255–270. doi:10.1111/cei.12570.
- Weber KS, Donermeyer DL, Allen PM, Kranz DM. Class II-restricted T cell receptor engineered in vitro for higher affinity retains peptide specificity and function. Proc Natl Acad Sci U S A. 2005;102:19033–19038. doi:10.1073/pnas.0507554102.
- Li Y, Moysey R, Molloy PE, Vuidepot, A.L., Mahon, T., Baston, E., Dunn, S., Liddy, N., Jacob, J., Jakobsen, B.K., et al. Directed evolution of human T-cell receptors with picomolar affinities by phage display. Nat Biotechnol. 2005;23:349–354. doi:10.1038/nbt1070.
- Zhong S, Malecek K, Johnson LA, Yu Z, Vega-Saenz de Miera E, Darvishian F, McGary K, Huang K, Boyer J, Corse E, et al. T-cell receptor affinity and avidity defines antitumor response and autoimmunity in T-cell immunotherapy. Proc Natl Acad Sci U S A. 2013;110:6973–6978. doi:10.1073/pnas.1221609110.
- Docta RY, Ferronha T, Sanderson JP, Weissensteiner T, Pope GR, Bennett AD, Pumphrey NJ, Ferjentsik Z, Quinn LL, Wiedermann GE, et al. Tuning T cell receptor affinity to optimize clinical risk-benefit when targeting alpha-fetoprotein-positive liver cancer. Hepatology. 2019;69:2061-2075.
- Johnson LA, Morgan RA, Dudley ME, Cassard L, Yang JC, Hughes MS, Kammula US, Royal RE, Sherry RM, Wunderlich JR, et al. Gene therapy with human and mouse T-cell receptors mediates cancer regression and targets normal tissues expressing cognate antigen. Blood. 2009;114:535–546. doi:10.1182/blood-2009-03-211714.
- D’Angelo SP, Melchiori L, Merchant MS, Bernstein D, Glod J, Kaplan R, Grupp S, Tap WD, Chagin K, Binder GK, et al. Antitumor Activity Associated with Prolonged Persistence of Adoptively Transferred NY-ESO-1c259T cells in Synovial Sarcoma. Cancer Discov. 2018;8:944–957.
- Rapoport AP, Stadtmauer EA, Binder-Scholl GK, Goloubeva O, Vogl DT, Lacey SF, Badros AZ, Garfall A, Weiss B, Finklestein J, et al. NY-ESO-1-specific TCR-engineered T cells mediate sustained antigen-specific antitumor effects in myeloma. Nat Med. 2015;21:914–921. doi:10.1038/nm.3910.
- Robbins PF, Morgan RA, Feldman SA, Yang JC, Sherry RM, Dudley ME, Wunderlich JR, Nahvi AV, Helman LJ, Mackall CL, et al. Tumor regression in patients with metastatic synovial cell sarcoma and melanoma using genetically engineered lymphocytes reactive with NY-ESO-1. J Clin Oncol. 2011;29:917–924. doi:10.1200/JCO.2010.32.2537.
- Robbins PF, Kassim SH, Tran TL, Crystal JS, Morgan RA, Feldman SA, Yang JC, Dudley ME, Wunderlich JR, Sherry RM, et al. A pilot trial using lymphocytes genetically engineered with an NY-ESO-1-reactive T-cell receptor: long-term follow-up and correlates with response. Clin Cancer Res. 2015;21:1019–1027. doi:10.1158/1078-0432.CCR-14-2708.
- Cameron BJ, Gerry AB, Dukes J, Harper JV, Kannan V, Bianchi FC, Grand F, Brewer JE, Gupta M, Plesa G, et al. Identification of a Titin-derived HLA-A1-presented peptide as a cross-reactive target for engineered MAGE A3-directed T cells. Sci Transl Med. 2013;5:197ra103. doi:10.1126/scitranslmed.3006034.
- Linette GP, Stadtmauer EA, Maus MV, Rapoport AP, Levine BL, Emery L, Litzky L, Bagg A, Carreno BM, Cimino PJ, et al. Cardiovascular toxicity and titin cross-reactivity of affinity-enhanced T cells in myeloma and melanoma. Blood. 2013;122:863–871. doi:10.1182/blood-2013-03-490565.
- Morgan RA, Chinnasamy N, Abate-Daga D, Gros A, Robbins PF, Zheng Z, Dudley ME, Feldman SA, Yang JC, Sherry RM, et al. Cancer regression and neurological toxicity following anti-MAGE-A3 TCR gene therapy. J Immunother. 2013;36:133–151. doi:10.1097/CJI.0b013e3182829903.
- Parkhurst MR, Yang JC, Langan RC, Dudley ME, Nathan D-AN, Feldman SA, Davis JL, Morgan RA, Merino MJ, Sherry RM, et al. T cells targeting carcinoembryonic antigen can mediate regression of metastatic colorectal cancer but induce severe transient colitis. Mol Ther. 2011;19:620–626. doi:10.1038/mt.2010.272.
- Meek DW, Marcar L. MAGE-A antigens as targets in tumour therapy. Cancer Lett. 2012;324:126–132. doi:10.1016/j.canlet.2012.05.011.
- Caballero OL, Chen YT. Cancer/testis (CT) antigens: potential targets for immunotherapy. Cancer Sci. 2009;100:2014–2021. doi:10.1111/j.1349-7006.2009.01303.x.
- Daudi S, Eng KH, Mhawech-Fauceglia P, Morrison C, Miliotto A, Beck A, Matsuzaki J, Tsuji T, Groman A, Gnjatic S, et al. Expression and immune responses to MAGE antigens predict survival in epithelial ovarian cancer. PLoS One. 2014;9:e104099. doi:10.1371/journal.pone.0104099.
- Fratta E, Coral S, Covre A, Parisi G, Colizzi F, Danielli R, Marie Nicolay HJ, Sigalotti L, Maio M. The biology of cancer testis antigens: putative function, regulation and therapeutic potential. Mol Oncol. 2011;5:164–182. doi:10.1016/j.molonc.2011.02.001.
- Alves PM, Levy N, Bouzourene H, Viatte S, Bricard G, Ayyoub M, Vuilleumier H, Givel J-CR, Halkic N, Speiser DE, et al. Molecular and immunological evaluation of the expression of cancer/testis gene products in human colorectal cancer. Cancer Immunol Immunother. 2007;56:839–847. doi:10.1007/s00262-006-0228-5.
- Barrow C, Browning J, MacGregor D, Davis ID, Sturrock S, Jungbluth AA, Cebon J. Tumor antigen expression in melanoma varies according to antigen and stage. Clin Cancer Res. 2006;12:764–771. doi:10.1158/1078-0432.CCR-05-1544.
- Otte M, Zafrakas M, Riethdorf L, Pichlmeier U, Löning T, Jänicke F, Pantel K. MAGE-A gene expression pattern in primary breast cancer. Cancer Res. 2001;61:6682–6687.
- Tajima K, Obata Y, Tamaki H, Yoshida M, Chen Y-T, Scanlan MJ, Old LJ, Kuwano H, Takahashi T, Takahashi T, et al. Expression of cancer/testis (CT) antigens in lung cancer. Lung Cancer. 2003;42:23–33. doi:10.1016/S0169-5002(03)00244-7.
- Grossman RL, Heath AP, Ferretti V, Varmus HE, Lowy DR, Kibbe WA, Staudt LM. Toward a Shared Vision for Cancer Genomic Data. N Engl J Med. 2016;375:1109–1112. doi:10.1056/NEJMp1607591.
- Peters B, Sette A. Generating quantitative models describing the sequence specificity of biological processes with the stabilized matrix method. BMC Bioinformatics. 2005;6:132. doi:10.1186/1471-2105-6-132.
- Kunert A, Obenaus M, Lamers CHJ, Blankenstein T, Debets R. T-cell Receptors for Clinical Therapy: in Vitro Assessment of Toxicity Risk. Clin Cancer Res. 2017;23:6012–6020. doi:10.1158/1078-0432.CCR-17-1012.
- Harper J, Adams KJ, Bossi G, Wright DE, Stacey AR, Bedke N, Martinez-Hague R, Blat D, Humbert L, Buchanan H, et al. An approved in vitro approach to preclinical safety and efficacy evaluation of engineered T cell receptor anti-CD3 bispecific (ImmTAC) molecules. PLoS One. 2018;13:e0205491. doi:10.1371/journal.pone.0205491.
- Pampaloni F, Reynaud EG, Stelzer EH. The third dimension bridges the gap between cell culture and live tissue. Nat Rev Mol Cell Biol. 2007;8:839–845. doi:10.1038/nrm2236.
- Mason D. A very high level of crossreactivity is an essential feature of the T-cell receptor. Immunol Today. 1998;19:395–404. doi:10.1016/S0167-5699(98)01299-7.
- Sewell AK. Why must T cells be cross-reactive?. Nat Rev Immunol. 2012;12:669–677. doi:10.1038/nri3279.
- Wooldridge L, Ekeruche-Makinde J, van den Berg HA, Skowera A, Miles JJ, Tan MP, Dolton G, Clement M, Llewellyn-Lacey S, Price DA, et al. A single autoimmune T cell receptor recognizes more than a million different peptides. J Biol Chem. 2012;287:1168–1177. doi:10.1074/jbc.M111.289488.
- Bendle GM, Linnemann C, Hooijkaas AI, Bies L, de Witte MA, Jorritsma A, Kaiser AD, Pouw N, Debets R, Kieback E, et al. Lethal graft-versus-host disease in mouse models of T cell receptor gene therapy. Nat Med. 2010;16:565–570. 561p following 570. doi:10.1038/nm.2128.
- van Loenen MM, de Boer R, Amir AL, Hagedoorn RS, Volbeda GL, Willemze R, van Rood JJ, Falkenburg JF, Heemskerk MH. Mixed T cell receptor dimers harbor potentially harmful neoreactivity. Proc Natl Acad Sci U S A. 2010;107:10972–10977. doi:10.1073/pnas.1005802107.
- Birnbaum ME, Mendoza JL, Sethi DK, Dong S, Glanville J, Dobbins J, Özkan E, Davis MM, Wucherpfennig KW, and Garcia KC. Deconstructing the peptide-MHC specificity of T cell recognition. Cell. 2014;157:1073–1087. doi:10.1016/j.cell.2014.03.047.
- Kula T, Dezfulian MH, Wang CI, Abdelfattah NS, Hartman ZC, Wucherpfennig KW, Lyerly HK, Elledge SJ, et al. T-scan: a genome-wide method for the systematic discovery of T cell epitopes. Cell. 2019;178:1016–1028 e1013. doi:10.1016/j.cell.2019.07.009.
- Li Pira G, Ivaldi F, Bottone L, Manca F. High throughput functional microdissection of pathogen-specific T-cell immunity using antigen and lymphocyte arrays. J Immunol Methods. 2007;326:22–32. doi:10.1016/j.jim.2007.06.012.
- UniProt Consortium T. UniProt: the universal protein knowledgebase. Nucleic Acids Res. 2018;46:2699. doi:10.1093/nar/gky092.
- Sherry ST, Ward MH, Kholodov M, Baker J, Phan L, Smigielski EM, and Sirotkin K. dbSNP: the NCBI database of genetic variation. Nucleic Acids Res. 2001;29:308–311. doi:10.1093/nar/29.1.308.