
ABSTRACT
Hematological malignancies possess a distinctive immunologic microenvironment compared with solid tumors. Here, using an established computational algorithm (CIBERSORT), we systematically analyzed the overall distribution of 22 tumor-infiltrating leukocyte (TIL) populations in more than 2000 bone marrow (BM) samples from 5 major hematological malignancies and healthy controls. Focusing on significantly altered TILs in acute myeloid leukemia (AML), we found that patients with AML exhibited increased frequencies of M2 macrophages, compared to either healthy controls or the other four malignancies. High infiltration of M2 macrophages was associated with poor outcome in AML. Further analysis revealed that CD206, a M2 marker gene, could faithfully reflect variation in M2 fractions and was more highly expressed in AML than normal controls. High CD206 expression predicted inferior overall survival (OS) and event-free survival (EFS) in two independent AML cohorts. Among 175 patients with intermediate-risk cytogenetics, the survival still differed greatly between low and high CD206 expressers (OS; P < .0001; 3-year rates, 56% v 32%; EFS; P < .001; 3-year rates, 47% v 25%). When analyzed in a meta-analysis, CD206 as a continuous variable showed superior predictive performance than classical prognosticators in AML (BAALC, ERG, EVI1, MN1, and WT1). In summary, M2 macrophages are preferentially enriched in AML. The M2 marker CD206 may serve as a new prognostic marker in AML.
Introduction
Acute myeloid leukemia (AML) is a group of hematopoietic disorders marked by arrested differentiation and uncontrolled proliferation of myeloid cells.Citation1 Despite our improved understanding of the mechanism of leukemogenesis and advances in therapeutic strategies, the clinical outcome of AML remains generally unsatisfactory.
Current prognostic schemes in AML are largely based on karyotypic information;Citation2 for patients without cytogenetic abnormalities, molecular genetic alterations have been shown to predict outcome, with the NPM1 mutations and biallelic CEBPA mutations already incorporated as distinct entities in the current World Health Organization classification of AML.Citation3 An increasing number of transcriptomic and epigenomic signatures have also been associated with prognosis in AML.Citation4–Citation6 Most of these predictive markers, however, remain investigational. To develop clinically practicable markers, the findings must be properly validated, or, results from independent studies could be integrated using a meta-analysis.
The malignant phenotypes of cancer are contributed not only by tumor-intrinsic alterations but also by the cellular environment around it, especially the immune cells.Citation7 This could be demonstrated by the remarkable efficacy of immune checkpoint inhibitors in treating multiple cancers,Citation8,Citation9 in which the anti-tumor immunity was enhanced by blocking immune checkpoints like CTLA-4, PD-1, and PD-L1.Citation10 Another type of evidence is the prognostic relevance of tumor-infiltrating leukocytes (TILs) in cancers.Citation11 For example, the presence of cytotoxic CD8 + T cells is known as an indicator of good prognosis in colorectal, ovarian, and esophageal cancer; whereas a high proportion of immunosuppressive cells, such as regulatory T-cells (Treg), M2-polarized tumor-associated macrophages (TAMs), and myeloid-derived suppressor cells (MDSCs), is reported to predict worse outcome in several cancer types.Citation11 Nevertheless, hampered by methodological barriers, these studies can only deal with few cell types or limited samples sizes. Recent progress in computational methods has prompted the investigation of diverse TIL subpopulations simultaneously using large-scale genomic data,Citation12 providing us with a more comprehensive view of the clinical implications of TILs and also some novel insights into tumor–immune cell interactions. However, most of these studies have been performed on solid tumors, leaving the role of TILs in hematological malignancies largely unknown.
Indeed, the immunologic microenvironment of hematological malignancies is quite distinctive. As for AML, it initiates and progresses in bone marrow (BM) where most immune cells develop and reside, thus compromising the anti-leukemia immunity and making it a poorly immunogenic cancer. Also, AML is highly immunosuppressive. For example, the frequency of Tregs is significantly higher in AML compared to healthy controls,Citation13 and elevated immunosuppressive factors, like indoleamine 2,3-dioxygenase 1 (IDO1), is often observed in AML and closely associated with a poor outcome.Citation14 Recently, a gene expression-based deconvolution algorithm, CIBERSORT, has been used to investigate the immune infiltration status in a pan-cancer analysis and revealed remarkable differences in immune cell composition between hematopoietic and solid tumors.Citation15 However, no study has thus far evaluated the differential composition of multiple TILs between AML and normal specimens, or even other hematological malignancies. In this study, we attempted to address this gap by applying CIBERSORT to a relatively large cohort including five major hematological malignancies and healthy controls. We found that M2 macrophages fractions were increased significantly in AML compared with normal controls. We have also shown that M2 macrophage infiltration could be reflected by CD206 expression in AML. CD206, also known as mannose receptor C type 1 (MRC1), is a cell-surface protein abundantly presents on selected populations of macrophages and dendritic cells.Citation16 As for macrophages, CD206 is normally expressed on the M2 but not M1 subtype and therefore serves as a useful marker to identify the M2 phenotype. In a recent study, Mussai et alCitation17 reported that CD206 expression was significantly increased on M2-like monocytes induced by AML blasts and reduced when this phenotype was inhibited. In this study, we have found that CD206 expression is significantly up-regulated in AML compared to healthy controls, and that high CD206 expression confers an adverse prognostic influence in AML patients. We believe that CD206 could serve as a clinically useful biomarker if prospectively validated.
Materials and methods
Patient samples and data sets
All data sets used in this study are publicly available: microarray and RNA-seq gene-expression (GE) data were retrieved from Gene Expression Omnibus (GEO, http://www.ncbi.nlm.nih.gov/geo/) and The Cancer Genome Atlas (TCGA, https://cancergenome.nih.gov/), respectively. The detailed information of each data set regarding platforms and sample sizes are summarized in Supplementary Data 1. For Affymetrix microarray data, raw CEL files were normalized with the gcRMA algorithm (GeneSpring GX software, Agilent) and subsequently log2 transformed. For cDNA microarray data (GSE425), where raw GE data was not available, we employed the normalized matrix file instead. Genes with multiple probes were represented by the probe with the highest average GE in each data set.
Three independent data sets were used to estimate the immune cellular fraction (GSE13159, GSE10358, and GSE6891; hereafter referred to as Cohort 1, Cohort 2, and Cohort 3), in which the latter two cohorts were available for clinical outcome information. Cohort 1 consisted of 2096 patients enrolled in the MILE (Microarray Innovations in LEukemia) study,Citation18 encompassing five major types of hematological malignancies, that is, acute myeloid leukemia (AML, n = 542), acute lymphoblastic leukemia (ALL, n = 750), chronic myeloid leukemia (CML, n = 76), chronic lymphocytic leukemia (CLL, n = 448), and myelodysplastic syndrome (MDS, n = 206); it also includes normal bone marrow samples (NBM, n = 74) as healthy controls. Cohort 2 consisted of samples from 304 de novo AML patients (269 cases with outcome data) treated per the NCCN guidelines (www.nccn.org); this is also part of the TCGA study of AML.Citation19 Cohort 3 comprised of 460 adult AML patients (293 cases with outcome data) treated according to the protocols of the Dutch-Belgium Hemato-Oncology Cooperative Group (HOVON) (available at http://www.hovon.nl).Citation20,Citation21 For these two cohorts, survival information was obtained from the corresponding study or research group, respectively. Both cohorts were available for clinical end points including overall survival (OS) and event-free survival (EFS), which distributed similarly between the two cohorts (Cohort 2, median OS 19.7 months, median EFS, 11.6 months; Cohort 3, median OS 20.5 months, median EFS, 10.9 months).
In a meta-analysis evaluating the predictive value of CD206, we further collected 4 datasets containing survival information from public repositories (GSE37642, GSE425, GSE12417, and TCGA RNA-Seq). The GSE37642 and GSE12417 datasets both include two independent patient cohorts, which were profiled on the Affymetrix U133 Plus 2.0 (cohort 1) and U133A platforms (cohort 2), respectively. To calculate the meta-estimates for OS in AML patients with mixed cytogenetic subtypes, five datasets (GSE10358, GSE6891, GSE37642, GSE425, and TCGA RNA-Seq) were used. Except for GSE37642 (whose cytogenetic information was missing), CN-AML subsets from GSE10358 (n = 113), GSE6891 (n = 129), GSE425 (n = 45) and TCGA RNA-Seq data (n = 80), along with GSE12417 comprising exclusively CN-AML cases (cohort 1, n = 79; cohort 2, n = 163), were used to assess the predict performance of CD206 in CN-AML cohorts. Meta-analysis concerning EFS was based on three datasets with available EFS data (GSE10358, GSE6891, and TCGA RNA-Seq).
Estimation of immune cell fractions
Relative immune cell fractions were estimated using the CIBERSORT algorithm,Citation22 based on a reference expression signature containing 547 genes (LM22) that distinguish 22 immune cell subtypes. Briefly, normalized gene expression data were uploaded to the CIBERSORT web portal (http://cibersort.stanford.edu/), with the data matrices prepared according to the example mixtures file. Then, CIBERSORT algorithm was running using the default LM22 signature matrix at 1000 permutations. After running, only samples with CIBERSORT p-values < 0.05 were included in subsequent analyses. To display the overall distribution of TIL subtypes among hematological malignancies and controls, mean TIL fractions across samples of each disease type were calculated and depicted as stacked bar charts. Student’s t-tests were applied to identify TIL subpopulations that were differentially enriched between AML and controls, controlling for the false discovery rate (FDR) by the Benjamini–Hochberg method (FDR < 0.05). Association between TIL subsets was done using Pearson correlation and the resulting correlation matrices were visualized using the corrplot R package. Subsequently, univariable Cox regression analysis was performed to evaluate the association between TIL proportions and survival in AML patients, with relative proportions of each cell type tested as continuous variables.
The key findings from CIBERSORT analyses were also validated by xCell (http://xCell.ucsf.edu/), a novel method for TIL enumeration that was rigorously developed.Citation23 xCell is implemented using a single sample gene set enrichment analysis (ssGSEA) algorithm, which allows calculating the enrichment scores for 64 immune and stromal cell types from gene expression profiles.
Recalculation of the LI24 and LSC17 score
The LI24 score, originally developed by Li et al.Citation24, composed of 24 genes that were derived from a meta-analysis of Cox-regression values of OS from four training sets. While the LSC17 score comprising 17 “stemness” signature genes were developed from a training cohort and highly prognostic in multiple cohorts.Citation25 To recalculate the LI24 score, probe sets of the 24 genes were obtained from the two datasets (GSE10358 and GSE6891) (Cohort 2 and Cohort 3). In the case of genes with multiple probe sets, the average expression value for a given gene was used. For genes in the LSC17 score, probe set with the highest mean expression was selected to represent each gene. To generate the LI24 and LSC17 score, log-transformed expression value of the 24 genes and log2-transformed plus scaled expression value of the 17 genes were weighted by their published regression coefficients, respectively. Finally, a median risk score was used to divide patients into high- and low-risk groups.
Statistical analysis
All statistical analyses were performed using the R software version 3.5.3 (https://www.r-project.org/). For comparison of two continuous variables, the data were presented as either violin plots or boxplots using the ggplot2 package, with significance determined by Wilcoxon rank sum test. Chi-square test and Fisher’s exact test were used to evaluate the association between two categorical variables. Spearman correlation analysis was performed to determine the association between continuous gene expression levels. For survival analyses, patients were divided into high and low CD206 expressers, based on median CD206 expression levels. Kaplan–Meier survival curves were generated using the survminer package and compared between groups using a log-rank test. Multivariate Cox regression was employed to test whether high CD206 expression has independent prognostic value in AML.
The predictive performances of CD206 and other five prognosticators (BAALC, ERG, EVI1, MN1, and WT1) were assessed using the Harrell’s concordance index (C-index).Citation26 The C-index measures the agreement between observed and predicted survival, with a value of 0.5 indicating random prediction and 1 for perfect prediction. With the Cox regression models, we calculated the C-indices, hazard ratios (HRs), and p-values of the six genes in each dataset separately. Then, the respective estimates were combined across datasets according to survival endpoints (OS or EFS) and patient groups (cytogenetically heterogeneous AML patients or CN-AML patients). The C-indices and HRs were plotted with lower and upper 95% confidence interval (CI) as forest plots. All these analyses were performed using the R package survcomp. To identify gene signatures associated with CD206 expression, we performed differential gene expression analysis between high and low CD206 expressers using the limma package. All statistical analyses were two-sided and a p-value less than 0.5 were considered significant.
Results
Differential composition of TIL subpopulations in hematologic malignancies
Using CIBERSORT, we calculated the relative abundance of 22 immune cells in a dataset including 536 AML, 206 MDS, 76 CML, 74 NBM, 749 ALL, and 448 CLL samples.Citation18 As shown in , myeloid malignancies (AML, MDS, and CML) were generally dominated by myeloid cells like monocytes, whereas lymphocytes such as B and T cells were found more often in lymphoid leukemia (ALL and CLL). Specifically, neutrophils were preferentially enriched in CML; while in CLL, more than half of total immune cells were B cells. These observations indicate that CIBERSORT can faithfully reflect the cell of origin of human hematologic malignancies. Correlation analysis revealed that proportions of different TIL subsets were weakly to moderately related in AML (), NBM and other malignancies (Supplementary Figures S1-5), implying the ability of CIBERSORT to robustly discriminate TIL subpopulations in BM samples.
Figure 1. Differential composition of TIL subpopulations in hematologic malignancies. (a) Relative TIL fractions in the BMs of AML (n = 536), MDS (n = 206), CML (n = 76), NBM (n = 74), ALL (n = 749), and CLL (n = 448), as estimated from gene-expression data (GSE13159) using CIBERSORT. CIBERSORT results are represented as mean TIL fractions across samples for each disease type. (b) Heat map showing TIL subpopulations that were differentially infiltrated (FDR < 0.05) between AML and healthy controls. p-values were calculated by Student’s t-tests and adjusted for multiple testing (FDR). Side bar on the left denote immune cell types as indicated in (a). (c) Correlation matrix of all 22 immune cell proportions in AML patients from Cohort 1. Variables have been ordered according to the correlation coefficient using hierarchical clustering. (d and e) Violin plots showing the abundance of M2 (up panel) and M0 macrophages (bottom panel) in AML (n = 536) and controls (n = 74), as estimated by CIBERSORT (d) or xCell (e). Boxplots within violin plots show the median and interquartile range of the data distribution. The p-values calculated from Wilcoxon test are shown
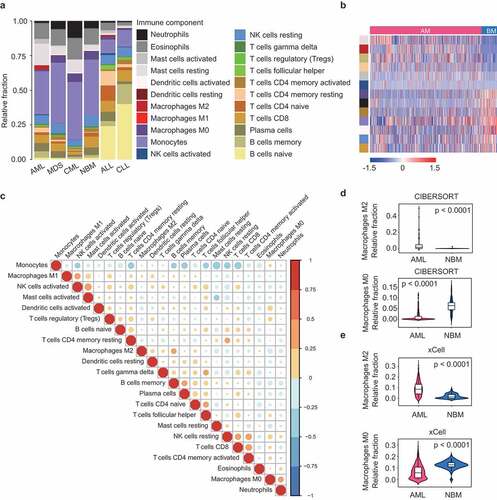
By focusing our analysis on AML, strikingly, we observed a significant enrichment of M2 macrophages (0–49%, median: 2%, in AML, vs 0-2%, median: 0%, in NBM, P < .0001) and a concomitant depletion of M0 macrophages (0–12%, median: 0%, in AML, vs 0–15%, median: 6%, in NBM, P < .0001) in AML, as compared to normal BM samples (). Similar results were found when the immune fractions were calculated by xCell (M2 macrophages, 0–31%, median: 9%, in AML, vs 0–8%, median: 1%, in NBM, P < .0001; M0 macrophages, 0–29%, median: 6%, in AML, vs 0–21%, median: 13%, in NBM, P < .0001) (). Importantly, the preferential enrichment of M2 macrophages in AML was also observed in another two AML cohorts (Cohort 2 and Cohort 3) (Supplementary Figures S6). We then compare TIL subtype fractions between AML and the other four hematological malignancies. Notably, M2 macrophage frequency was consistently higher in AML for all comparisons (Supplementary Figure S7). These observations might be explained by a previous report that AML blasts can act as an inducer of M2 polarization,Citation17 therefore leading to increased M2 macrophages from an unpolarized (M0) state. We also observed that AML was highly infiltrated by mast cells, which, like M2 macrophages, often exhibits tumor-promoting activities.Citation27 Moreover, the fraction of memory B cells, resting memory T cells, and activated NK cells was higher in AML than in NBM, while tumor-suppressive components like activated memory T cells, activated dendritic cells, and CD8 T cells were decreased in AML (). Detailed results of these differential analyses were provided in Supplementary Data 2. Overall, these findings were indicative of an immunosuppressive microenvironment in AML relative to healthy BM, consistent with previous observations.Citation17
Prognostic implication of TIL subpopulations in AML
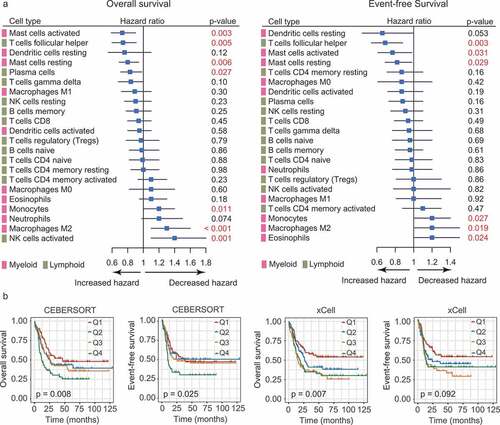
Next, we asked whether these immune components predict outcome in AML, as they have been reported in solid tumors.Citation11 To this end, we applied CIBERSORT to two AML datasets with survival information (Cohort 2 and Cohort 3). After filtering samples with CIBERSORT p-values less than 0.05, the estimated proportions of 22 cell subsets as continuous variables were correlated to the patients’ outcome. Although we observed no consistent prognostic significance of individual cell types between two cohorts, we did note that, in Cohort 2, M2 macrophages represented a significant negative predictor of clinical outcome (OS, P < .001, EFS, P = .019; ); while in cohort 3, M1 macrophages emerged as the only significant predictor for prolonged survival (OS, P = .027; EFS, P = .01; Supplementary Figure S8). These observations, albeit without mutual validation, were largely consistent with those documented in solid tumors.Citation28 Importantly, for M2 macrophages, the results remained significant when the cellular proportions were modeled as quartiles using log-rank test, or, estimated by xCell (). As for other cell types in Cohort 2, a higher fraction of activated mast cells, T follicular helper cells (Tfh cells), and resting mast cells was associated with both improved OS and EFS, whereas more infiltration of monocytes was correlated with both worse OS and EFS (). In Cohort 3, increased infiltration of Tregs and Tfh cells showed similar degrees of shorter survival (Supplementary Figure S8).
Figure 2. Prognostic associations of TIL subpopulations in AML. (a) Forest plots showing the associations of continuous TIL concentrations with overall survival (OS, left) and event-free survival (EFS, right) in Cohort 2. The hazard ratios (HRs) were plotted with lower and upper 95% confidence intervals (CI) in the forest plots. p-values were obtained from a univariate Cox regression analysis. (b) OS and EFS in AML patients (Cohort 2) defined by quartiles (Q1-Q4) of M2 macrophage abundances. The relative abundances of M2 macrophages were estimated by CIBERSORT (left panel) and xCell (right panel), respectively. Depicted p-values were calculated from log-rank tests
For all the immune cells analyzed, we considered M2 macrophages as the one who merits further investigation: it was previously shown to be induced by AML blasts; our results accordingly demonstrated its preferential enrichment and adverse prognostic impact in AML. Moreover, these results remained significant when M2 infiltration levels were estimated by xCELL ( and ).
CD206 expression reflects variation in M2 macrophage abundance and is up-regulated in AML patients
The above results have shed some light on the dysregulation of M2 macrophages in AML. We therefore further asked whether M2 macrophages marker genes were similarly altered in AML. Based on the published literature,Citation29 we selected CD68, CD163, CD204, and CD206 as surrogate markers for M2 macrophages. First, AML patients in three cohorts were dichotomized at the median of M2 infiltrating levels, mRNA expressions of the four genes were then compared between patients with high and those with low M2 infiltration. As shown in , only CD206 was able to accurately reflect the abundances of M2 macrophages in all AML cohorts, as compared to the other three markers. This finding is consistent with a previous study showing that CD206 was significantly up-regulated on induced M2-like cells in AML patients.Citation17 In addition, we compared CD206 expression between high and low levels of dendritic cells (resting and activated), since CD206 could also be expressed on certain dendritic cell subpopulations.Citation16 Significant association was observed with resting dendritic cells, but not with activated dendritic cells for all comparisons (Supplementary Figure S9). We also examined the association between CD206 the three macrophage markers. CD206 expression showed significant and positive correlations with the expression levels of CD68, CD163, and CD204 in all the three datasets (Supplementary Figure S10). The strongest correlation was found between CD206 and CD163, a marker routinely used to identify the M2 phenotype. Although we cannot rule out the presence of CD206 on dendritic cells, our analysis nonetheless supports CD206 as a potentially valid marker for M2 macrophages in AML.
Figure 3. CD206 expression reflects variation in M2 macrophage abundance and is more highly expressed in AML patients than normal controls. (a) mRNA levels of M2 marker genes (CD68, CD163, CD206, and CD204) between patients with high (above median) and low (below median) M2 macrophage abundances in three AML cohorts. Data are presented as median and IQR. The p-value from Wilcoxon test is shown. (b) Boxplots showing CD206 expression in AML and normal controls using GEPIA (http://gepia.cancer-pku.cn/detail.php?gene=&clicktag=boxplot) and two published datasets (GSE24006 and GSE63270). (c) Dot chart comparing the expression levels of CD206 in sorted monocyte-like cells from AMLs (n = 2385) and monocytes from normal BM (n = 567), as assessed by single-cell RNA-sequencing (van Galen P et al., 2019)
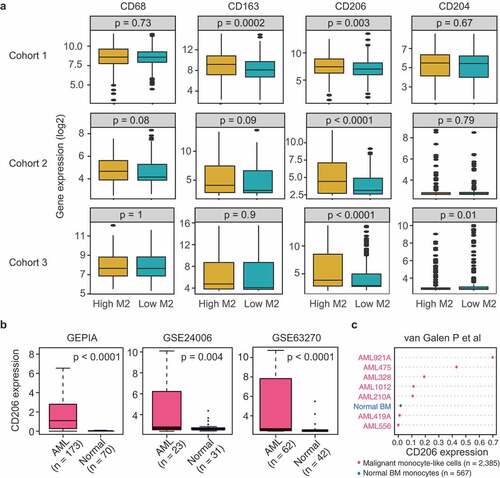
The next question was whether CD206 was up-regulated in AML as M2 macrophages did. Using the bioinformatics tool GEPIA (http://gepia.cancer-pku.cn/detail.php?gene=&clicktag=boxplot) and two published datasets (GSE24006 and GSE63270), we found remarkably higher expression of CD206 in AML patients than normal controls (). Furthermore, the up-regulation of CD206 was also observed in sorted malignant monocyte-like cells from AML patients compared to their normal counterparts (), as demonstrated by a recently published single-cell RNA-seq data.Citation30 These data together suggest that CD206 expression is commonly altered in AML and could be indicative of the status of M2 macrophages.
Prognostic impact of high CD206 expression in AML
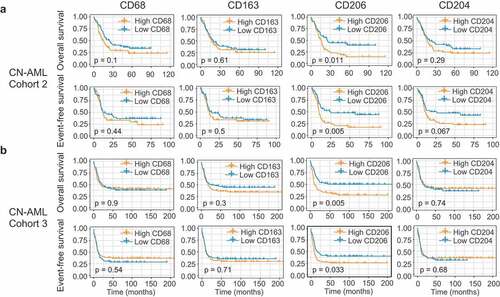
Next, we examined the prognostic effect of the four genes in Cohort 2 (n = 269). Remarkably, we found that 3 of the 4 genes – CD68, CD163, and CD206 – whose increased expression levels were significantly associated with worse OS (P = .009, P = .023, and P = .001, respectively; Supplementary Figure S11A); though for EFS only CD206 showed a trend toward significance (P = .058, Supplementary Figure S11B). Restricting analyses to AML patients with a normal karyotype (CN-AML), however, CD206 emerged as the only significant predictor both for OS (P = .011) and EFS (P = .005) (). We also tested the prognostic value of these genes in a validation cohort (Cohort 3, n = 293). While increased expression of CD68, CD163, and CD204 have failed to show any association with survival in this cohort (Supplementary Figure S11B), high CD206 levels were again significantly associated with shorter OS (P < .001) and EFS (P = .001) (Supplementary Figure S11B). Similar results were observed in AML cases with a normal karyotype (CN-AML cases) (). Overall, these analyses allowed us to validate CD206 as a strong prognosticator both in the full cohort as well as in the CN-AML subset.
Figure 4. Identification of CD206 as a predictor of outcome in AML. (a and b) OS and EFS analyses based on mRNA expression levels of the four M2 marker genes (CD68, CD163, CD206, and CD204) in CN-AML patients from Cohort 2 (a) and Cohort 3 (b). Patients were stratified in two groups using the median expression value as a cutoff. The p-values were computed using log-rank tests
Finally, multivariate analyses were performed for these two cohorts. In a multivariate model for Cohort 2, high CD206 expression independently predicted poor OS (P = .001) after adjusting for age and NPM1 status, and poor EFS (P = .02) after adjusting for age, FLT3-ITD, and NPM1 status (Supplementary Table S1). In Cohort 3, patients with high CD206 expression had a shorter OS (P = .03) and a trend for shorter EFS (P = .06) when controlling for FLT3-ITD, NPM1, and CEBPA mutation status, and cytogenetic risk group (Supplementary Table S1). Among CN-AML patients, CD206 remained an independent predictor of shorter OS and EFS for both cohorts (). Next, we tested if mutations such as TP53, DNMT3A, TET2, RUNX1, IDH1/2, ASXL1, and NRAS affected the prognostic impact of CD206 expression in the TCGA cohort, since extensive mutational profiling data was available only for this cohort. The previously described molecular mutations and CD206 expression as well as common clinical parameters (age, WBC count, cytogenetic risk group) were first analyzed in a univariate analysis (data not shown). Variables with a p-value less than 0.2 were further included in a multivariate model for OS and EFS, respectively. In the whole cohort, high CD206 expression independently predicted worse EFS (P = .04) when controlling for WBC count (P = .008) (Supplementary Table S2). However, it was not independently associated with OS after adjusting for other covariates (P = .27) (Supplementary Table S2). Moreover, the independent prognostic value of CD206 for OS and EFS was lost in the CN-AML subsets (OS, P = .14; EFS, P = .11) (Supplementary Table S2). Larger prospective studies should, however, be investigated to evaluate these results.
Table 1. Multivariate analysis of CD206 expression for overall survival and event-free survival in CN-AML subsets of the two independent cohorts
Additional value of CD206 expression in refining risk stratification in AML
The prominent prognostic role of CD206 status led us to hypothesize that it may add prognostic value to the established prognostication systems. To date, cytogenetics remains as the mainstay for risk assessment in AML patients; however, for those assessed as intermediate risk, survival outcomes and treatment responses differed substantially. We thus tested the prognostic value of CD206 in this heterogeneous group of AML patients. In Cohort 3, 60% (175/293) of patients were classified as intermediate risk based on cytogenetic information. Using CD206 status as the classifier, this group could be further dichotomized into two groups with remarkably different outcomes: The favorable group had a 3-year OS of 56% and a 3-year EFS of 47%, with median OS not reached and a median EFS of 25.7 months; while the unfavorable group only had a 3-year OS of 32% and a 3-year EFS of 25%, with a median OS of 13 months and a median EFS of 8.4 months (P < .0001 for OS and P < .001 for EFS; ).
Figure 5. Prognostic value of CD206 expression in the context of established risk stratification schemes. (a) OS and EFS according to CD206 expression levels among intermediate-risk patients from Cohort 3. (b) OS of CN-AML patients (Cohort 3) in the ELN Favorable (left) and ELN Intermediate-I (right) genetic groups, according to CD206 expression levels. (c and d) OS and EFS of patients from Cohort 2 (left) and from Cohort 3 (right) as stratified by the LI24 (c) and the LSC17 (d) signature. Patients with a low and high risk score were further dichotomized according to CD206 expression levels
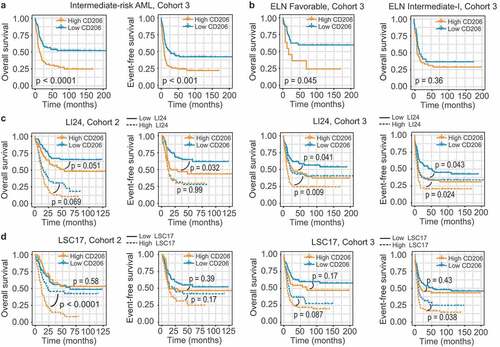
The European Leukemia Net (ELN) risk scheme complements cytogenetics by further stratifying CN-AML patients into two risk groups: ELN Favorable and ELN Intermediate-I.Citation31 For the two cohorts analyzed, only CN-AML cases from Cohort 3 can be subdivided using this scheme (OS; P = .008; EFS; P = .012; Supplementary Figure S12A). Indeed, for OS, high CD206 expression even identified a small number of high-risk patients within the ELN Favorable group (median OS 17.1 months, 3-year OS 36% versus median OS not reached, 3-year OS 63% for patients with high and low CD206 expression, respectively; P = .045; ). In the ELN Intermediate-I category, however, CD206 lost its prognostic impact (P = .36, ). For EFS, CD206 expression status was no longer significant in predicting patient outcome, both in the ELN Favorable and Intermediate-I categories (Supplementary Figure S12B).
Several gene expression-based prognostic models have been proposed recently. Two of them-LI24 and LSC17-have demonstrated their superior prognostic performance and ability to improve risk stratification for AML patients.Citation24,Citation25 It is therefore also interesting to test the predictive power of CD206 expression in the context of these novel schemes. We generated both models in our two cohorts and patients were stratified into high- and low-risk groups accordingly (). When applied to each risk group stratified by LI24, CD206 expression remained a significant predictor for OS and EFS in most instances, either within high- or low-risk groups (). For subgroups divided by LSC17, CD206 status appears to dichotomize survival only in the high-risk group (). In summary, these results suggest CD206 as a good candidate for refining existing classification schemes.
Association between CD206 expression and treatment response
Good biomarkers are useful not only in facilitating risk assessment, but also in guiding therapeutic decisions. The recently published Beat AML dataset is the largest study to date that investigates the association between genetic data (whole-exome and RNA sequencing) and drug sensitivity in AML. In this cohort (n = 562), 411 patients were available for both gene expression and clinical data. Among the 320 patients underwent standard chemotherapy, 184 (57.5%) patients achieved a complete response (CR), 105 (32.8%) patients showed a refractory disease, and 31 (9.7%) patients has no available therapy response information. The whole cohort (n = 411) were first divided into two groups based on the median expression value of CD206. Patients with higher CD206 expression had a lower response rate to induction chemotherapy, with a CR rate of 56.9% versus 70.3% for patients with lower CD206 expression (P = .018). Additionally, CD206 expression in CR specimens (n = 203) was significantly lower than refractory specimens (n = 116) (P = .041, ).
Figure 6. Association between CD206 expression and treatment response. (a) Boxplot showing CD206 expression in samples from patients achieving a complete response (n = 203) and patients showing a refractory disease (n = 116) in the Beat AML cohort. The p-value from Wilcoxon test is shown. (b and c) Kaplan–Meier curves of OS and EFS for patients with high (b) or low (c) CD206 expression as stratified by treatment options (alloSCT versus no alloSCT) in the TCGA cohort. alloSCT, allogeneic stem cell transplantation
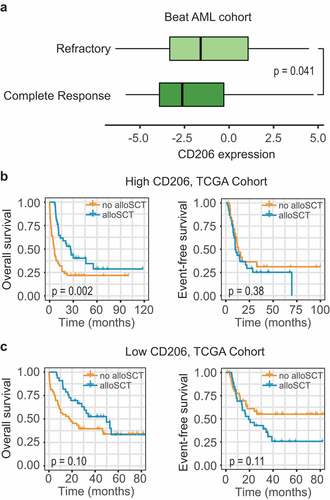
Allogeneic stem cell transplantation (alloSCT), an intensive therapeutic strategy, is often performed on high-risk patients due to treatment-associated modalities. To explore the impact of alloSCT according to CD206 status, subgroup analysis was performed on 183 patients with treatment information (TCGA cohort), as stratified by donor status. Among patients with high CD206 expression, OS was significantly improved for the donor group (median OS 26.3 months, 3-year OS 40%) compared with the no-donor group (median OS 6 months, 3-year OS 22%; P = .002; ); but this benefit no longer retained for EFS (P = .38; ). In patients with low CD206 expression, the outcome was not significantly influenced by transplantation (OS, P = .10; EFS, P = .11, ).
Predictive performance of CD206 compared with other established prognostic markers
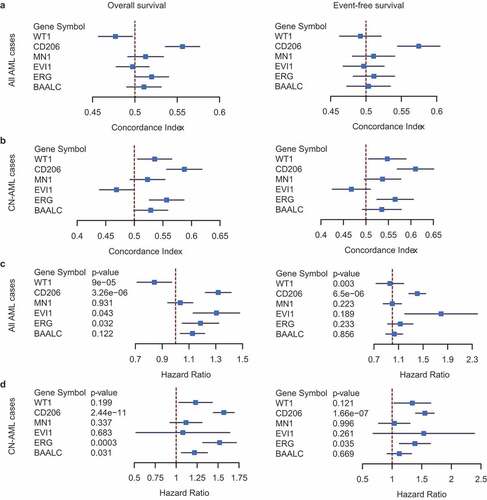
In order to evaluate the clinical utility of CD206 as well as to compare its predictive performance with other classical gene expression markers (BAALC, ERG, EVI1, MN1, and WT1), we further collected 4 datasets containing survival information from public repositories; these, together with the previous two datasets, allowed us to perform a meta-analysis of Cox regression estimates of each gene. Gene expression was treated as a continuous variable to ensure statistical robustness, and the performance of each gene was evaluated using Harrell’s concordance index (c-index). The estimated c-indexes of each gene were merged across datasets both in the entire AML population (Supplementary Figure S13) and in the CN-AML subsets (Supplementary Figure S14), for OS and EFS, respectively. The overall c-index of each gene was compared, as shown in the forest plots (). In the entire AML population, CD206 performed significantly better than all the other genes for both OS and EFS (). In CN-AML patients, the predictive performance of BAALC, ERG, MN1, and WT1 increased slightly but was still outperformed by CD206 (). We further computed the hazard ratio and Cox regression p-value of each gene across datasets (Supplementary Figures S15 and S16 for all AML cases and CN-AML cases, respectively), followed by a meta-analysis of these estimates (,D for all AML cases and CN-AML cases, respectively). Notably, the predictive power of CD206 was especially pronounced in CN-AML patients; it exhibited a highly significant association with survival in almost all CN-AML cohorts (Supplementary Figure S16), with an overall p-value of 2.44 × 10⁻¹¹ for OS and 1.66 × 10⁻⁷ for EFS (). ERG appeared as the only other gene that was significantly associated with both OS and EFS in CN-AML patients (P = .0003 and P = .035, respectively; ). Overall, this multi-cohort meta-analysis demonstrated CD206 as a robust tool for outcome prediction in AML patients. However, prospective clinical trials will be needed before it can be translated into routine clinical practice.
Figure 7. Predictive performance of CD206 for OS and EFS compared with classical prognostic markers (BAALC, ERG, EVI1, MN1, and WT1). (a and b) Forest plot reporting the overall concordance indices for the six genes in all AML cases (a) and CN-AML cases (b). The concordance indices were combined for datasets with OS information (left) and EFS information (right), respectively. (c and d) Forest plot reporting the overall hazard ratios and p-values for the six genes in all AML cases (c)and CN-AML cases (d). The hazard ratios and p-values were combined for datasets with OS information (left) and EFS information (right), respectively. The p-values were computed from Cox regression analysis in each dataset and combined using the weighted Z-method. Results for individual genes in each dataset were provided in Figure S13–16
Association of CD206 expression with morphologic, cytogenetic and genetic abnormalities
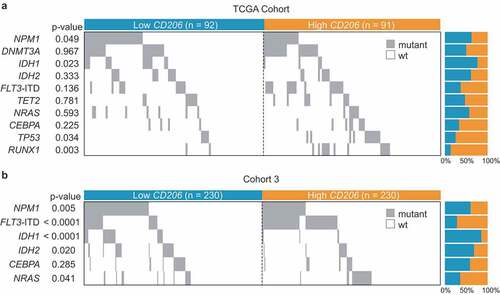
We also investigated the relationship of CD206 expression with morphologic, cytogenetic, and molecular abnormalities in Cohort 2 and Cohort 3. In Cohort 2, high CD206 expressers more often presented with M0 (P = .05) and M4 (P = .003) morphologies and less often with M3 (P = .0001) (). Associations with M4 subtypes could also be confirmed in Cohort 3 (P < .001) (). Concerning cytogenetics, high CD206 expression was nearly exclusively found in patients with inv(16) but less frequently found in t(15;17) cases; this was true for both Cohorts (). Since patients from Cohort 2 are also enrolled as part of the TCGA study of AML, and extensively annotated genomic data were available for the TCGA cohort, correlation of mutational data (the top 10 mutated genes) with CD206 expression was first performed in this cohort. The results show that high CD206 expression was positively associated with the presence of TP53 (P = .034) and RUNX1 mutations (P = .003), but inversely correlated with NPM1 (P = .049) and IDH1 mutations (P = .023) (). In Cohort 3, we found that higher CD206 expressers more frequently harbored FLT3-ITD (P < .0001) and NRAS (P = .041), and less frequently harbored NPM1 (P = .005), IDH1 (P < .001), and IDH2 (P = .02) mutations (). Overall, the negative relationships between high CD206 expression and NPM1 and IDH1 mutations were observed in both cohorts.
Table 2. Association of CD206 expression with morphologic and chromosomal abnormalities
Figure 8. Co-mutation plot showing the distribution of gene mutations in AML patients with low and high CD206 expression. (a) TCGA Cohort (n = 183); (b) Cohort 3 (n = 460). Each column represents an individual sample. Gray boxes indicate mutation and white boxes indicate wild type. ITD denotes internal tandem duplication
Gene expression signatures associated with CD206 expression
To further assess the role of CD206 in AML, we derived CD206-associated gene expression profiles using three independent AML datasets (GSE13159, n = 542; GSE10358, n = 304; and GSE6891, n = 460) (Cohort 1, Cohort 2, and Cohort 3). Probe sets with at least one fold change in “CD206 high” versus “CD206 low” patients and an adjusted p-value < 0.05 were identified, and were collapsed into unique genes. The differentially expressed genes from each comparison were intersected, and those existed in at least two gene lists were considered as the core signature (Supplementary Data 3). Among the genes positively correlated with CD206 expression, many were, like CD206 itself, established M2 markers, such as CD163, CD180, CD36, CD93, CLEC10A, MS4A4A, MS4A6A, and TGFBI. Some genes involved with monocyte/macrophage differentiation or migration were also identified, for example, S100A9, S100A12, MPEG1, MAFB, CCR1, CCR2, and SPARC. Besides, we found genes that were implicated in immune suppression and tumor progression, that is, CD200, VSIG4, and VCAN. It is important to note that, among these genes, CD36, S100A9, SPARC and CD200 were also reported as adverse prognostic factors in AML,Citation32–Citation35 providing further evidence for a pathogenetic link between M2 macrophages and leukemogenesis. Additional predictive markers in AML were found; these include the classical ones like CD34, BAALC, and MN1,Citation36–Citation40 and some newly-identified prognosticators, including CD52, HOPX, and VNN1.Citation41–Citation43 Importantly, CD52 was also known as a promising immunotherapy target in AML.Citation44 Few genes were negatively correlated with CD206 expression (only 6 were consistent in at least two datasets); among them was CRNDE, a long non-coding RNA recently reported as being associated with worse outcome in AML.Citation45
Discussion
Here, we performed a comprehensive analysis of the overall distribution of 22 TIL subpopulations in more than 2000 BM samples from control and 5 major hematological malignancies. Relative TIL proportions were estimated from gene expression profiles of these samples, using the state-of-the-art computer algorithm, CIBERSORT.Citation22 We found that patients with AML exhibit increased frequencies of M2 macrophages compared to either healthy controls or the other four hematological tumors. In line with this, Mussai et al.Citation17 have demonstrated that AML blasts can induce polarization of surrounding monocytes into M2-like cells, as indicated by elevated expression of the M2 marker CD206. Our findings also underscore the poor prognostic impact of M2 macrophages in AML patients. This observation, largely consistent with the published data in other cancer types,Citation28 indicating a tumor-promoting potential of M2 macrophages in AML. In solid tumors, M2 macrophages can not only suppress anti-tumor immune responses but also incite many malignant behaviors of tumor progression, including angiogenesis, invasion, metastasis, and persistent growth.Citation46 In AML, however, the pathological role of M2 macrophages is still largely unknown and needs to be elucidated in future studies.
Regarding other TIL subpopulations, Tregs were identified as an adverse prognosticator in Cohort 3, however, no increase of Tregs was seen in AML compared with controls; this is only partially consistent with a previous finding showing that Tregs expand in AML and high infiltration of Treg cells has been correlated with reduced remission rates following standard chemotherapy.Citation13 Interestingly, mast cells had higher proportions in AML than in controls, but it seems to be associated with a favorable outcome. The reason for this is difficult to elucidate: while both tumor-promoting and tumor-suppressive roles of mast cells have been described in cancers,Citation47 we concluded that mast cells can confer either good or poor prognosis depending on the context.
Although TIL concentrations calculated from CEBERSOT can provide novel prognostic information in AML, their clinical utility should be interpreted with some caveats in mind. First, the TIL frequencies were computationally inferred from microarray data: acquiring genome-wide expression data might be expensive and wasteful in clinical practice when large sample sizes are required. Second, experimental strategies, such as IHC or flow cytometry, are recommended to validate computational discoveries to avoid hasty conclusions. Third, discrepancies exist between patient cohorts regarding the prognostic impact of certain TIL subpopulations; they may be due to between-cohort heterogeneity in genetic background, tumor microenvironment, and treatment regimens-all would exert crucial influences on the individual’s immune response and therefore may complicate the prognostic impact of TILs. Overall, future functional immunological data and prospective validation will be required before this in silico approach can be used in a clinical setting.
Next, we sought to determine whether M2 macrophages marker genes would have a similar clinical effect in AML. Among four established markers of M2 macrophages-CD68, CD163, CD204, and CD206-we found that only CD206 can truthfully reflect variation in M2 concentrations in AML. This finding supports the previous report that CD206 was significantly increased on M2-polarized monocytes in AML and reduced when these cells were phenotypically reverted.Citation17 Further survival analyses demonstrated CD206 as a significant adverse predictor both for OS and EFS in AML patients. Our analyses have several strengths: the prognostic value of CD206 was discovered in two relatively large cohorts; in assessing predictive performance, CD206 expression was treated as a continuous variable, and the results were integrated from multiple independent cohorts using a meta-analysis, thereby increasing the statistical power of the study and allowing us to evaluate CD206 expression as a robust predictor for clinical outcome in AML patients. Nevertheless, the retrospective nature and heterogeneity among study populations could be the main limitations of this work. Therefore, prospective randomized studies will be required before CD206 expression can be translated clinically.
Another important finding relates to the prognostic value of CD206 expression in the context of well-established classification systems. The ELN classification, for example, stratifies CN-AML patients into two prognostically different subsets of patients, based on three molecular genetic markers.Citation31 This scheme, however, is only applicable for CN-AML cases from Cohort 3; we found that ELN Favorable patients within this cohort could be further dichotomized into prognostic subsets based on expression levels of CD206, suggesting that CD206 expression can be useful to refine accepted CN-AML classification scheme.
Despite such strong prognostic implications, the causal relationship between high CD206 expression and the adverse prognostic impact remains elusive. There are several potential explanations for this observation. First, as demonstrated above, high CD206 expression might only reflect a preferential enrichment of M2 macrophages. Therefore, it can be hypothesized that part of the prognostic value of CD206 could be attributed to major underlying differences of the density of infiltrating M2 macrophages. Indeed, CD206 has been used as a marker for detecting M2 macrophages in hepatocellular carcinoma (HCC) and elevated number of CD206+ M2 cells defined a subgroup of patients with inferior survival.Citation48,Citation49
The adverse prognostic impact of CD206 might also be explained by the distinct gene expression signatures associated with it. Among them were well-known prognostic markers in AML-BAALC, MN1, and CD34,Citation36–Citation40 and also some newly-identified strong prognosticators like CD52, HOPX, and VNN1.Citation41–Citation43 Importantly, several immunosuppressive factors were found, including CD200, VSIG4, and VCAN. It is noteworthy that CD200, a cell membrane protein like CD206, is frequently up-regulated in AML and associated with a poor patient outcome.Citation35 Functional studies have shown that the expression of CD200 on AML blasts could promote Treg formation while suppress the function of NK and memory T-cells.Citation50–Citation52 These observations suggest a causal link between immunosuppression and poor clinical outcomes in AML.
However, whether CD206 is directly implicated in leukemogenesis has not been answered. As previously demonstrated, CD206 could act as an adhesion molecule during leukocyte trafficking within the lymphatics; it might as well mediate cancer cell metastasis to the local lymph nodes.Citation53 Recently, we and others have shown that the dysregulation of cell adhesion proteins was a common feature in AML and had a profound impact on the clinical outcome.Citation54,Citation55 Thus, it is possible that the pro-metastasis potential of CD206 might allow leukemia cells to adopt an enhanced invasive capacity and more extensive extramedullary infiltration, finally leading to a worse patient outcome. Despite the evidence discussed above, the role of high CD206 expression in the leukemogenesis of AML remains to be defined.
In summary, we reported here that BM from AML patients exhibited higher levels of M2 macrophages than controls and patients with high M2 infiltration seem to have a worse prognosis. Furthermore, we described a novel strong prognosticator in AML, the M2 marker CD206, who had superior predictive performance than well-established prognostic markers. CD206 may also be useful in improving existing molecularly based risk classification schemes and in guiding the selection of therapeutic regimens. Future studies should prospectively validate our findings and determine the mechanisms by which high CD206 adversely impacted survival in AML.
Author contributions
JL, JQ, and Z-WM conceived and designed the study; Z-JX, YG, C-ZW, YJ, and L-JT collected and assembled data; Z-JX, X-MW, and J-CM performed data analysis; Z-JX drafted the manuscript; JL, JQ and Z-WM participated in study supervision and commented on the manuscript. All authors read and approved the final manuscript.
Disclosure of Potential Conflicts of Interest
No potential conflicts of interest were disclosed.
Supplementary material
Supplemental data for this article can be accessed on the publisher’s website.
Additional information
Funding
References
- Lowenberg B, Downing JR, Burnett A. Acute myeloid leukemia. N Engl J Med. 1999;341:1051–15. doi:10.1056/NEJM199909303411407.
- Slovak ML, Kopecky KJ, Cassileth PA, Harrington DH, Theil KS, Mohamed A, Paietta E, Willman CL, Head DR, Rowe JM, et al. Karyotypic analysis predicts outcome of preremission and postremission therapy in adult acute myeloid leukemia: a southwest oncology group/eastern cooperative oncology group study. Blood. 2000;96:4075–4083. doi:10.1182/blood.V96.13.4075.
- Swerdlow SH, Campo E, Harris NL, Jaffe ES, Pileri SA, Stein H, Thiele J, Arber DA, Hasserjian RP, Le Beau MM, et al. WHO classification of tumours of haematopoietic and lymphoid tissues (Revised 4th edition). IARC: Lyon; 2017. p. 141–145.
- Bullinger L, Dohner K, Bair E, Frohling S, Schlenk RF, Tibshirani R, Döhner H, Pollack JR. Use of gene-expression profiling to identify prognostic subclasses in adult acute myeloid leukemia. N Engl J Med. 2004;350:1605–1616. doi:10.1056/NEJMoa031046.
- Valk PJ, Verhaak RG, Beijen MA, Erpelinck CA, van Waalwijk B, van Doorn-Khosrovani S, Boer JM, Moorhouse MJ, van der Spek PJ, Löwenberg B, et al. Prognostically useful gene-expression profiles in acute myeloid leukemia. N Engl J Med. 2004;350:1617–1628. doi:10.1056/NEJMoa040465.
- Figueroa ME, Lugthart S, Li Y, Erpelinck-Verschueren C, Deng X, Christos PJ, Schifano E, Booth J, van Putten W, Skrabanek L, et al. DNA methylation signatures identify biologically distinct subtypes in acute myeloid leukemia. Cancer Cell. 2010;17:13–27. doi:10.1016/j.ccr.2009.11.020.
- Hanahan D, Weinberg RA. Hallmarks of cancer: the next generation. Cell. 2011;144:646–674. doi:10.1016/j.cell.2011.02.013.
- Topalian SL, Hodi FS, Brahmer JR, Gettinger SN, Smith DC, McDermott DF, Powderly JD, Carvajal RD, Sosman JA, Atkins MB, et al. Safety, activity, and immune correlates of anti-PD-1 antibody in cancer. N Engl J Med. 2012;366:2443–2454. doi:10.1056/NEJMoa1200690.
- Brahmer JR, Tykodi SS, Chow LQ, Hwu WJ, Topalian SL, Hwu P, Drake CG, Camacho LH, Kauh J, Odunsi K, et al. Safety and activity of anti-PD-L1 antibody in patients with advanced cancer. N Engl J Med. 2012;366:2455–2465. doi:10.1056/NEJMoa1200694.
- Pardoll DM. The blockade of immune checkpoints in cancer immunotherapy. Nat Rev Cancer. 2012;12:252–264. doi:10.1038/nrc3239.
- Senovilla L, Vacchelli E, Galon J, Adjemian S, Eggermont A, Fridman WH, Sautès-Fridman C, Ma Y, Tartour E, Zitvogel L, et al. Trial watch: prognostic and predictive value of the immune infiltrate in cancer. Oncoimmunology. 2012;1:1323–1343. doi:10.4161/onci.22009.
- Hackl H, Charoentong P, Finotello F, Trajanoski Z. Computational genomics tools for dissecting tumour-immune cell interactions. Nat Rev Genet. 2016;17:441–458. doi:10.1038/nrg.2016.67.
- Szczepanski MJ, Szajnik M, Czystowska M, Mandapathil M, Strauss L, Welsh A, Foon KA, Whiteside TL, Boyiadzis M. Increased frequency and suppression by regulatory T cells in patients with acute myelogenous leukemia. Clin Cancer Res. 2009;15:3325–3332. doi:10.1158/1078-0432.CCR-08-3010.
- Curti A, Aluigi M, Pandolfi S, Ferri E, Isidori A, Salvestrini V, Durelli I, Horenstein AL, Fiore F, Massaia M, et al. Acute myeloid leukemia cells constitutively express the immunoregulatory enzyme indoleamine 2,3-dioxygenase. Leukemia. 2007;21:353–355. doi:10.1038/sj.leu.2404485.
- Gentles AJ, Newman AM, Liu CL, Bratman SV, Feng W, Kim D, Nair VS, Xu Y, Khuong A, Hoang CD, et al. The prognostic landscape of genes and infiltrating immune cells across human cancers. Nat Med. 2015;21:938–945. doi:10.1038/nm.3909.
- Azad AK, Rajaram MV, Schlesinger LS. Exploitation of the macrophage mannose receptor (CD206) in infectious disease diagnostics and therapeutics. J Cytol Mol Biol. 2014;1. doi:10.13188/2325-4653.1000003
- Mussai F, De Santo C, Abu-Dayyeh I, Booth S, Quek L, McEwen-Smith RM, Qureshi A, Dazzi F, Vyas P, Cerundolo V, et al. Acute myeloid leukemia creates an arginase-dependent immunosuppressive microenvironment. Blood. 2013;122:749–758. doi:10.1182/blood-2013-01-480129.
- Haferlach T, Kohlmann A, Wieczorek L, Basso G, Kronnie GT, Bene MC, De Vos J, Hernández JM, Hofmann W-K, Mills KI, et al. Clinical utility of microarray-based gene expression profiling in the diagnosis and subclassification of leukemia: report from the international microarray innovations in leukemia study group. J Clin Oncol. 2010;28:2529–2537. doi:10.1200/JCO.2009.23.4732.
- Tomasson MH, Xiang Z, Walgren R, Zhao Y, Kasai Y, Miner T, Ries RE, Lubman O, Fremont DH, McLellan MD, et al. Somatic mutations and germline sequence variants in the expressed tyrosine kinase genes of patients with de novo acute myeloid leukemia. Blood. 2008;111:4797–4808. doi:10.1182/blood-2007-09-113027.
- Verhaak RG, Wouters BJ, Erpelinck CA, Abbas S, Beverloo HB, Lugthart S, Lowenberg B, Delwel R, Valk PJM. Prediction of molecular subtypes in acute myeloid leukemia based on gene expression profiling. Haematologica. 2009;94:131–134. doi:10.3324/haematol.13299.
- de Jonge HJ, Valk PJ, Veeger NJ, Ter Elst A, Den Boer ML, Cloos J, Haas VD, van Den Heuvel-Eibrink MM, Kaspers GJL, Zwaan CM, et al. High VEGFC expression is associated with unique gene expression profiles and predicts adverse prognosis in pediatric and adult acute myeloid leukemia. Blood. 2010;116:1747–1754. doi:10.1182/blood-2010-03-270991.
- Newman AM, Liu CL, Green MR, Gentles AJ, Feng W, Xu Y, Hoang CD, Diehn M, Alizadeh AA. Robust enumeration of cell subsets from tissue expression profiles. Nat Methods. 2015;12:453–457. doi:10.1038/nmeth.3337.
- Aran D, Hu Z, Butte AJ. xCell: digitally portraying the tissue cellular heterogeneity landscape. Genome Biol. 2017;18:220. doi:10.1186/s13059-017-1349-1.
- Li Z, Herold T, He C, Valk PJ, Chen P, Jurinovic V, Mansmann U, Radmacher MD, Maharry KS, Sun M, et al. Identification of a 24-gene prognostic signature that improves the European LeukemiaNet risk classification of acute myeloid leukemia: an international collaborative study. J Clin Oncol. 2013;31:1172–1181. doi:10.1200/JCO.2012.44.3184.
- Ng SW, Mitchell A, Kennedy JA, Chen WC, McLeod J, Ibrahimova N, Arruda A, Popescu A, Gupta V, Schimmer AD, et al. A 17-gene stemness score for rapid determination of risk in acute leukaemia. Nature. 2016;540:433–437. doi:10.1038/nature20598.
- Harrell FE Jr., Lee KL, Mark DB. Multivariable prognostic models: issues in developing models, evaluating assumptions and adequacy, and measuring and reducing errors. Stat Med. 1996;15:361–387. doi:10.1002/(SICI)1097-0258(19960229)15:4<361::AID-SIM168>3.0.CO;2-4.
- Maltby S, Khazaie K, McNagny KM. Mast cells in tumor growth: angiogenesis, tissue remodelling and immune-modulation. Biochim Biophys Acta. 2009;1796:19–26. doi:10.1016/j.bbcan.2009.02.001.
- Zhang QW, Liu L, Gong CY, Shi HS, Zeng YH, Wang XZ, Zhao YW, Wei YQ. Prognostic significance of tumor-associated macrophages in solid tumor: a meta-analysis of the literature. PLoS One. 2012;7:e50946. doi:10.1371/journal.pone.0050946.
- Komohara Y, Niino D, Ohnishi K, Ohshima K, Takeya M. Role of tumor-associated macrophages in hematological malignancies. Pathol Int. 2015;65:170–176. doi:10.1111/pin.2015.65.issue-4.
- van Galen P, Hovestadt V, Wadsworth Ii MH, Hughes TK, Griffin GK, Battaglia S, Verga JA, Stephansky J, Pastika TJ, Lombardi Story J, et al. Single-cell RNA-seq reveals AML hierarchies relevant to disease progression and immunity. Cell. 2019;176:1265–1281.e1224. doi:10.1016/j.cell.2019.01.031.
- Dohner H, Estey EH, Amadori S, Appelbaum FR, Buchner T, Burnett AK, Dombret H, Fenaux P, Grimwade D, Larson RA. Diagnosis and management of acute myeloid leukemia in adults: recommendations from an international expert panel, on behalf of the European LeukemiaNet. Blood. 2010;115:453–474.
- Perea G, Domingo A, Villamor N, Palacios C, Junca J, Torres P, Llorente A, Fernández C, Tormo M, Queipo de Llano MP, et al. Adverse prognostic impact of CD36 and CD2 expression in adult de novo acute myeloid leukemia patients. Leuk Res. 2005;29:1109–1116. doi:10.1016/j.leukres.2005.02.015.
- Hu S Y, Zhang M, Wu S Y, Wu D, Ashwani N, Pan J, He HL, Cen JN, Chen ZX,Chen CS. High transcription levels of S100A8 and S100A9 in acute myeloid leukemia are predictors for poor overall survival. Blood. 2013;122:2610. doi:10.1182/blood.V122.21.2610.2610
- Alachkar H, Santhanam R, Maharry K, Metzeler KH, Huang X, Kohlschmidt J, Mendler JH, Benito JM, Hickey C, Neviani P, et al. SPARC promotes leukemic cell growth and predicts acute myeloid leukemia outcome. J Clin Invest. 2014;124:1512–1524. doi:10.1172/JCI70921.
- Tonks A, Hills R, White P, Rosie B, Mills KI, Burnett AK, Darley RL. CD200 as a prognostic factor in acute myeloid leukaemia. Leukemia. 2007;21:566–568. doi:10.1038/sj.leu.2404559.
- Baldus CD, Tanner SM, Ruppert AS, Whitman SP, Archer KJ, Marcucci G, Caligiuri MA, Carroll AJ, Vardiman JW, Powell BL, et al. BAALC expression predicts clinical outcome of de novo acute myeloid leukemia patients with normal cytogenetics: a cancer and leukemia group B study. Blood. 2003;102:1613–1618. doi:10.1182/blood-2003-02-0359.
- Langer C, Radmacher MD, Ruppert AS, Whitman SP, Paschka P, Mrozek K, Baldus CD, Vukosavljevic T, Liu C-G, Ross ME, et al. High BAALC expression associates with other molecular prognostic markers, poor outcome, and a distinct gene-expression signature in cytogenetically normal patients younger than 60 years with acute myeloid leukemia: a cancer and leukemia group B (CALGB) study. Blood. 2008;111:5371–5379. doi:10.1182/blood-2007-11-124958.
- Heuser M, Beutel G, Krauter J, Dohner K, von Neuhoff N, Schlegelberger B, Ganser A. High meningioma 1 (MN1) expression as a predictor for poor outcome in acute myeloid leukemia with normal cytogenetics. Blood. 2006;108:3898–3905. doi:10.1182/blood-2006-04-014845.
- Langer C, Marcucci G, Holland KB, Radmacher MD, Maharry K, Paschka P, Whitman SP, Mrózek K, Baldus CD, Vij R, et al. Prognostic importance of MN1 transcript levels, and biologic insights from MN1-associated gene and microRNA expression signatures in cytogenetically normal acute myeloid leukemia: a cancer and leukemia group B study. J Clin Oncol. 2009;27:3198–3204. doi:10.1200/JCO.2008.20.6110.
- Rollig C, Thiede C, Gramatzki M, Aulitzky W, Bodenstein H, Bornhauser M, Platzbecker U, Stuhlmann R, Schuler U, Soucek S, et al. A novel prognostic model in elderly patients with acute myeloid leukemia: results of 909 patients entered into the prospective AML96 trial. Blood. 2010;116:971–978. doi:10.1182/blood-2010-01-267302.
- Blatt K, Herrmann H, Hoermann G, Willmann M, Cerny-Reiterer S, Sadovnik I, Herndlhofer S, Streubel B, Rabitsch W, Sperr WR, et al. Identification of campath-1 (CD52) as novel drug target in neoplastic stem cells in 5q-patients with MDS and AML. Clin Cancer Res. 2014;20:3589–3602. doi:10.1158/1078-0432.CCR-13-2811.
- Lin CC, Hsu YC, Li YH, Kuo YY, Hou HA, Lan KH, Chen TC, Tzeng YS, Kuo YY, Kao CJ, et al. Higher HOPX expression is associated with distinct clinical and biological features and predicts poor prognosis in de novo acute myeloid leukemia. Haematologica. 2017;102:1044–1053. doi:10.3324/haematol.2016.161257.
- Izzi V, Lakkala J, Devarajan R, Savolainen ER, Koistinen P, Heljasvaara R, Pihlajaniemi T. Vanin 1 (VNN1) levels predict poor outcome in acute myeloid leukemia. Am J Hematol. 2018;93:E4–e7. doi:10.1002/ajh.v93.1.
- Saito Y, Nakahata S, Yamakawa N, Kaneda K, Ichihara E, Suekane A, Morishita K. CD52 as a molecular target for immunotherapy to treat acute myeloid leukemia with high EVI1 expression. Leukemia. 2011;25:921–931. doi:10.1038/leu.2011.36.
- Wang Y, Zhou Q, Ma JJ. High expression of lnc-CRNDE presents as a biomarker for acute myeloid leukemia and promotes the malignant progression in acute myeloid leukemia cell line U937. Eur Rev Med Pharmacol Sci. 2018;22:763–770. doi:10.26355/eurrev_201802_14310.
- Condeelis J, Pollard JW. Macrophages: obligate partners for tumor cell migration, invasion, and metastasis. Cell. 2006;124:263–266. doi:10.1016/j.cell.2006.01.007.
- Theoharides TC, Conti P. Mast cells: the Jekyll and Hyde of tumor growth. Trends Immunol. 2004;25:235–241. doi:10.1016/j.it.2004.02.013.
- Dong P, Ma L, Liu L, Zhao G, Zhang S, Dong L, Xue R, Chen S. CD86(+)/CD206(+), diametrically polarized tumor-associated macrophages, predict hepatocellular carcinoma patient prognosis. Int J Mol Sci. 2016;17:320. doi:10.3390/ijms17030320.
- Ren CX, Leng RX, Fan YG, Pan HF, Li BZ, Wu CH, Wu Q, Wang NN, Xiong QR, Geng XP, et al. Intratumoral and peritumoral expression of CD68 and CD206 in hepatocellular carcinoma and their prognostic value. Oncol Rep. 2017;38:886–898. doi:10.3892/or.2017.5738.
- Coles SJ, Hills RK, Wang EC, Burnett AK, Man S, Darley RL, Tonks A. Increased CD200 expression in acute myeloid leukemia is linked with an increased frequency of FoxP3+ regulatory T cells. Leukemia. 2012;26:2146–2148. doi:10.1038/leu.2012.75.
- Coles SJ, Wang EC, Man S, Hills RK, Burnett AK, Tonks A, Darley RL. CD200 expression suppresses natural killer cell function and directly inhibits patient anti-tumor response in acute myeloid leukemia. Leukemia. 2011;25:792–799. doi:10.1038/leu.2011.1.
- ColesSJ, HillsRK, WangEC, Burnett AK, Man S, Darley RL, Tonks A. Expression of CD200 on AML blasts directly suppresses memory T-cell function. Leukemia. 2012;26:2148–2151. doi:10.1038/leu.2012.77.
- Marttila-Ichihara F, Turja R, Miiluniemi M, Karikoski M, Maksimow M, Niemela J, Martinez-Pomares L, Salmi M, Jalkanen S Macrophage mannose receptor on lymphatics controls cell trafficking. Blood. 2008;112:64–72. doi:10.1182/blood-2007-10-118984.
- Xu ZJ, Ma JC, Zhou JD, Wen XM, Yao DM, Zhang W, Ji RB, Wu DH, Tang LJ, Deng ZQ, et al. Reduced protocadherin17 expression in leukemia stem cells: the clinical and biological effect in acute myeloid leukemia. J Transl Med. 2019;17:102. doi:10.1186/s12967-019-1851-1.
- Stavropoulou V, Kaspar S, Brault L, Sanders MA, Juge S, Morettini S, Tzankov A, Iacovino M, Lau IJ, Milne TA, et al. MLL-AF9 Expression in hematopoietic stem cells drives a highly invasive AML expressing EMT-related genes linked to poor outcome. Cancer Cell. 2016;30:43–58. doi:10.1016/j.ccell.2016.05.011.